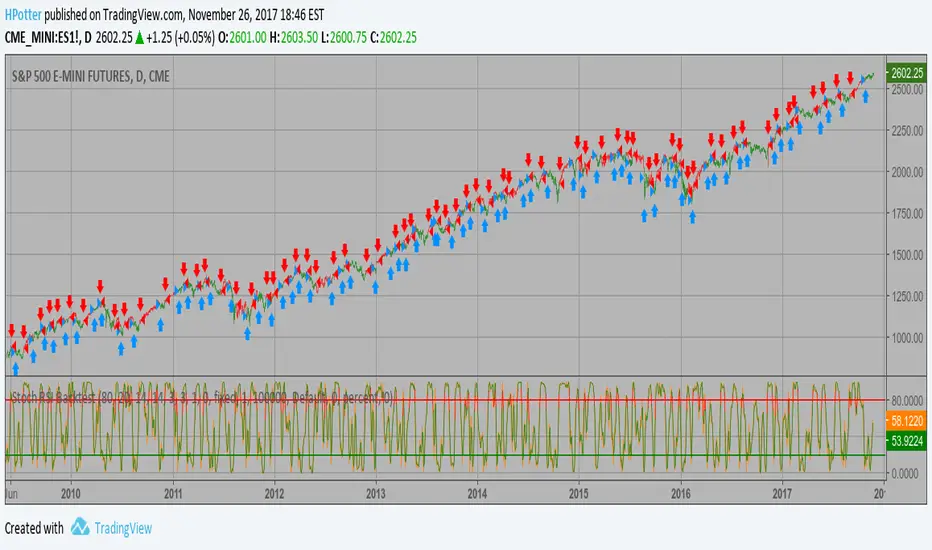
Stochastic RSI Backtest This strategy used to calculate the Stochastic RSI You can change long to short in the Input Settings WARNING: - For purpose educate only - This script to change bars colors.Pine Script® strategyby HPotter33210
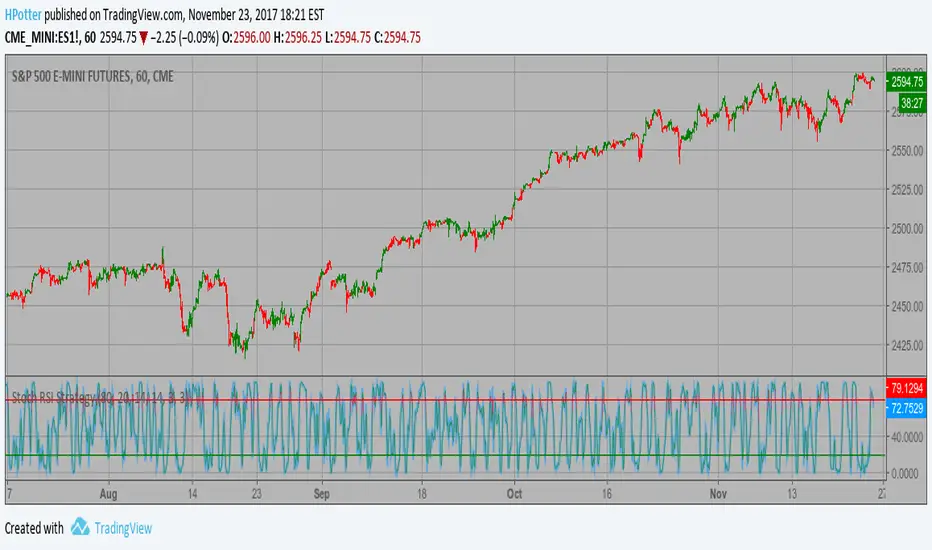
Stochastic RSI Strategy This strategy used to calculate the Stochastic RSIPine Script® indicatorby HPotter178
Statistical Volatility - Extreme Value Method Backtest This indicator used to calculate the statistical volatility, sometime called historical volatility, based on the Extreme Value Method. Please use this link to get more information about Volatility. You can change long to short in the Input Settings WARNING: - For purpose educate only - This script to change bars colors.Pine Script® strategyby HPotter2260
Statistical Volatility - Extreme Value Method This indicator used to calculate the statistical volatility, sometime called historical volatility, based on the Extreme Value Method. Please use this link to get more information about Volatility. Pine Script® indicatorby HPotter2242
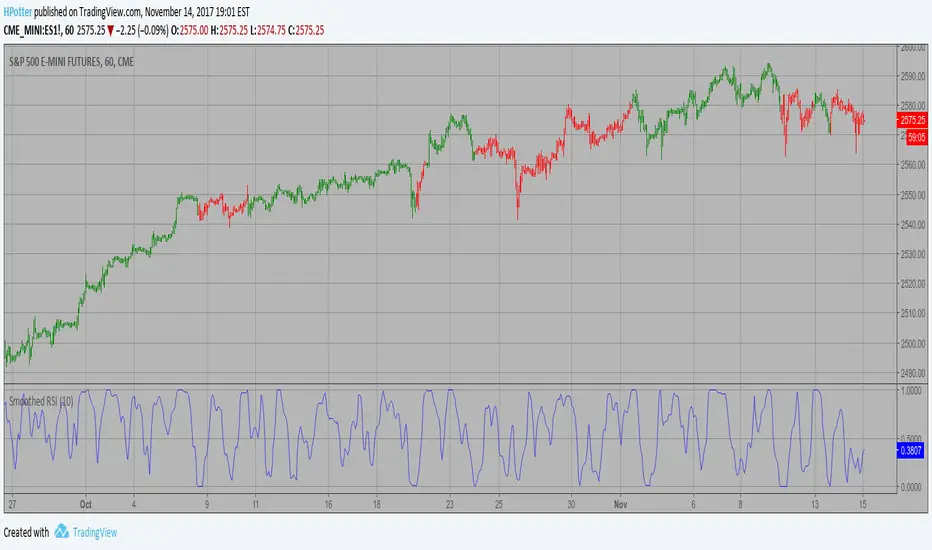
Smoothed RSI Backtest ver.2 This is new version of RSI oscillator indicator, developed by John Ehlers. The main advantage of his way of enhancing the RSI indicator is smoothing with minimum of lag penalty. You can change long to short in the Input Settings WARNING: - For purpose educate only - This script to change bars colors.Pine Script® strategyby HPotter4489
Triple SSMA StrategyA simple trading strategy based on an idea by @sentineli Pine Script® strategyby fskryptUpdated 33427
Smoothed RSI Strategy ver.2 This is new version of RSI oscillator indicator, developed by John Ehlers. The main advantage of his way of enhancing the RSI indicator is smoothing with minimum of lag penalty. WARNING: - This script to change bars colors.Pine Script® indicatorby HPotter1169
Smoothed RSI Backtest This is new version of RSI oscillator indicator, developed by John Ehlers. The main advantage of his way of enhancing the RSI indicator is smoothing with minimum of lag penalty. You can change long to short in the Input Settings WARNING: - For purpose educate only - This script to change bars colors.Pine Script® strategyby HPotter61
Smoothed RSI Strategy This is new version of RSI oscillator indicator, developed by John Ehlers. The main advantage of his way of enhancing the RSI indicator is smoothing with minimum of lag penalty. WARNING: - This script to change bars colors.Pine Script® indicatorby HPotter56
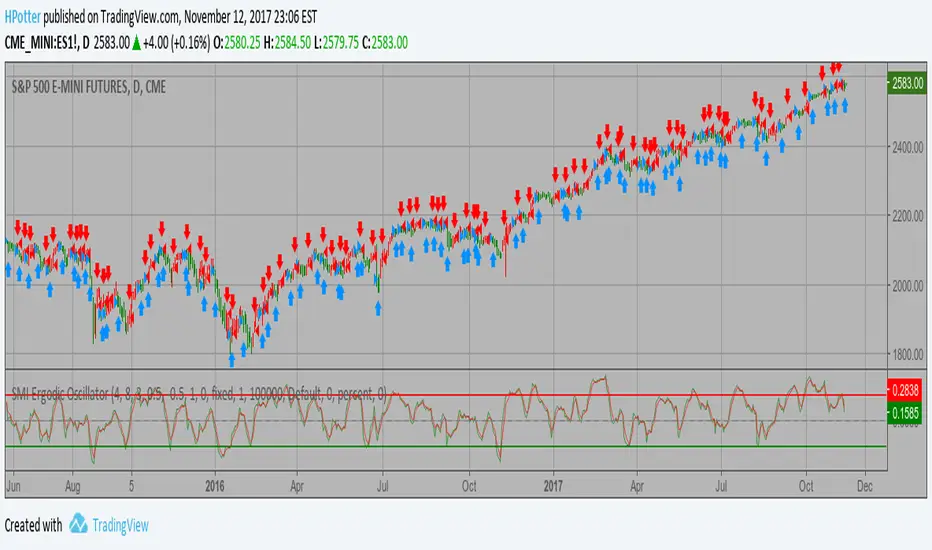
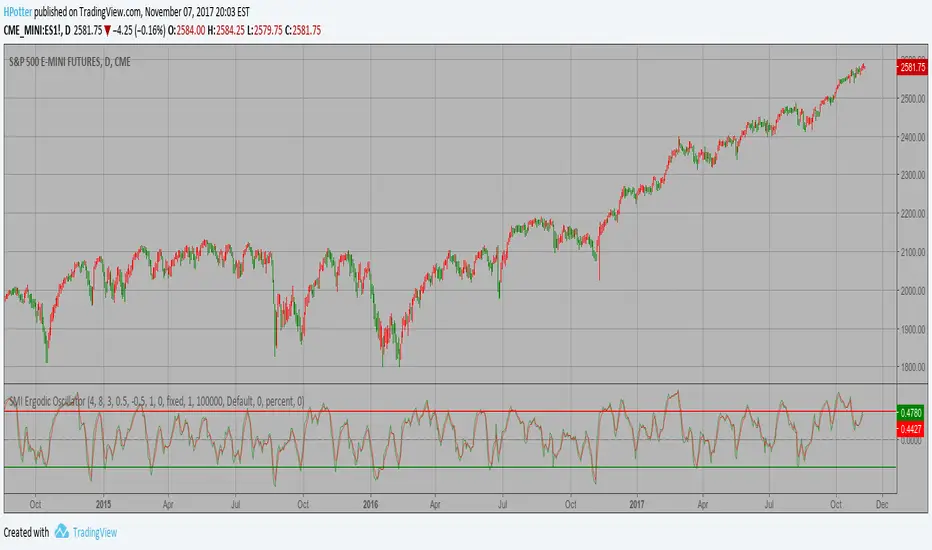
SMI Ergodic Oscillator Backtest ver.2 The SMI Ergodic Indicator is the same as the True Strength Index (TSI) developed by William Blau, except the SMI includes a signal line. The SMI uses double moving averages of price minus previous price over 2 time frames. The signal line, which is an EMA of the SMI, is plotted to help trigger trading signals. Adjustable guides are also given to fine tune these signals. The user may change the input (close), method (EMA), period lengths and guide values. You can use in the xPrice any series: Open, High, Low, Close, HL2, HLC3, OHLC4 and ect... WARNING: - For purpose educate onlyPine Script® strategyby HPotter22104
SMI Ergodic Oscillator Strategy ver.2 The SMI Ergodic Indicator is the same as the True Strength Index (TSI) developed by William Blau, except the SMI includes a signal line. The SMI uses double moving averages of price minus previous price over 2 time frames. The signal line, which is an EMA of the SMI, is plotted to help trigger trading signals. Adjustable guides are also given to fine tune these signals. The user may change the input (close), method (EMA), period lengths and guide values. You can use in the xPrice any series: Open, High, Low, Close, HL2, HLC3, OHLC4 and ect... WARNING: - For purpose educate onlyPine Script® strategyby HPotter113
SMI Ergodic Oscillator Backtest The SMI Ergodic Indicator is the same as the True Strength Index (TSI) developed by William Blau, except the SMI includes a signal line. The SMI uses double moving averages of price minus previous price over 2 time frames. The signal line, which is an EMA of the SMI, is plotted to help trigger trading signals. Adjustable guides are also given to fine tune these signals. The user may change the input (close), method (EMA), period lengths and guide values. You can use in the xPrice any series: Open, High, Low, Close, HL2, HLC3, OHLC4 and ect... You can change long to short in the Input Settings WARNING: - For purpose educate only - This script to change bars colors.Pine Script® strategyby HPotter89
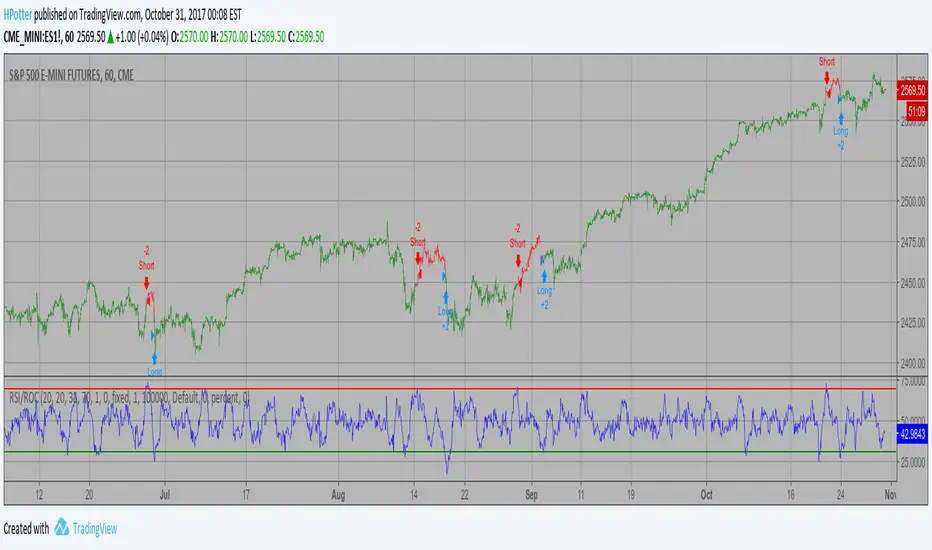
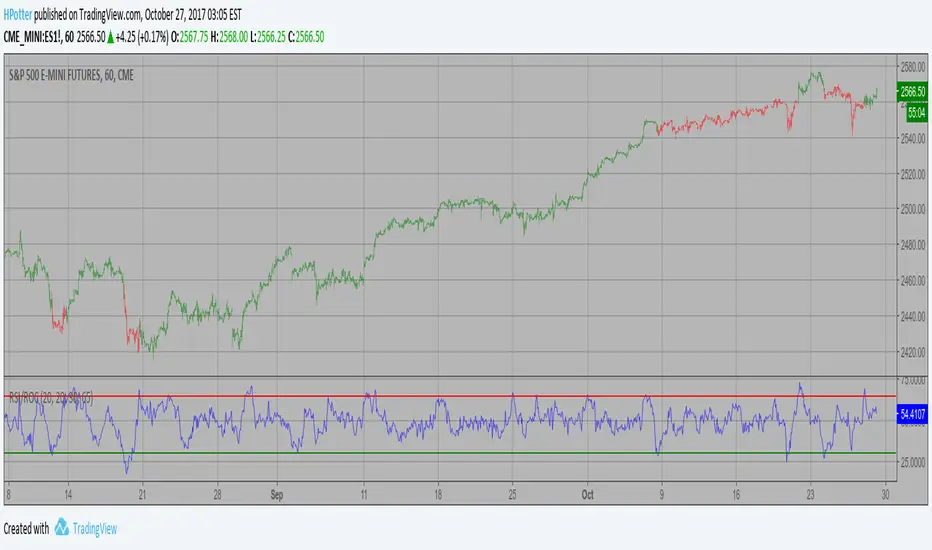
RSI based on ROC Backtest This is the new-age indicator which is version of RSI calculated upon the Rate-of-change indicator. The name "Relative Strength Index" is slightly misleading as the RSI does not compare the relative strength of two securities, but rather the internal strength of a single security. A more appropriate name might be "Internal Strength Index." Relative strength charts that compare two market indices, which are often referred to as Comparative Relative Strength. And in its turn, the Rate-of-Change ("ROC") indicator displays the difference between the current price and the price x-time periods ago. The difference can be displayed in either points or as a percentage. The Momentum indicator displays the same information, but expresses it as a ratio. You can change long to short in the Input Settings WARNING: - For purpose educate only - This script to change bars colors.Pine Script® strategyby HPotter133
RSI based on ROC Strategy This is the new-age indicator which is version of RSI calculated upon the Rate-of-change indicator. The name "Relative Strength Index" is slightly misleading as the RSI does not compare the relative strength of two securities, but rather the internal strength of a single security. A more appropriate name might be "Internal Strength Index." Relative strength charts that compare two market indices, which are often referred to as Comparative Relative Strength. And in its turn, the Rate-of-Change ("ROC") indicator displays the difference between the current price and the price x-time periods ago. The difference can be displayed in either points or as a percentage. The Momentum indicator displays the same information, but expresses it as a ratio. WARNING: - This script to change bars colors.Pine Script® indicatorby HPotter96
Relative Volatility Index Backtest The RVI is a modified form of the relative strength index (RSI). The original RSI calculation separates one-day net changes into positive closes and negative closes, then smoothes the data and normalizes the ratio on a scale of zero to 100 as the basis for the formula. The RVI uses the same basic formula but substitutes the 10-day standard deviation of the closing prices for either the up close or the down close. The goal is to create an indicator that measures the general direction of volatility. The volatility is being measured by the 10-days standard deviation of the closing prices. You can change long to short in the Input Settings WARNING: - For purpose educate only - This script to change bars colors.Pine Script® strategyby HPotter3387
Relative Volatility Index Strategy The RVI is a modified form of the relative strength index (RSI). The original RSI calculation separates one-day net changes into positive closes and negative closes, then smoothes the data and normalizes the ratio on a scale of zero to 100 as the basis for the formula. The RVI uses the same basic formula but substitutes the 10-day standard deviation of the closing prices for either the up close or the down close. The goal is to create an indicator that measures the general direction of volatility. The volatility is being measured by the 10-days standard deviation of the closing prices. WARNING: - This script to change bars colors.Pine Script® indicatorby HPotter56
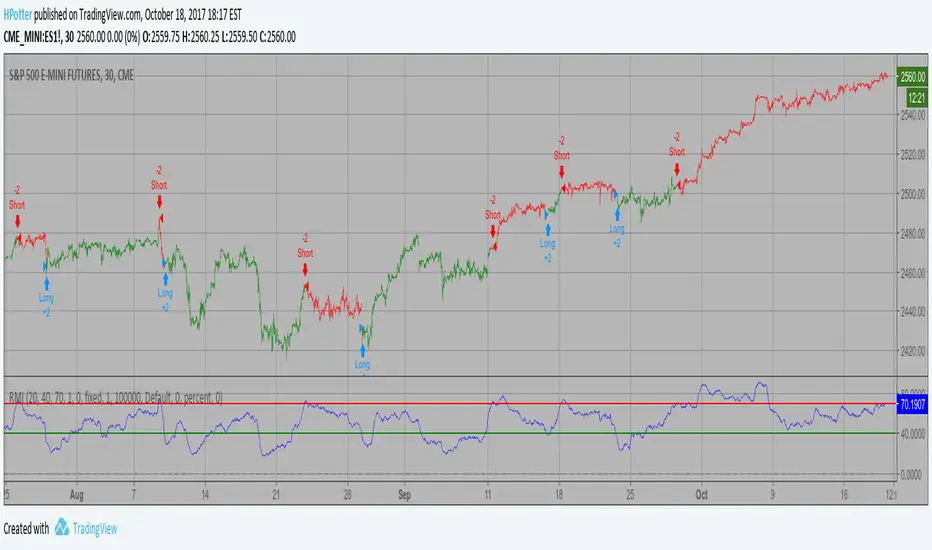
Relative Momentum Index Backtest The Relative Momentum Index (RMI) was developed by Roger Altman. Impressed with the Relative Strength Index's sensitivity to the number of look-back periods, yet frustrated with it's inconsistent oscillation between defined overbought and oversold levels, Mr. Altman added a momentum component to the RSI. As mentioned, the RMI is a variation of the RSI indicator. Instead of counting up and down days from close to close as the RSI does, the RMI counts up and down days from the close relative to the close x-days ago where x is not necessarily 1 as required by the RSI). So as the name of the indicator reflects, "momentum" is substituted for "strength". You can change long to short in the Input Settings WARNING: - For purpose educate only - This script to change bars colors.Pine Script® strategyby HPotter161
Relative Momentum Index Strategy The Relative Momentum Index (RMI) was developed by Roger Altman. Impressed with the Relative Strength Index's sensitivity to the number of look-back periods, yet frustrated with it's inconsistent oscillation between defined overbought and oversold levels, Mr. Altman added a momentum component to the RSI. As mentioned, the RMI is a variation of the RSI indicator. Instead of counting up and down days from close to close as the RSI does, the RMI counts up and down days from the close relative to the close x-days ago where x is not necessarily 1 as required by the RSI). So as the name of the indicator reflects, "momentum" is substituted for "strength". WARNING: - This script to change bars colors.Pine Script® indicatorby HPotter67
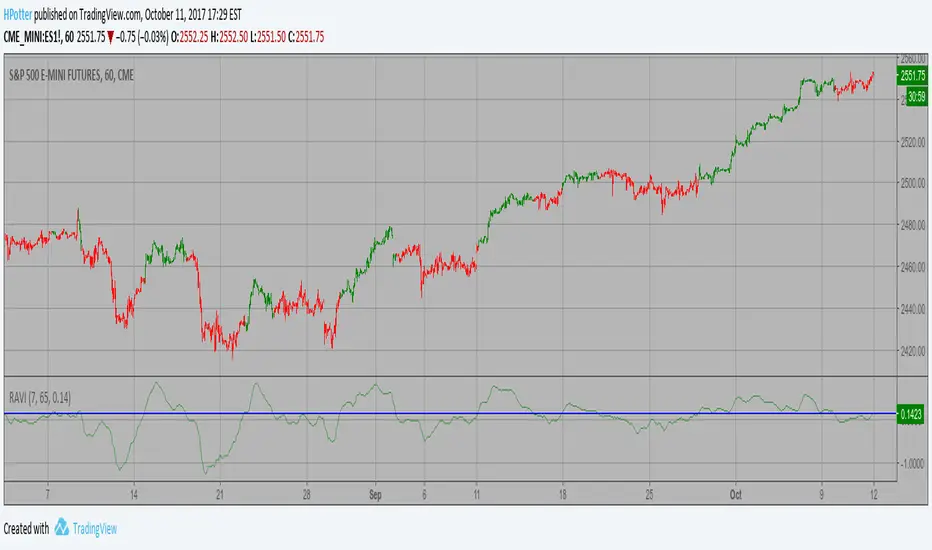
Range Action Verification Index (RAVI) Backtest The indicator represents the relative convergence/divergence of the moving averages of the financial asset, increased a hundred times. It is based on a different principle than the ADX. Chande suggests a 13-week SMA as the basis for the indicator. It represents the quarterly (3 months = 65 working days) sentiments of the market participants concerning prices. The short moving average comprises 10% of the one and is rounded to seven. You can change long to short in the Input Settings WARNING: - For purpose educate only - This script to change bars colors.Pine Script® strategyby HPotter93
Range Action Verification Index (RAVI) Strategy The indicator represents the relative convergence/divergence of the moving averages of the financial asset, increased a hundred times. It is based on a different principle than the ADX. Chande suggests a 13-week SMA as the basis for the indicator. It represents the quarterly (3 months = 65 working days) sentiments of the market participants concerning prices. The short moving average comprises 10% of the one and is rounded to seven. WARNING: - This script to change bars colors.Pine Script® indicatorby HPotter97
Positive Volume Index Backtest The theory behind the indexes is as follows: On days of increasing volume, you can expect prices to increase, and on days of decreasing volume, you can expect prices to decrease. This goes with the idea of the market being in-gear and out-of-gear. Both PVI and NVI work in similar fashions: Both are a running cumulative of values, which means you either keep adding or subtracting price rate of change each day to the previous day`s sum. In the case of PVI, if today`s volume is less than yesterday`s, don`t add anything; if today`s volume is greater, then add today`s price rate of change. For NVI, add today`s price rate of change only if today`s volume is less than yesterday`s. You can change long to short in the Input Settings WARNING: - For purpose educate only - This script to change bars colors.Pine Script® strategyby HPotterUpdated 33204
Positive Volume Index Strategy The theory behind the indexes is as follows: On days of increasing volume, you can expect prices to increase, and on days of decreasing volume, you can expect prices to decrease. This goes with the idea of the market being in-gear and out-of-gear. Both PVI and NVI work in similar fashions: Both are a running cumulative of values, which means you either keep adding or subtracting price rate of change each day to the previous day`s sum. In the case of PVI, if today`s volume is less than yesterday`s, don`t add anything; if today`s volume is greater, then add today`s price rate of change. For NVI, add today`s price rate of change only if today`s volume is less than yesterday`s. WARNING: - This script to change bars colors.Pine Script® indicatorby HPotter205
Simply Stochastic Backtest This back testing strategy generates a long trade at the Open of the following bar when the %K line crosses up UpBand line. It generates a short trade at the Open of the following bar when the %K line crosses down DownBand line. You can change long to short in the Input Settings WARNING: - For purpose educate only - This script to change bars colors.Pine Script® strategyby HPotter45