RCAzussie_HAMA Candles Final HAMA Candles & Auto S/R System
* Overview
This indicator combines the trend-following power of HAMA (Heiken Ashi Moving Average) candles with an Automated Support & Resistance system. It is designed to filter out market noise and identify key reversal levels efficiently.
* Key Features
HAMA Candles (Trend)
Smoothed candles help visualize the true market trend.
Green: Bullish Trend
Red: Bearish Trend
Includes a central MA line with gradient colors to indicate trend strength.
Auto Support & Resistance (Levels)
Automatically plots dynamic S/R levels based on pivot points.
Level 1 (White): Short-term (Lookback 5) - For scalping.
Level 2 (Yellow): Mid-term (Lookback 10) - For swing trading.
Level 3 (Orange): Long-term (Lookback 20) - Strongest levels.
* Simplified Alerts
MA Cross (Any): Triggers when price crosses the main MA line (Trend entry/exit).
Major S/R Touch: Triggers ONLY when price touches the strongest Level 3 lines (Reversal check).
* Recommended Chart Setup (Important)
Use Range Bars: This system is optimized for Range Charts, not standard time-based candles (e.g., 1m, 5m).
Focus on Price: Range bars ignore the time axis completely and generate new bars only when the price moves a specific amount. This eliminates time-based noise.
How to Set:
Click the timeframe menu in the top bar.
Select "Range".
Choose a value based on volatility (e.g., 40R for scalping, 100R for crypto/indices).
HAMA 캔들 & 자동 지지저항 시스템
* 개요:
이 지표는 HAMA (Heiken Ashi Moving Average) 캔들의 추세 추종 기능과 자동 지지/저항(S/R) 시스템을 결합한 도구임. 시장의 노이즈를 제거하고 핵심 반전 구간을 찾는 데 최적화됨.
* 핵심 기능
HAMA 캔들 (추세)
노이즈가 제거된 부드러운 캔들로 진짜 추세를 보여줌.
초록색: 상승 추세
빨간색: 하락 추세
중앙 MA 라인의 그라디언트 색상으로 추세 강도를 시각적으로 확인 가능.
자동 지지 & 저항 (레벨)
피봇 포인트 기반으로 지지/저항선을 자동 작도함.
Level 1 (흰색): 단기 (Lookback 5) - 스캘핑용
Level 2 (노란색): 중기 (Lookback 10) - 스윙용
Level 3 (주황색): 장기 (Lookback 20) - 가장 강력한 지지/저항 구간
간편 알람 (Alerts)
MA Cross (Any): 가격이 중앙 MA 라인을 돌파할 때 울림 (진입/청산 신호).
Major S/R Touch: 가장 강력한 Level 3 라인을 터치할 때만 울림 (반전 확인용).
* 추천 차트 설정 (필독)
레인지(Range) 차트 사용: 이 지표는 일반적인 시간 봉(분봉, 시봉)이 아니라 레인지 바에 최적화되어 있음.
가격 집중: 시간의 흐름(X축)을 무시하고, 오직 '가격'이 움직일 때만 캔들이 생성됨. 이렇게 하면 횡보 구간의 노이즈가 사라짐.
설정 방법:
트레이딩뷰 상단 시간 메뉴 클릭.
'Range' 선택.
자산 변동성에 맞춰 값 설정 (예: 스캘핑은 40R, 비트코인/지수는 100R 추천).
알씨아저씨
BLOG: blog.naver.com
Suporte

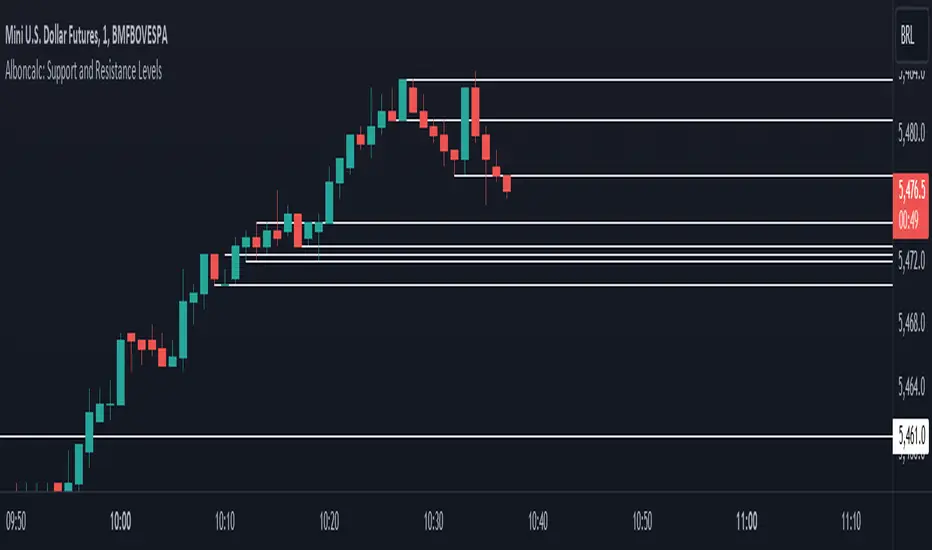
Alboncalc: Support and Resistance LevelsAlboncalc: Support and Resistance Levels
Description:
Alboncalc is an innovative TradingView indicator that identifies significant support and resistance levels based on patterns where two candles form equal highs and/or lows. This indicator automatically plots these critical levels on the chart, providing traders with clear visual cues of potential price reversal or consolidation points.
Originality and Usefulness:
Alboncalc stands out for its ability to detect specific candle patterns that indicate support and resistance, setting it apart from traditional support and resistance indicators. This specific method of price action analysis offers a unique and refined perspective for traders, adding value to the body of knowledge within the TradingView community.
How It Works:
Alboncalc analyzes historical prices to identify where two consecutive candles achieve equal highs or lows. When these conditions are met, the indicator automatically plots a support or resistance line on the chart. These levels are dynamically updated, ensuring that traders always have the most relevant and accurate information.
How to Use:
Installation: Add Alboncalc to your chart on TradingView.
Interpretation: Observe the plotted support and resistance lines. These lines indicate potential reversal or consolidation points.
Application: Use these levels to confirm breakout points or identify areas of price exhaustion. The clear visualization of technical levels helps enhance your trading strategies.
Underlying Concepts:
Alboncalc is based on price action analysis, focusing on specific candle patterns that signal important technical levels. The formation of two candles with equal highs or lows indicates a temporary balance between buyers and sellers, suggesting potential price direction changes.
Phicube EMASAR ( EMA Support and Resistance )Indicator based on the Concept created by Bo Williams. But unlike the original that uses MIMAs, EMAs are used here.
Exponential moving averages will be shown according to fractal alignment, in order to show the important support and resistance levels ( SAR ).
When the fractals are aligned to become support,
we will have the EMA in the graph with a bright color.
When the fractals are aligned to become resistance, we will have EMA in the graph with a matte color.
Available exponential moving averages: 17,34,72,144,305,610,1292 and 2584
____________________________________________________//_____________________________________________________________________
Indicador baseado no Conceito criado pelo Bo Williams. Mas diferente do original que utiliza MIMAs, aqui é utilizado EMAs.
As médias móveis exponenciais serão mostradas de acordo com o alinhamento dos fractais, com objetivo de mostrar os níveis importantes
de suporte e resistência( SAR ).
Quando estiver com os fractais alinhados virando suporte, teremos no gráfico a EMA com uma cor em tom brilhante.
Quando estiver com os fractais alinhados virando resistência, teremos no gráfico a EMA com uma cor em tom fosco.
Médias móveis exponenciais disponíveis: 17,34,72,144,305,610,1292 e 2584

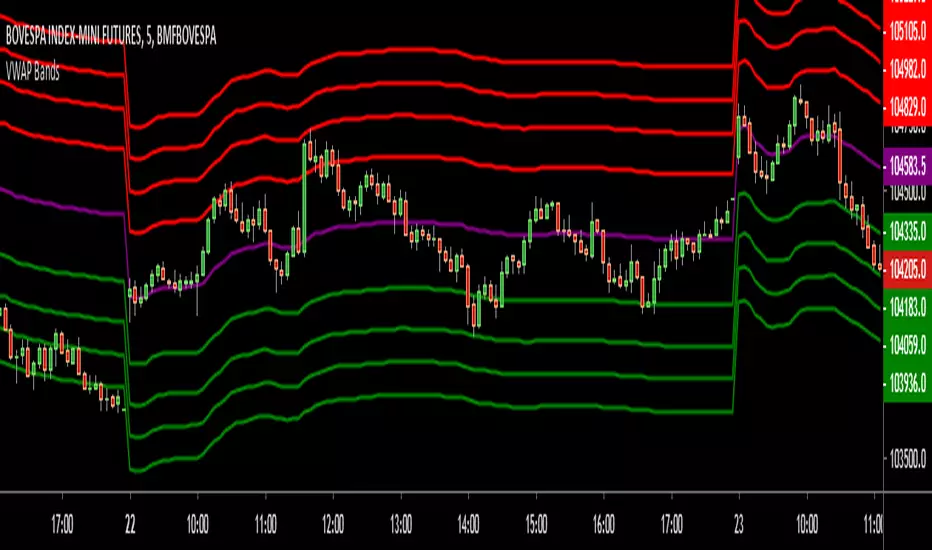
VWAP BandsThis indicator plots distant VWAP lines that serve as support and resistance. You can add more lines from the script.
Good trades!
AVERAGE MULTI_SMAIndicator returns an average of 5 SMAs. an interesting point that I have noticed that the price has several times reacted on it.
Note 1: Do not just use this as a criterion for buying and selling, use as one more aid.
Note 2: It is possible to leave in the chart all the averages, if you feel it necessary.
------------------------------------//--------------------------------------------------
Indicador retorna uma média de 5 SMAs. um ponto interessante que tenho notado que o preço tem diversas vezes reagido nele.
Observação 1: Não use apenas isso como critério para compra e venda, use como mais um auxilio.
Observação 2: É possivel deixar no grafico todas as médias, caso você ache necessário.
