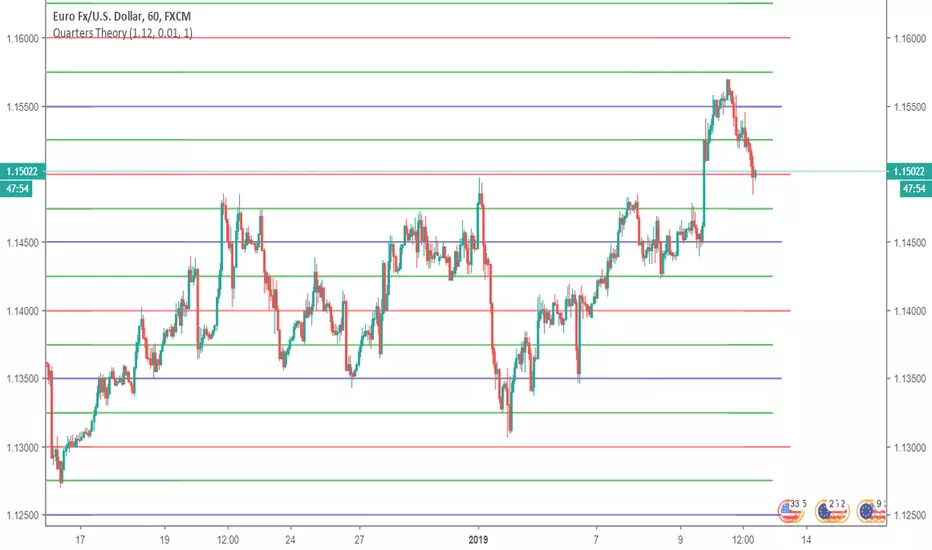
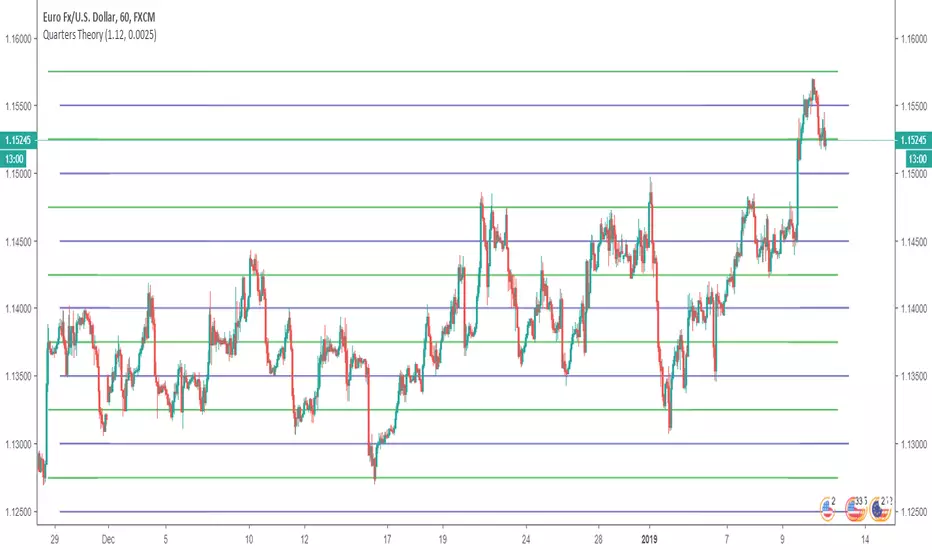
Quarters TheoryIndicator that lets you to put Whole (red), Half (blue) and Quarter (green) levels on a chart, which work as support/resistance levels. Defaults are only for EURUSD, for other symbols you have to change the settings. First input is "Starting Price (Bottom)", which should be the lowest point you want your levels to be. There are only 10 Whole levels on this indicator, but if you want you could add them from pine editor. The next input is "Next Whole Level" this is the price from one whole level to next whole level, for example for EURUSD it is 0.01. The third input is for removing the quarter lines (green lines), if you want to remove them set this option to "0", otherways leave this to "1".
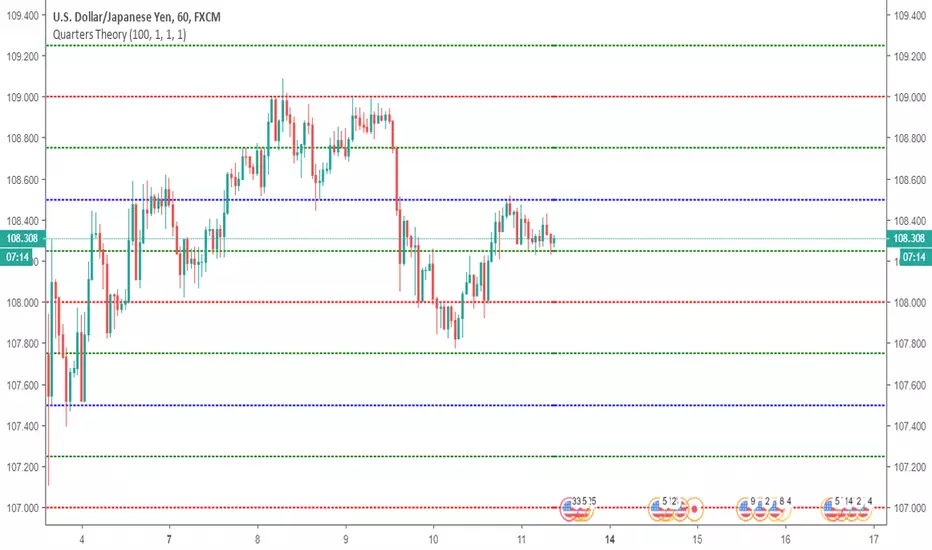
This indicator looks very good on JPY and NZD pairs.
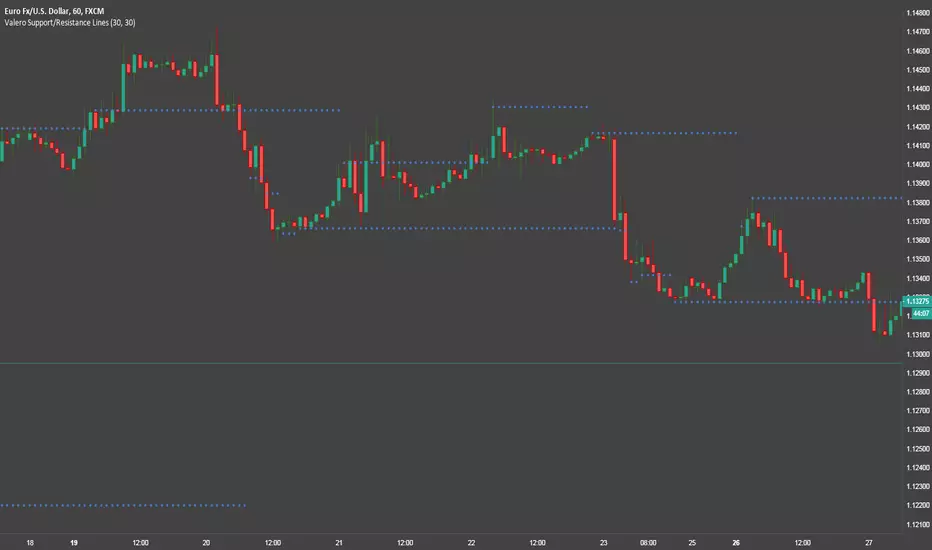
Works on long term too:
Learned from him: www.youtube.com
Pine Script® indicator