Eggy Signal V2.1This script is a fully automated mechanical trading system designed to identify high-probability continuation setups based on significant market volatility expansions. It moves beyond simple crossovers or lagging indicators by analyzing price action structure and momentum velocity.
The algorithm detects specific "price disconnects" where aggressive buying volume has occurred, creating a high-value zone for potential re-entries. It waits for the market to efficiently rebalance and test these zones before signaling a trade, ensuring that you only engage with the market at discounted prices.
Key Features:
Algorithmic Zone Detection: The script automatically scans for significant volatility expansions. It uses an ATR (Average True Range) filter to ignore market noise and small fluctuations, focusing only on high-impact moves that indicate genuine institutional interest.
Smart Workflow (State Machine): Unlike standard indicators that spam signals, this tool uses a "State Machine" logic. It follows a strict discipline:
Phase 1 (Scan): Hunts for valid momentum zones.
Phase 2 (Wait): Projects a Limit Order setup (Entry, Stop Loss, Take Profit) and waits for the price to return (pullback).
Phase 3 (Active): Only activates the trade status if the price strictly touches the entry level.
Analysis Validation ("Missed Trade" Logic): A unique feature of this system is its ability to validate analysis even if no trade is taken. If the market respects the zone and hits the target without triggering your entry first, it marks the setup as "MISSED (Analysis OK)" in Green. This confirms the directional bias was correct, helping you build confidence in the algorithm without skewing your PnL.
Strict Risk Management: The system comes with a built-in, fixed Risk-to-Reward ratio (Default 1:2) to ensure positive expectancy over the long term.
How to Use:
Wait for the Setup: When a valid zone is detected, the script will draw the Entry (Blue), Stop Loss (Red), and Target (Green) lines. The status will read "WAITING".
Prepare Order: Place a Limit Order at the Blue line shown on the chart.
Execution:
If price touches the Blue line, the trade becomes "ACTIVE".
If price hits the Green line, it is a "WIN".
If price hits the Red line, it is a "LOSS".
Auto-Reset: Once a trade is concluded (Win/Loss) or invalidated, the drawings automatically clear to keep your chart clean for the next opportunity.
Settings:
Swing Length: Adjusts the sensitivity of the market structure detection.
Risk Reward: Define your target multiple (e.g., 1:2 or 1:1.5).
Minimum Zone Size (Volatility Filter): Filters out insignificant moves. Higher values = fewer but higher quality setups.
24 minutes ago
Release Notes
With Alerts
⚠️ How to Activate Notifications (Mobile & PC)
Add the Indicator to your chart first.
On the right toolbar, click the Alerts icon (looks like a clock).
Click the Create Alert button (the + icon).
Condition: Change it from the symbol (e.g., XAUUSD) to Eggy Signal V2 (With Alerts).
Trigger: Select "Any alert() function call".
Important: You must select this option because the code uses dynamic alert() messages.
Notifications tab:
Check Notify in App (to get notifications on your phone).
Check Show Pop-up (to see it on your PC screen).
Alert Name: Give it a name (e.g., "Eggy Signal V2").
Click Create.
Support and Resistance

Alpha Net Pro Support/ResistanceAlpha Net Pro Support/Resistance is a hybrid indicator that combines pivot-based support/resistance zone detection with Stochastic RSI to highlight high-probability reversal points. It is designed to help traders identify areas where price action is likely to react, and generate context-aware buy/sell signals based on momentum and structure alignment.
This tool overlays adaptive support/resistance channels directly on the chart while scaling the Stochastic RSI oscillator visually to the price action, enhancing usability in live environments.

Eggy Signal V2This script is a fully automated mechanical trading system designed to identify high-probability continuation setups based on significant market volatility expansions. It moves beyond simple crossovers or lagging indicators by analyzing price action structure and momentum velocity.
The algorithm detects specific "price disconnects" where aggressive buying volume has occurred, creating a high-value zone for potential re-entries. It waits for the market to efficiently rebalance and test these zones before signaling a trade, ensuring that you only engage with the market at discounted prices.
Key Features:
Algorithmic Zone Detection: The script automatically scans for significant volatility expansions. It uses an ATR (Average True Range) filter to ignore market noise and small fluctuations, focusing only on high-impact moves that indicate genuine institutional interest.
Smart Workflow (State Machine): Unlike standard indicators that spam signals, this tool uses a "State Machine" logic. It follows a strict discipline:
Phase 1 (Scan): Hunts for valid momentum zones.
Phase 2 (Wait): Projects a Limit Order setup (Entry, Stop Loss, Take Profit) and waits for the price to return (pullback).
Phase 3 (Active): Only activates the trade status if the price strictly touches the entry level.
Analysis Validation ("Missed Trade" Logic): A unique feature of this system is its ability to validate analysis even if no trade is taken. If the market respects the zone and hits the target without triggering your entry first, it marks the setup as "MISSED (Analysis OK)" in Green. This confirms the directional bias was correct, helping you build confidence in the algorithm without skewing your PnL.
Strict Risk Management: The system comes with a built-in, fixed Risk-to-Reward ratio (Default 1:2) to ensure positive expectancy over the long term.
How to Use:
Wait for the Setup: When a valid zone is detected, the script will draw the Entry (Blue), Stop Loss (Red), and Target (Green) lines. The status will read "WAITING".
Prepare Order: Place a Limit Order at the Blue line shown on the chart.
Execution:
If price touches the Blue line, the trade becomes "ACTIVE".
If price hits the Green line, it is a "WIN".
If price hits the Red line, it is a "LOSS".
Auto-Reset: Once a trade is concluded (Win/Loss) or invalidated, the drawings automatically clear to keep your chart clean for the next opportunity.
Settings:
Swing Length: Adjusts the sensitivity of the market structure detection.
Risk Reward: Define your target multiple (e.g., 1:2 or 1:1.5).
Minimum Zone Size (Volatility Filter): Filters out insignificant moves. Higher values = fewer but higher quality setups.

Institutional Zones | Rushi TradesA minimalist Supply & Demand indicator designed for professional scalpers. Filters out noise by identifying only high-momentum institutional zones. Features dynamic visibility (shows only the nearest zones) and auto-cleans broken levels to keep your chart pristine.
Premium Zones is a high-precision technical tool designed for traders who value chart clarity and institutional logic. Unlike standard support/resistance indicators that clutter the screen with hundreds of lines, this script focuses purely on Significant Structure.
It identifies Supply and Demand zones based on Price Velocity—ensuring that a level is only drawn if price reacted aggressively from that point (a sign of institutional order flow).
Key Features:
Velocity-Based Detection:
The algorithm does not rely on simple pivots. It requires a "Strong Move" (customizable Momentum Strength) away from a level to confirm it as a valid zone. This filters out weak retail levels and "stop hunts."
Dynamic Visibility Engine (The "Clean Chart" Protocol):
Nearest Zones Only: You can set a limit (e.g., 3 or 5). The script automatically hides zones that are far away and only displays the ones closest to current price. As price moves, new zones fade in automatically.
Auto-Management:
Break & Delete: If a candle closes beyond a zone, the script instantly deletes it. No more confusing "ghost levels" from the past.
Live Updates: Zones extend automatically until they are tested or broken.
Premium Aesthetics:
Designed with a "Glass" transparency effect.
Smart Labels: Price tags are placed externally (floating above/below the zone) in clean black text, ensuring they never obscure the candle action inside the zone.
Recommended Settings:
This indicator is highly effective for volatile assets like XAUUSD (Gold), US30, and Forex/Indian Majors.
For XAUUSD (Gold) Scalping (M5 / M15):
Pivot Lookback: 15 (Filters local noise)
Momentum Strength: 2.0/1.5 (Ensures only violent reversals are caught)
Max Visible Zones: 3 (Keeps focus on immediate price action)
For Day Trading / Swing (H1 / H4):
Pivot Lookback: 10
Momentum Strength: 1/1.5
Max Visible Zones: 3
How to Trade With It:
The Rejection: Do not place blind limit orders. Wait for price to enter a Premium Zone and show a rejection candle (wick) or a shift in market structure on a lower timeframe.
First Touch: These zones are most accurate on the first retest.
Developed by Rushi Trades

TR-ATR-DATR+MAs shows the Range of selected Candle + 3 Moving Averages
True Range
Avg True Range
Daily Range


Ghost Matrix [Bit2Billions]Ghost Matrix — Institutional Market Structure Engine
*A unified price-mapping system built on original logic, designed for professional-grade market structure analysis.*
Ghost Matrix is a closed-source script engineered to give traders a single, coherent view of liquidity, structure, swings, trend pressure, and institutional behavior across all time horizons.
It is not a mashup of public indicators. Every module is built around the same proprietary internal engines, ensuring consistency, originality, and practical trading value.
The script’s purpose is to solve a common problem among traders: multiple indicators producing conflicting signals.
Ghost Matrix consolidates structure, liquidity, momentum, zone logic, and higher-timeframe context into one synchronized framework.
Ghost Matrix is driven by three custom systems:
1. Proprietary Swing & Pivot Engine (Ghost Swing Engine)
This engine determines market turning points using:
* Adaptive displacement logic
* Dynamic pivot length calculations
* Fractal-strength scoring
* Multi-tier swing confirmation
These swings act as the foundation for BOS, CHoCH, liquidity lines, and zone detection.
This method is not based on standard fractals, ZigZag, or public swing scripts.
2. Structural Mapping Engine (Institutional Model Layer)
This system evaluates structure in the same narrative sequence used by advanced traders:
* Internal vs. external structure
* Trend progression vs. structural failure
* Strength/weakness of highs & lows
* Volatility-based CHoCH/BOS validation
This ensures structure is not drawn based on a single candle pattern, but from a multi-step decision model.
3. Adaptive Confluence Engine
Trend, volume, zones, and momentum modules respond to the structure engine, producing *contextual* signals instead of isolated indicators.
This includes:
* Adaptive moving average engine (custom smoothing + gradient logic)
* Demand/supply zones derived from momentum + displacement + volume footprints
* Ichimoku behavior model (crosses, twists, regime shifts)
* Multi-pivot target engine
This creates a full ecosystem rather than individual tools merged together.
Why This Script Has Genuine Value
✔ A unified structural ecosystem (not a mashup)
Every module connects to the same logic layers so the chart tells one consistent story.
✔ Proprietary decision-making logic
Swing detection, structure interpretation, liquidity lines, and zones are built from original formulas—not from built-ins or simple replications.
✔ A visual-first trading workflow
All visuals are designed for institutional-style reading:
* Structure confirmation
* Liquidity reach & sweep behavior
* Swing-to-fractal alignment
* Momentum vs. structural conflict
* Regime shifts through Ichimoku + MA pressure
✔ Designed for traders who rely on narrative-based execution
The indicator replaces:
* Manual swing marking
* Structure identification
* BOS/CHOCH tracking
* Liquidity mapping
* Zone drawing
* Trend mapping
* Volume context
* HTF candle overlays
All in a single, consistent tool.
Key Components & Intent
Market Structure Module (ICT/SMC Integration)
Detects:
* BOS / CHOCH
* BMS / SMS
* Internal / external structure
* IDM
* Liquidity lines (LQDT / Dynamic LQDT)
* FVG, EQH, EQL
* Strong/weak swing points
Purpose: provide a complete reading of institutional structure transitions.
Swing Visualization
Includes:
* Swing highs/lows
* Horizontal levels
* Connector lines
* Extension shadows
* Swing summary tables
Purpose: show turning points with clarity and narrative continuity.
Demand & Supply Zone Engine
Zones consider:
* Momentum displacement
* Volume presence
* Swing strength
* Structural side (pro-trend vs. corrective)
Purpose: highlight zones institutional traders monitor.
Adaptive Trend Model
Custom gradient-based MA system that reacts to:
* Volatility
* Momentum shifts
* Directional strength
Purpose: provide dynamic trend insight, not static MA interpretation.
Ichimoku Regime State (Modified)
Includes:
* TK Cross
* Kijun Cross
* Chikou interactions
* Kumo breakouts + twists
Purpose: define regime shifts and trend environments.
Aggregated Candles (Enhanced Same-Timeframe View)
Provides a refined, information-rich candle structure using the current chart’s timeframe only, offering deeper behavior insights without switching charts.
Dashboard
Shows:
* Swing direction
* CISD structure state
* Fractal alignment %
* Ichimoku events
* Consolidated signals
Visual Design (Clutter-Free Standard)
* Only real-time labels appear; historical labels stay hidden for clarity.
* Consistent, structured line styles:
* Trendlines: solid green/red
* CHOCH: dashed red/green
* BOS: solid red/green
* LQDT/Dynamic: yellow dotted
* EQH/EQL: red/green dotted
* CISD & IDM: gray dotted
This color logic helps traders read structure quickly.
Recommended Use
* Best on: 15m, 1H, 4H, Daily, Weekly
* Works across: crypto, forex, indices, liquid equities
* Pivot tools may show noise on illiquid markets
Performance Notes
* Heavy modules can draw many objects → disable what you don’t need
* Refresh chart if historical buffer limits are reached
* All TV object limits are handled internally
License
* proprietary script © 2025
* Independently developed logic and visualization system
* Redistribution, resale, sharing, or decompilation strictly prohibited
* Any similarity to public concepts is due to overlap with common trading methodologies
Disclaimer
This tool is for educational and research purposes only.
Not financial advice.
Always test responsibly.
FAQs
* Source is intentionally closed
* Alerts can be manually created
* Modules can be toggled
* Designed for multi-market, multi-timeframe workflow
About Ghost Trading Suite
Author: BIT2BILLIONS
Project: Ghost Trading Suite © 2025
Indicators: Ghost Matrix, Ghost Protocol, Ghost Cipher, Ghost Shadow
Strategies: Ghost Robo, Ghost Robo Plus
Pine Version: V6
The Ghost Trading Suite is designed to simplify and automate many aspects of chart analysis. It helps traders identify market structure, divergences, support and resistance levels, and momentum efficiently, reducing manual charting time.
The suite includes several integrated tools — such as Ghost Matrix, Ghost Protocol, Ghost Cipher, Ghost Shadow, Ghost Robo, and Ghost Robo Plus — each combining analytical modules for enhanced clarity in trend direction, volatility, pivot detection, and momentum tracking.
Together, these tools form a cohesive framework that assists in visualizing market behavior, measuring momentum, detecting pivots, and analyzing price structure effectively.
This project focuses on providing adaptable and professional-grade tools that turn complex market data into clear, actionable insights for technical analysis.
Crafted with 💖 by BIT2BILLIONS for Traders. That's All Folks!
Changelog
v1.0 — Core Release
* Added Custom Heikin-Ashi Candles for dust-free, clutter-free charting.
* Introduced Price Line overlay for clean close-price visualization.
* Implemented Adaptive Moving Averages with smooth transitions and gradient coloring.
* Added Intelligent Swing Detection with horizontal lines, shadow extensions, connectors, labels, and summary tables.
* Introduced full Market Structure (ICT & SMC) Mapping including short-, mid-, and long-term structures, IDM, LQDT, Dynamic LQDT, CISD, FVGs, EQH, EQL, premium/discount zones, weak/strong highs and lows, and order blocks.
* Added Demand & Supply Zones with adaptive institutional detection, highlighted boxes, and auto-labeling.
* Integrated Targets (Pivot Systems) supporting Camarilla, Fibonacci, Woodie, and other pivot levels.
* Added Aggregated Candles combining real-time and historical data for multi-timeframe analysis.
* Added General Dashboard consolidating swing direction, CISD state, structure alignment, Ichimoku signals, and overall market overview.
* Included Trend Lines & Ichimoku Modules for enhanced visual market context.

Support Resistance📌 1. Indicator Name
Premium Auto Support & Resistance
📌 2. One-Line Description
An automated S/R system that generates support and resistance zones based on swing highs and lows, displaying them in a premium visual style directly on the chart.
📌 3. Overall Summary (7+ lines)
This indicator automatically detects price levels where the market has repeatedly reacted and generates support and resistance zones.
Instead of simple horizontal lines, it visualizes reaction ranges as zones, helping traders clearly understand the actual price areas where activity occurs.
It uses swing points (high/low pivots) as the fundamental basis and continuously updates only the most meaningful recent S/R levels.
A smoothing process is applied, reducing noise and creating more natural, reliable S/R zones.
Support and resistance are displayed as filled transparency-based zones, enabling intuitive identification of zone strength and market position.
When price touches one of these zones, a small signal appears to highlight potential reversal points.
All elements are plotted directly over the candles with overlay=true, making it an instantly usable and visually premium tool.
📌 4. Advantages (6 items)
① Automatic Swing-Based S/R Detection
Automatically analyzes key pivot points and extracts only the most meaningful support and resistance levels.
② Support/Resistance Zone Structure
Provides intuitive reaction ranges instead of single lines, making it far more practical for real trading.
③ Smooth Premium-Style Lines
S/R lines are smoothed to remove noise, maintaining a natural and refined premium visual appearance.
④ Automatic Candle-Touch Alerts
Displays signals whenever price touches support or resistance, helping you quickly identify potential reversal areas.
⑤ Overlay-Based Immediate Clarity
Drawn directly onto the chart without occupying indicator windows, keeping visual focus on price action.
⑥ Simple Yet Powerful Framework
A pivot + smoothing + zone combination that strengthens automatic S/R detection while remaining easy for beginners to use.

EGGY SIGNALEGGY SIGNAL is a custom trading system designed to eliminate market noise and provide clean, high-probability entry signals. Unlike standard indicators that often give conflicting information, this script uses a Triple Confirmation Algorithm that works in the background.
The script combines three essential market elements:
Trend Filter: Determines the overall market direction to prevent counter-trend trading.
Momentum Detector: Identifies the speed of price movement.
Strength Validator: Confirms the power of the current candle.
How it Works: This indicator utilizes a "Clean Chart" philosophy. You will not see messy lines or clouds.
BUY Signal: Appears only when the Trend is Bullish, Momentum is shifting upwards, and Market Strength is confirmed.
SELL Signal: Appears only when the Trend is Bearish, Momentum is shifting downwards, and Market Strength is confirmed.
Features:
No Repaint: Signals are permanent once the candle closes.
False Signal Filtering: The algorithm automatically filters out signals during choppy/sideways markets.
Proprietary Settings: The input parameters are hardcoded and optimized for specific market conditions to ensure strategy integrity.
How to Use: Simply wait for the "BUY" or "SELL" label to appear. If no label is present, the market is considered neutral or too risky for entry.

Monster PerfectionThe script tracks confluence between Stochastic and RSI. It marks candles where the Stochastic crosses in extreme zones while the RSI shows divergence with price. These signals point to possible short term reversals.

区间顶底|超级趋势|增强版[彩虹EMA]中文介绍 (English description follows)
【脚本概述】 本指标是一个多功能的综合交易系统,旨在通过结合趋势跟踪、动量反转、关键支撑阻力位以及成交量分析,为交易者提供高胜率的决策辅助。它将多个复杂的分析模块融合在一个简洁的图表中,适合日内交易及波段交易。
【核心功能与计算逻辑】
1. 智能支撑与阻力区间 (Support & Resistance Zones)
· 原理:基于自定义长度(默认130周期)的高低点回溯,结合ATR(平均真实波幅)计算出的动态顶底区间。
· 视觉:紫色区域为阻力区(潜在卖点),绿色区域为支撑区(潜在买点)。
· 信号:当价格触及这些区域并出现反转K线结构时,会给出相应的箭头提示。
2. 超级趋势 (SuperTrend)
· 原理:基于ATR(10周期,3倍乘数)的经典趋势跟踪算法。
· 用途:作为主要的趋势过滤器。背景颜色会随趋势变化(绿色为多头趋势,红色为空头趋势),帮助交易者顺势操作。
3. EMA均线系统
· 配置:包含红、黄、白三条均线。
· 用途:用于判断长期趋势方向。当价格位于均线组上方时,主要寻找做多机会;反之则寻找做空机会。
4. 增强型RSI反转信号
· 红色倒三角 (R):RSI下穿超买线(70),提示顶部回归风险。
· 蓝色正三角 (R):RSI上穿超卖线(30),提示底部回归机会。
· 此信号仅作为辅助确认,建议结合支撑阻力位使用。
5. 爆量K线高亮 (Volume Anomalies)
· 原理:当单根K线的成交量大于过去30根K线平均成交量的2.5倍时,系统会将其判定为“爆量”。
· 视觉:K线实体会被染成明黄色,提示主力资金介入或情绪剧烈波动。
6. 多周期趋势面板 (Dashboard)
· 位置:图表右上角。
· 功能:实时监控从15分钟到日线级别的SuperTrend趋势方向以及成交量状态,帮助交易者进行多周期共振分析。
7. 🔔 智能警报过滤器 - 智能识别报警信号推送提醒
· RSI 回归警报
· 顶底区间警报
· 爆量警报
· 趋势改变警报
· EMA 远离警报
信号提醒设置:选择函数 - 选择webhook - 可通过苹果bark软件 实时手机提醒
【使用策略建议】
· 顺势交易:主要依据SuperTrend背景色和EMA均线方向操作。
· 反转交易:关注价格进入紫色/绿色区间,且同时出现RSI三角形信号或爆量黄色K线时的反转机会。
· 止损设置:建议设置在支撑阻力区间的边缘外侧。
免责声明:本脚本仅用于技术交流和辅助分析,不构成任何投资建议。市场有风险,交易需谨慎。
Overview
This indicator is a comprehensive "All-in-One" trading system designed to assist traders in making high-probability decisions by combining Trend Following, Momentum Reversal, Dynamic Support & Resistance, and Volume Analysis. It integrates multiple analysis modules into a clean chart interface, suitable for both intraday scalping and swing trading.
Core Features & Logic
1. Dynamic Support & Resistance Zones
· Logic: Automatically detects dynamic tops and bottoms based on Pivot High/Low lookback combined with ATR volatility.
· Visuals: Purple zones indicate Resistance (potential sell zones), and Green zones indicate Support (potential buy zones).
· Signals: Arrows appear when price touches these zones and shows a reversal structure.
2. Enhanced SuperTrend
· Logic: Uses a classic ATR-based trend following algorithm to filter market noise.
· Usage: Acts as the primary trend filter. The background color changes with the trend (Green for Bullish, Red for Bearish) to help traders stay on the right side of the market.
3. EMA System
· Configuration: Includes three specific EMA lines configured to identify medium to long-term trends.
· Usage: Used to determine the broader market direction. Look for long setups when price is above the EMAs, and short setups when below.
4. Enhanced RSI Reversal Signals
· Red Triangle (R): RSI crosses under the Overbought threshold, suggesting a risk of a top/pullback.
· Blue Triangle (R): RSI crosses over the Oversold threshold, suggesting a potential bottom/bounce.
· Note: These signals are best used as confirmation near Support & Resistance zones.
5. Volume Anomalies (High Vol Highlight)
· Logic: Identifies "Explosive Volume" when the current candle's volume is significantly higher than the average volume.
· Visuals: The candle body is highlighted in bright Yellow, indicating institutional activity or extreme emotional volatility.
6. Multi-Timeframe Dashboard
· Location: Top right corner of the chart.
· Function: Real-time monitoring of SuperTrend direction and Volume status across multiple timeframes, facilitating multi-timeframe confluence analysis.
7. 🔔 Smart Alerts System
Includes fully customizable alert conditions compatible with webhooks (e.g., Bark, Telegram):
· RSI Mean Reversion Alerts
· Support/Resistance Bounce Alerts
· Explosive Volume Alerts
· Trend Change Alerts
· EMA Pullback/Leaving Alerts
Strategy Recommendations
· Trend Trading: Follow the SuperTrend background color and EMA direction.
· Reversal Trading: Look for entries when price hits a Purple/Green zone AND triggers an RSI Triangle or High Volume candle.
· Stop Loss: Recommended to be placed just outside the edges of the S&R zones.
Disclaimer: This script is for educational and technical exchange purposes only and does not constitute investment advice. Trading involves risk.

Physics Visualizer [RSI + Vol] bars ( educational Purpose only )This code is a TradingView Pine Script (Version 6) for a custom indicator named "Physics Visualizer ".
Here is a breakdown of what it does:
1. What It Is: It is a visual tool designed to show you the relationship between Price Momentum (RSI) and Volume (Fuel) in a single, easy-to-read panel. It tries to answer the question: "Is this price move supported by real volume, or is it fake?"
2. How It Works (The "Physics"): It calculates the "Slope" (direction) of both the RSI and Volume over a short period (3 bars).
Explosion (Lime Green): RSI is going UP + Volume is going UP. This is a strong, healthy move.
Fakeout (Orange): RSI is going UP (Price rising) + Volume is going DOWN. This warns of a weak move that might reverse.
Churn (Maroon): RSI is going DOWN (Price falling) + Volume is going UP. This suggests heavy selling or absorption (fighting).
3. Visuals: It draws a "Bar in Bar" chart:
Background (Gray Bar): Represents the Volume (scaled 0-100). Wide and transparent.
Foreground (Colored Stick): Represents the RSI (Momentum). Thin and colored based on the "Physics State" (Green/Orange/Maroon).
Can we use it as a confirmation? Yes. This is an excellent confirmation tool.
Rule: Only take a Buy signal from your main strategy if this indicator shows a Lime Green (Explosion) bar,

BTC Key Support Levels (True Market Mean, Realized Price, MVRV)Bitcoin Key Onchain Support Levels + Moving Averages
This indicator combines critical Bitcoin on-chain metrics with traditional technical analysis to identify key support levels and price trends. It's designed to help traders and investors understand Bitcoin's fundamental value zones and market positioning.
Key Metrics Included:
On-Chain Support Levels:
True Market Mean (Active Coins) - Blue Line
Calculates investor capital (Realized Cap minus Thermocap) divided by active supply (coins moved in last year)
Represents the average cost basis of active market participants
Historically acts as strong support during bull markets
True Market Mean (Free Float) - Green Line
Same investor capital calculation but divided by free float supply
Provides a more conservative support estimate
Useful for identifying extreme value zones
Realized Price - Purple Line
The average price at which all bitcoins last moved on-chain
Represents the aggregate cost basis of all Bitcoin holders
Historical major support level during bear markets
Delta Realized Price - Red Line
Realized Price minus its all-time average
Helps identify when Bitcoin is trading below or above its historical average cost basis
Useful for spotting macro trend shifts
MVRV 0sd (Mean MVRV) - Yellow Line
Price level where Market Value equals the historical average MVRV ratio times Realized Value
Represents "fair value" based on Bitcoin's historical valuation patterns
Strong dynamic support/resistance level
Traditional Moving Averages:
50 Day SMA - White Dotted Line
Short-term trend indicator
Common entry/exit signal for swing traders
200 Day SMA - White Dashed Line
Long-term trend indicator
Classic bull/bear market dividing line
50 Week SMA - Orange Dotted Line
Medium-term trend on weekly timeframe
Historically strong support in bull markets, some traders use as dividing line between bull and bear markets
200 Week SMA - Orange Dashed Line
Long-term weekly trend
Very rarely breached; considered ultimate bottom indicator representing the deepest possible value for long term investors
How to Use This Indicator:
For Long-Term Investors:
Look for price approaching the Red (Delta Realized Price) or Purple (Realized Price) lines during corrections as potential accumulation zones
The 200 Week SMA (orange dashed) has historically marked cycle bottoms
When price is above the Blue line (True Market Mean - Active), the bull market is typically healthy
For Traders:
Use the moving averages for trend confirmation and entry/exit signals
The Yellow line (MVRV 0sd) often acts as dynamic support/resistance
Watch for price interactions with the Blue line during consolidations
Cross-referencing on-chain levels with moving averages provides high-probability trade setups
Market Cycle Context:
Bull Market: Price typically stays above the Yellow and Blue lines
Bear Market: Price often trades between Purple (Realized Price) and Red (Delta Realized Price)
Extreme Value: Price near or below Red line and 200 Week SMA
Overheated: Price significantly above all on-chain metrics
Technical Notes:
This indicator uses real Bitcoin on-chain data including:
Realized Cap from CoinMetrics
Supply and active supply metrics from Glassnode
Block mining data and transaction fees
Thermocap calculation (cumulative security spend)
All calculations are performed on daily data and maintain consistency across different chart timeframes. The on-chain metrics provide fundamental value floors that complement traditional technical analysis.
Best Practices:
Use on logarithmic scale for better visualization across Bitcoin's entire price history
Most effective on daily, weekly, and monthly timeframes
Combine with volume analysis and other indicators for confirmation
On-chain levels are slow-moving; don't expect daily precision
Historical support levels are not guarantees of future performance

The Map - RMAConcept This indicator is designed to be the ultimate "Map" for intraday traders. Instead of guessing where support and resistance are, it automatically projects Higher Timeframe (HTF) Market Structure onto your chart and combines it with Institutional Volume Analysis. It answers two critical questions instantly: "Where are we?" (Premium vs. Discount) and "Who is trading?" (Whales vs. Retail).
Key Features
Dynamic Market Structure (The Map):
Automatically fetches the Highest High and Lowest Low from a higher timeframe (Default: 4-Hour) over a user-defined lookback period.
Premium Zone (Red): The upper 50% of the range. Ideally used for looking for Short/Sell setups.
Discount Zone (Green): The lower 50% of the range. Ideally used for looking for Long/Buy setups.
Equilibrium (Gray): The 50% midpoint. A key target for mean reversion strategies.
Whale Volume Detection (The Fuel):
Identifies "Whale Candles" where the current volume significantly exceeds the average (e.g., 2x the 20-period average).
Plots visual Bubbles (Green for Up-close, Red for Down-close) to highlight where big money is entering the market.
Filters out noise by only showing bubbles on candles with significant price movement.
Live Dashboard:
A clean table in the top-right corner displays the current Zone status (Premium vs. Discount) and Volume status in real-time.
How to Use
Trend Following: If price breaks out of the H4 High with a Green Whale Bubble, it indicates strong bullish momentum.
Reversal Trading: If price enters the Red (Premium) Zone and prints a Red Whale Bubble (rejection), it suggests institutional selling pressure at resistance.
Confluence: This tool is best used as a "Context Filter" alongside your favorite entry trigger (like a London Breakout or MACD crossover).
Settings
Structure Timeframe: Choose the HTF for your map (Default: 240/4-Hour).
Lookback: How many bars to scan for Highs/Lows (Default: 20).
Whale Multiplier: How much larger than average volume must be to trigger a bubble (Default: 2.0x).
Visuals: Toggle the Zones map on/off to fix chart scaling if needed.
Disclaimer This indicator is for educational and analytical purposes only. Past performance (structure levels) does not guarantee future price action. Always manage your risk.

SPY Daily Gamma Levels [Manual Input With Alerts]Overview This indicator plots key options-based support and resistance levels (Gamma Exposure / GEX) directly on your chart. Unlike standard technical analysis, these levels (Call Wall, Gamma Flip, Put Support, and Volatility Trigger) represent where Market Makers are positioned, often acting as "magnets" or "repellents" for price action.
Important Note: TradingView Pine Script cannot currently access external options open interest data natively. Therefore, this is a Manual Input Indicator. You must update the four price levels in the settings each morning before the market opens.
Key Features:
4 Key Levels: Plots the Call Wall, Gamma Flip (Zero Gamma), Put Support, and Volatility Trigger.
Auto-Cleaning: Automatically deletes yesterday's lines to keep your chart clean; lines only show for the current session.
Alerts Included: Built-in alert conditions allow you to set notifications when price crosses the Gamma Flip or breaks the Vol Trigger.
Customization: Fully customizable colors and line styles.
Best Practices:
Timeframe: Works best on 15-minute charts for trend identification and 5-minute charts for entry execution.
Strategy:
Above Gamma Flip: Market generally stabilizes; dealers buy dips.
Below Gamma Flip: Volatility expands; dealers sell rips.
Below Vol Trigger: "Danger Zone" – expect accelerated selling pressure.
How to Get the Data (The AI Workflow)
Since these numbers change daily, I use Google Gemini to fetch the data and remind me every morning. Here is how you can set up the same automated workflow:
1. The Prompt You can ask Gemini (or your preferred AI) the following prompt manually each morning:
"Find the daily SPY Call Wall, Gamma Flip, Put Support, and Vol Trigger levels for today to input into my TradingView indicator."
2. Automating the Routine I have set up a scheduled daily reminder with Gemini. To do this yourself, simply ask Gemini:
"Can you schedule a daily task to search for these SPY Gamma levels and send them to me every morning at 8:00 AM?"
3. Updating the Chart
Receive the notification from the AI.
Open the Indicator Settings in TradingView.
Type in the new numbers.
The chart updates instantly.
Disclaimer: This tool is for educational purposes only. Gamma levels are estimates based on Open Interest and Dealer Gamma exposure models. Always manage your risk.

Daily RDR (Prev Day H/L, Intraday)This indicator identifies intraday Range-Deviation Reversal (RDR) signals using the previous day’s high and low. At each new session, it stores yesterday’s levels and resets today’s range tracking. During the day, it detects when price first breaks above the prior high or below the prior low, then waits for a reversal: a bearish RDR triggers when price exceeds yesterday’s high and then closes back below it, while a bullish RDR triggers when price undercuts yesterday’s low and then closes back above it. The script plots the previous day’s levels and marks RDR reversals with small up/down triangles.

Dynamic Support and Resistance with Trend LinesDynamic Support and Resistance with Trend Lines (DSRTL)
1. Introduction & Methodology
The DSRTL indicator is designed to provide a multidimensional analysis of market structure. Unlike traditional tools that rely solely on price pivots, this script combines Static Volume-based Zones with Dynamic Trend Lines to evaluate the price's position relative to critical market components.
The S/R Identification Technique
Instead of standard pivot points, DSRTL utilizes Volume Analysis to highlight areas of significant trader participation:
- Strategy A:
Matrix Climax: Identifies candles within the lookback period that are near price extremes (Highs/Lows) and coincide with significant buying or selling volume.
- Strategy B:
Volume Extremes: Detects candles with the absolute highest buy/sell volumes within the selected lookback window, creating extreme volume-based S/R zones.
- Result:
This creates Support/Resistance (S/R) zones that are validated by actual market activity, not just price geometry.
Dynamic Trend Lines
To complement the static zones, the indicator employs two adaptive channel methods:
- Pivot Span: Connects recent significant pivots for a fast, reactive trend corridor.
- 5-Point Channel: Segments the lookback period into 5 parts to perform a linear regression analysis, creating a stable and statistically significant channel.
2. Volume Calculation Methodology
Accurate S/R detection requires distinguishing Buy Volume from Sell Volume. DSRTL offers two calculation modes:
- Geometry (Source File): Estimates buy/sell volume based on the Close price's position relative to the High/Low of the candle.
Note: This is an approximation that works on all plan types as it does not require intrabar data.
- Intrabar (Precise): Analyzes historical lower-timeframe data (e.g., 15S) to calculate intrabar-based volume deltas with higher precision compared to the geometric method.
Note: This offers superior accuracy. It requires access to historical intrabar data (depending on your plan limits). For the best analytical results, use this mode if available.
3. The Smart Matrix Engine (3D Analysis)
The core of DSRTL is its dashboard, powered by the "Smart Matrix Engine." This engine evaluates the current price in a multi-layer market structure context (Static Volume Zones + Dynamic Channels + Volume Metrics).:
A. S-State (Static): Where is the price relative to the Volume S/R zones?
B. D-State (Dynamic): Where is the price relative to the Trend Channels?
How to read the Matrix Map:
The dashboard displays a 5x5 grid representing 25 possible market scenarios.
- Rows (S1-S5): Represent the Static State (S1=Breakout, S3=Mid-Range, S5=Breakdown).
- Columns (D1-D5): Represent the Dynamic State (D1=Overextended Up, D3=Neutral, D5=Overextended Down).
- Active Cell: Marked with a dot, indicating the specific intersection of price action and market structure.
4. Matrix Interpretations (The 25 Scenarios)
Below is the detailed logic for every possible state displayed on the dashboard, explaining the Title, Bias, and actionable Signal.
Section I: S1 - Static Breakout (Price > Static Resistance)
The price has cleared the static volume resistance zone.
- S1 / D1: HYPER EXTENSION
Bias: Extreme Bullish
Signal: Caution: Exhaustion Risk. Trail stops tight.
- S1 / D2: RESISTANCE CLASH
Bias: Bullish
Signal: Breakout confirmed but facing immediate dynamic resistance.
- S1 / D3: CHANNEL BREAKOUT
Bias: Strong Bullish
Signal: Ideal Trend Continuation. Look to buy dips.
- S1 / D4: SMART PULLBACK
Bias: Bullish (Pullback)
Signal: A pullback occurring after a breakout. Strong buy opportunity.
- S1 / D5: CONFLICT (DIV)
Bias: Conflict/Reversal
Signal: Major Divergence. Static breakout is failing against dynamic structure. High Risk.
Section II: S2 - Inside Static Resistance
The price is currently testing the overhead resistance zone.
- S2 / D1: WEAK SPIKE
Bias: Neutral/Bullish
Signal: Testing resistance, but short-term overextended.
- S2 / D2: IRON FORTRESS (R)
Bias: Rejection Risk
Signal: Double Resistance (Static + Dynamic). High probability of rejection.
- S2 / D3: TESTING RES
Bias: Neutral
Signal: Consolidating at resistance. Wait for a clear break or rejection.
- S2 / D4: COMPRESSION (UP)
Bias: Conflict (Squeeze)
Signal: Squeezed between Static Resistance and Dynamic Support. Volatility imminent.
- S2 / D5: RES vs DOWN-TREND
Bias: Bearish
Signal: Strong downtrend meeting static resistance. Potential Short entry.
Section III: S3 - Mid-Range
The price is floating between significant Static Support and Resistance.
- S3 / D1: OVERBOUGHT RANGE
Bias: Rejection Risk (OB)
Signal: Overextended within the range. Potential fade (short).
- S3 / D2: RANGE HIGH LIMIT
Bias: Neutral/Bearish
Signal: At the top of the dynamic channel. Look for rejection signs.
- S3 / D3: NEUTRAL / CHOPPY
Bias: Neutral
Signal: Dead Center. Low probability environment. Avoid trading.
- S3 / D4: RANGE DIP BUY
Bias: Neutral/Bullish
Signal: At the bottom of the dynamic channel. Look for bounce signs.
- S3 / D5: WEAK RANGE (OS)
Bias: Bounce Risk (OS)
Signal: Oversold within the range. Potential fade (long).
Section IV: S4 - Inside Static Support
The price is currently testing the floor support zone.
- S4 / D1: SUP vs UP-TREND
Bias: Bullish
Signal: Strong uptrend meeting static support. Potential Long entry.
- S4 / D2: COMPRESSION (DN)
Bias: Conflict (Squeeze)
Signal: Squeezed between Static Support and Dynamic Resistance. Volatility imminent.
- S4 / D3: TESTING SUPPORT
Bias: Neutral
Signal: Consolidating at support. Wait for a bounce or breakdown.
- S4 / D4: IRON FLOOR (S)
Bias: Bounce Risk
Signal: Double Support (Static + Dynamic). High probability of a bounce.
- S4 / D5: WEAK DIP
Bias: Neutral/Bearish
Signal: Testing support, but short-term oversold.
Section V: S5 - Static Breakdown (Price < Static Support)
The price has dropped below the static volume support zone.
- S5 / D1: CONFLICT (DIV)
Bias: Conflict/Reversal
Signal: Major Divergence. Static breakdown is failing. High Risk.
- S5 / D2: BEAR PULLBACK
Bias: Bearish (Pullback)
Signal: A pullback occurring after a breakdown. Strong selling opportunity.
- S5 / D3: CHANNEL BREAKDOWN
Bias: Strong Bearish
Signal: Ideal Trend Continuation (Down). Sell rallies.
- S5 / D4: SUPPORT CLASH
Bias: Bearish
Signal: Breakdown confirmed but facing immediate dynamic support.
- S5 / D5: HYPER DROP (VOID)
Bias: Extreme Bearish
Signal: Caution: Climax risk. Trail stops for shorts.
DISCLAIMER & EDUCATIONAL PURPOSE
This indicator is strictly an educational tool designed to visualize complex market structure concepts. Its primary purpose is to help traders "bridge the gap" between academic theory and real-time market behavior by providing a visual representation of support, resistance, and volume dynamics.
Please Note:
1. Not a Trading Strategy: This script is an analytical assistant, not a standalone "Black Box" trading system. It does not generate buy or sell signals that should be followed blindly.
2. No Financial Advice: The data provided by this tool is for informational purposes only. It is not a recommendation to buy or sell any asset.
3. Risk Warning: Trading involves significant risk. Always use your own judgment, perform your own technical analysis, and use proper risk management. Do not use this tool as the sole basis for your trading decisions.
4. Data Precision & Platform Limits: The "Intrabar (Precise)" calculation mode relies on high-resolution historical data to provide exact results. Access to this specific data depth depends entirely on your platform's subscription capabilities. If your plan does not support this level of historical intrabar data, the Precise mode may have limited coverage. In that case, you should switch to "Geometry" mode for a fully populated view.

[CT] ATR Chart Levels From Open ATR Chart Levels From Open is a volatility mapping tool that projects ATR based price levels directly from a user defined center price, most commonly the current session open, and displays them as clean horizontal levels across your chart. The script pulls an Average True Range from a higher timeframe, by default the daily, using a user selectable moving average type such as SMA, EMA, WMA, RMA or VWMA. That ATR value is then used as the unit of measure for all projected levels. You can choose the ATR length and timeframe so the bands can represent anything from a fast intraday volatility regime to a smoother multi week average range.
The core of the tool is the center line, which is treated as zero ATR. By default this center is the current session open, but you can instead anchor it to the previous close, previous open, previous high or low, or several blended prices such as HLC3, HL2, HLCC4 and OHLC4, including options that use the minimum or maximum of the previous close and current open. From this center, the indicator builds a symmetric grid of ATR based levels above and below the zero line. The grid size input controls the spacing in ATR units, for example a value of 0.25 produces levels at plus or minus 25, 50, 75, 100 percent of ATR and so on, while the number of grids each side determines how far out the bands extend. You can restrict levels to only the upper side, only the lower side, or draw both, which is useful when you want to focus on upside targets or downside expansion separately.
The levels themselves are drawn as horizontal lines on the main price chart, with configurable line style and width. Color handling is flexible. You can assign separate colors to the upper and lower levels, keep the center line in a neutral color, and choose how the colors are applied. The “Cool Towards Center” and “Cool Towards Outermost” modes apply smooth gradients that either intensify toward the middle or toward the outer bands, giving an immediate visual sense of how extended price is relative to its average range. Alternatively, the “Candle’s Close” mode dynamically colors levels based on whether the current close is above or below a given band, which can help highlight zones that are acting as resistance or support in real time.
Each level is optionally labeled at its right endpoint so you always know exactly what you are looking at. The center line label shows “Daily Open”, or more generally the chosen center, along with the exact price. All other bands show the percentage of ATR and the corresponding price, for example “+25% ATR 25999.90”. The label offset input lets you push those tags a user defined number of bars to the right of the current price action so the chart remains clean while still keeping the information visible. As new bars print, both the lines and their labels automatically extend and slide to maintain that fixed offset into the future.
To give additional context about current volatility, the script includes an optional table in the upper right corner of the chart. This table shows the latest single period ATR value on the chosen higher timeframe alongside the smoothed ATR used for the bands, clearly labeled with the timeframe and ATR length. When enabled, a highlight color marks the table cells whenever the most recent ATR reading exceeds the average, making it easy to see when the market is operating in an elevated volatility environment compared to its recent history.
In practical trading terms, ATR Chart Levels From Open turns the abstract concept of “average daily range” into specific, actionable intraday structure. The bands can be used to frame opening range breakouts, define realistic intraday profit targets, establish volatility aware stop placement, or identify areas where price has moved an unusually high percentage of its average range and may be vulnerable to mean reversion or responsive flow. Because the ATR is computed on a higher timeframe yet projected on whatever chart you are trading, you can sit on a one minute or five minute chart and still see the full higher timeframe volatility envelope anchored from your chosen center price for the session.

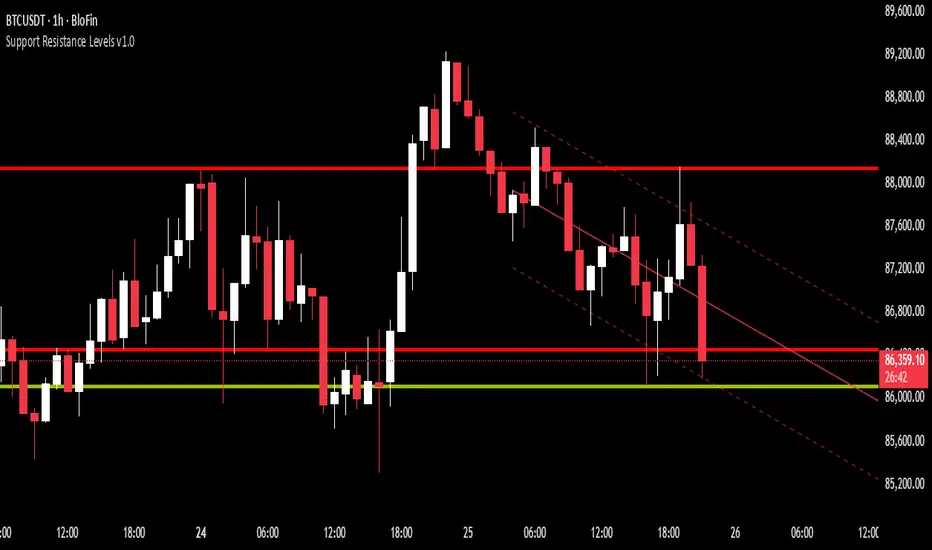
Support Resistance Levels v1.0Support Resistance Levels v2.0 automatically detects the most important price levels on the chart by analyzing market structure, swing points, and repeated reactions.
Instead of manually drawing lines, this tool identifies clusters of highs and lows, measures how often price respected each zone, and highlights strong support or resistance with clear visuals. It also marks tight consolidations and builds a structural regression channel when a trend sequence is confirmed.
The goal is simple: faster chart scanning, cleaner context, and a more objective view of where price is likely to react next.
Cluster Lines
– Horizontal support/resistance levels built from repeated swing reactions. Green when below price, red when above. Thicker lines indicate stronger levels.
Recent HH & LL Lines
– Dashed lines marking the most recent swing high and swing low for quick breakout context.
Consolidation Box
– A blue range box appears when price compresses inside a tight structure and extends until breakout.
Structural Regression Channel
– A trendline with upper and lower bands drawn when a clean trend sequence forms, showing directional bias and reaction zones.
Fibonacci Golden Zone Auto-DrawDisclaimer: This script is for educational purposes only and does not constitute financial advice. Use at your own risk.
Fibonacci Golden Zone Auto Draw is a smart tool that automatically detects the most recent market swing and highlights the high probability reversal area known as the Golden Zone (0.618 to 0.65 retracement).
Key Features
Auto Detection : Instantly finds the active High Low or Low High swing leg using customizable pivot sensitivity.
Golden Zone Visualization : Draws a clean color coded box (green for bullish, red for bearish) exactly where price is likely to reverse.
Dynamic Updates : Adjusts in real time as new pivots form, so your chart always shows the latest relevant levels.
How to Use
Pivot Left Bars : Sets how many bars to the left of a candle must be lower for a high or higher for a low to register as a pivot. Larger values find more significant longer term swings.
Pivot Right Bars : Sets how many bars to the right must confirm the pivot. Lower values detect pivots faster but may be less stable, while higher values wait for stronger confirmation.
Perfect for traders who want to spot retracement entries without manually drawing Fibonacci tools on every setup.

Raja_Intraday: Bull/Bear Logic SetupBased on Candle high low/PDH-PDL break out, in combination with other indicators.
Focus is more on accuracy than on higher frequency of trades. Enjoy!!

Daily AVWAPsDaily AVWAPs is designed for intraday and swing traders who track institutional volume benchmarks. Instead of a single "rolling" line that resets continuously, this indicator identifies the starting timestamp of the last 5 trading sessions and draws five distinct Anchored VWAPs from those exact moments.
This allows traders to see exactly where the average volume-weighted price stands for the current day (1D), yesterday (2D), and the three days prior (3D, 4D, 5D) simultaneously.
Key Features
Polyline Visualization: Unlike standard indicators that plot historical values for every bar (creating a messy "sawtooth" effect), this script uses Pine Script Polylines. It draws clean, static lines starting from the specific anchor point to the present price, mimicking the manual "Anchored VWAP" drawing tool.
Dynamic Session Detection: The script contains zero hardcoded dates. It automatically detects when a new trading day begins based on the chart data. It works seamlessly across all asset classes (Stocks, Crypto, Futures) and automatically adjusts for weekends, holidays, and irregular trading weeks without manual updates.
Unified Color Control: Input colors are synchronized. Changing a color in the settings menu updates both the chart line and the price scale label instantly.
Toggle Controls: Individual checkboxes allow you to toggle any specific VWAP (1D through 5D) on or off to keep your chart clean.
How to Use
Trend Strength: When the 1D, 2D, and 3D VWAPs are "fanning out" in alignment, the trend is strong.
Mean Reversion: In a sideways market, price often gravitates back to the 5-Day VWAP as a "value area."
Support & Resistance: Watch for price to respect the VWAP of a previous high-volume day (e.g., bouncing off the 3D VWAP during a pullback).
Settings
Source: Select the price data source (default is OHLC4) .
Colors & Toggles: Use the checkboxes to enable/disable specific lines. Customize the color for each specific day's AVWAP directly in the Inputs tab.
This indicator was adapted and repurposed from the original work by The_Last_Gentleman .
Technical Note: This indicator is optimized for intraday timeframes (1m, 5m, 15m, 1H). Because it uses polyline and array logic to scan specific session timestamps, it calculates exclusively on the most recent bar to maintain high performance.