Liquidity Sweeps + Swing High/Low — SMC/ICT (@PueblaATH)Liquidity Sweeps + Swing High/Low — SMC/ICT (@PueblaATH) is a liquidity-driven Smart Money Concepts tool that automatically maps out key swing highs and lows, tracks how they evolve into liquidity pools, and highlights when those levels are swept and either respected or invalidated. This indicator is built to give traders a clean, event-driven view of stop runs and liquidity grabs across any timeframe, from scalping to higher-timeframe context.
What the Indicator Does
Swing Structure & Liquidity Pools
Detects swing highs and lows using a configurable swing length, projects levels forward in time, and builds a liquidity-pool database through pivot arrays used for sweep detection.
Liquidity Sweeps (Stop Runs)
Identifies bearish (upward) and bullish (downward) sweeps through prior liquidity levels using three modes: Any Touch, Wick + Close Back, and Retest Rejection.
Each sweep can generate projective lines, labeled markers, and alerts.
Scope, Rate Limiting & Clean Visuals
Controls minimum spacing between swings and sweeps, limits sweep duplication, auto-revokes invalidated sweeps, and restricts the maximum number of visible events.
Smart offset logic reduces label overlap and keeps charts clean even in dense price action.
Timeframe Filters & Utilities
Allows hiding all drawings between specific timeframes and optionally skipping calculations or clearing internal state when hidden.
Includes debug pivot markers and an optional TF/Bucket badge.
Timeframe Auto-Mode (Original Adaptive Engine)
This indicator features a fully original, seven-bucket Auto-Mode engine that adapts sensitivity to the active timeframe.
Bucket Classification (by seconds)
≤1m, >1m–15m, >15m–30m, >30m–1h, >1h–4h, >4h–1d, >1d.
Bucket-Specific Settings
Each bucket has unique sensitivity sets:
Swing/Sweep lengths
Projection distances
Line style and width
Rate-limiting gaps
Pivot count and bar-lookback windows
Overlap windows
Adaptive Behavior
Lower timeframes gain more reactive behavior, while higher timeframes apply smoother and more selective filters.
Manual Override
Auto-Mode can be disabled to use the Core manual settings for full customization.
How to Use It
Attach the indicator and choose whether to keep Auto-Mode ON or OFF.
Select the sweep mode (e.g., Wick + Close Back for ICT-style liquidity grabs).
Adjust label text, size, color, and offsets to your preference.
Use timeframe filters to show drawings only where you want them.
Enable alerts for bullish sweeps, bearish sweeps, or revocations.
Combine sweep events with your own confluence (sessions, bias, OBs/FVGs, etc.).
Originality & Credits Disclaimer
This script is an original work by @PueblaATH , created specifically for Liquidity Sweeps + Swing High/Low — SMC/ICT (@PueblaATH) under the MPL 2.0 license.
The concepts used (swing highs/lows, liquidity pools, sweeps, SMC/ICT behavior) are public and widely known—they do not belong to any author or protected script.
This indicator does not repackage or cosmetically modify existing code.
Its architecture—including the multi-bucket Auto-Mode engine, pivot/sweep management system, revocation logic, overlap-aware labeling, and TF-based hide/skip/clear controls—is uniquely implemented for this script.
If any future update reuses or adapts code from public sources, full credit will be given in both comments and description, with clear explanation of what was reused and what was originally added or improved.
Sweeps

Liquidity Sweeps 2.0 – MGTrading Professional Liquidity Sweep Engine with Volume, MACD, Trend, SMT Divergence & Rolling VWAP
Liquidity Sweeps 2.0 is a **complete precision-based liquidity detection framework** built for traders who follow smart money concepts, sweep-based entries, and algorithmic price behavior.
This tool detects **high-probability buy/sell sweeps**, confirms them with market structure, Volume, MACD engine, Trend filtering, SMT divergence, and overlays a Rolling VWAP to track accumulation & distribution behavior.
It is designed for futures, indices, forex, crypto, and options traders.
-
🔥 **MAIN FEATURES**
✅ **1. True Liquidity Sweep Detection**
Automatically detects when price:
* Sweeps a prior high (Sell Sweep)
* Sweeps a prior low (Buy Sweep)
* Rejects and closes back inside the previous range
This helps identify real **stop hunts**, **liquidity grabs**, and **reversal moments**.
---
✅ **2. Volume Spike Confirmation (Smart Filter) **
Sweeps are only confirmed when volume exceeds the dynamic SMA threshold.
This filters out weak sweeps and keeps only **high-quality liquidity grabs**.
✅ **3. MACD Engine Confirmation**
Advanced MACD rules confirm sweeps by:
* MACD direction
* MACD signal agreement
* MACD histogram alignment
This dramatically increases accuracy and removes fake sweeps that occur in weak trends.
Optional **MACD Divergence Detection** reveals trend exhaustion before major reversals.
✅ **4. EMA Trend Filter (9/21) **
Avoid fighting the trend with the optional trend filter:
* Only buy sweeps in uptrend
* Only sell sweeps in downtrend
Great for scalpers and day traders who want trend alignment.
✅ **5. SMT Divergence (Relative Strength vs Reference Symbol) **
Enable SMT to detect when:
* Your chart sweeps a high/low
* But the reference symbol DOES NOT
This creates **displacement**, a powerful reversal signal used by institutional traders.
The symbol is selectable (ES, NQ, SPY, QQQ, BTC.D, DXY, etc.).
✅ **6. Rolling VWAP (RVWAP)**
A more dynamic version of VWAP using:
* Time-based rolling windows
* Volume-weighted price
* Automatic or adjustable window size
* Color change based on slope
Excellent for tracking **accumulation**, **distribution**, and **algorithmic trend bias**.
✅ **7. Clean Mode**
Only show “confirmed” sweeps with a ✓
Ideal for traders who want a simple and clean chart.
# 📊 **LABELS & COLOR CODING**
* 🟥 **Sweep Sell**
* 🟩 **Sweep Buy**
* 🟧 **MACD Bearish Divergence**
* 🟩 **MACD Bullish Divergence**
* 🟦/🟧 **RVWAP Up/Down Trend**
* “✓” means the sweep passed all confirmations.
# 🎯 **WHO IS THIS FOR?**
✔ Futures Traders (ES, NQ, YM, RTY, CL, GC)
✔ Options Traders (SPX, SPY, QQQ)
✔ Forex Traders
✔ Crypto Traders
✔ Smart Money / ICT Style Traders
✔ Liquidity Sweep Traders
✔ Scalpers, Day Traders, Swing Traders
If you trade **liquidity**, **sweeps**, **SMT**, **divergence**, or **VWAP-based behavior**, this indicator is designed for you.
# 🧠 **HOW TO USE IT**
1. Wait for a sweep label to appear at a liquidity pool.
2. Confirm with volume + MACD + trend (if enabled).
3. Watch RVWAP for bias (accumulation vs distribution).
4. Enter on the imbalance/FVG, retrace, or structure break.
5. Use SMT divergence as a premium confirmation.
This tool does NOT repaint after the bar closes.
Signals only appear when conditions are confirmed.
# 📦 **SETTINGS OVERVIEW**
* Lookback window for sweeps: (7 - 13)
* Volume spike threshold
* MACD lengths & filters
* Trend filter (EMA 9/21)
* SMT reference symbol
* RVWAP window + colors
RVWAP Line Width: (2) & Minimum Window Bars: (5)
* Label placement & visual adjustments
* Clean mode
Everything is fully customizable.
⚠️ **DISCLAIMER**
This indicator is for educational purposes only.
It does not guarantee profits.
Always backtest, practice proper risk management, and trade responsibly.
❤️ **If this helped you, leave a like & comment! **
Your support motivates further updates, improvements, and new tools.

$ - HTF Sweeps & PO3HTF Sweeps & PO3 Indicator
The HTF Sweeps & PO3 indicator is a powerful tool designed for traders to visualise higher timeframe (HTF) candles, identify liquidity sweeps, and track key price levels on a lower timeframe (LTF) chart. Built for TradingView using Pine Script v6, it overlays HTF candle data and highlights significant price movements, such as sweeps of previous highs or lows, to help traders identify potential liquidity sweep and reversal points. The indicator is highly customisable, offering a range of visual and alert options to suit various trading strategies.
Features
Higher Timeframe (HTF) Candle Visualisation:
- Displays up to three user-defined HTF candles (e.g., 15m, 1H, 4H) overlaid on the LTF chart.
- Customisable candle appearance with adjustable size (Tiny to Huge), offset, spacing, and colours for bullish/bearish candles and wicks.
- Option to show timeframe labels above or below HTF candles with configurable size and position.
Liquidity Sweep Detection:
- Identifies bullish and bearish sweeps when price moves beyond the high or low of a previous HTF candle and meets specific conditions.
- Displays sweeps on both LTF and HTF with customisable line styles (Solid, Dashed, Dotted), widths, and colours.
- Option to show only the most recent sweep per candle to reduce chart clutter.
Invalidated Sweep Tracking:
- Detects and visualises invalidated sweeps (when price moves past a sweep level in the opposite direction).
- Configurable display for invalidated sweeps on LTF and HTF with distinct line styles and colours.
Previous High/Low Lines:
- Plots horizontal lines at the high and low of the previous HTF candle, extending on both LTF and HTF.
- Customisable line style, width, and color for easy identification of key levels.
- Real-Time Sweep Detection:
-Optional real-time sweep visualisation for active candles, enabling traders to monitor developing price action.
Alert System:
- Triggers alerts for sweep formation (when a new sweep is detected).
- Triggers alerts for sweep invalidation (when a sweep is no longer valid).
- Alerts include details such as timeframe, ticker, and price level for precise notifications.
Performance Optimisation:
- Efficiently manages resources with configurable limits for lines, labels, boxes, and bars (up to 500 each).
- Cleans up outdated visual elements to maintain chart clarity.
Flexible Configuration:
- Supports multiple timeframes for HTF candles with user-defined settings for visibility and number of candles displayed (1–60).
- Toggle visibility for HTF candles, sweeps, invalidated sweeps, and high/low lines independently for LTF and HTF.
This indicator is ideal for traders focusing on liquidity hunting, order block analysis, or price action strategies, providing clear visual cues and alerts to enhance decision-making.

Clean Pivot Lines with AlertsTechnical Overview
This Script is designed for detecting untouched pivot highs and lows. It draws horizontal levels only when those pivots remain unviolated within a configurable lookback window and removes them automatically upon price breaches or sweeps.
Key components include:
Pivot detection logic : Utilizes ta.pivothigh()/ta.pivotlow() (or equivalent via request.security for HTF) with parameterized pivotLength to ensure flexibility and adaptability to different timeframes.
Cleanliness filtering : Checks lookbackBars prior to line creation to skip levels already violated, ensuring only uncontaminated pivots are used.
Dynamic level tracking : Stores active levels in arrays (highLines, lowLines) for continuous real-time monitoring.
Violation logic : Detects both close-based breaks (breakAbove/breakBelow) and wick-based sweeps (sweepAbove/sweepBelow), triggering alerts and automatic teardown.
Periodic housekeeping : Every N (10) confirmed bars, re-verifies “clean” status and removes silently invalidated levels—maintaining chart hygiene and avoiding stale overlays.
Customization options : Supports pivot timeframe override, colors, line width/style, lookback length, and alert toggling.
Utility
This overlay script provides a disciplined workflow for drawing meaningful support/resistance levels, filtering out contaminated pivot points, and signaling validations (breaks/sweeps) with alerts. Its modular design and HTF support facilitate integration into systematic workflows, offering far more utility than mere static pivot plots.
Usage Instructions
1. Adjust `pivot_timeframe`, `pivot_length`, and `lookback_bars` to suit your strategy timeframe and volatility structure.
2. Customize visual parameters as required.
3. Enable alerts to receive in-platform messages upon pivot violations.
4. Use HTF override only if analyzing multi-timeframe pivot behavior; otherwise, leave empty to default to chart timeframe.
Performance & Limitations
- Pivot lines confirmation lags by `pivot_length` bars; real-time signals may be delayed.
- Excessive active lines may impact performance on low-TF charts.
- The “clean” logic is contingent on the `lookback_bars` parameter; choose sufficiently high values to avoid false cleanliness.
- Alerts distinguish between closes beyond and wick-only breaches to aid strategic nuance.

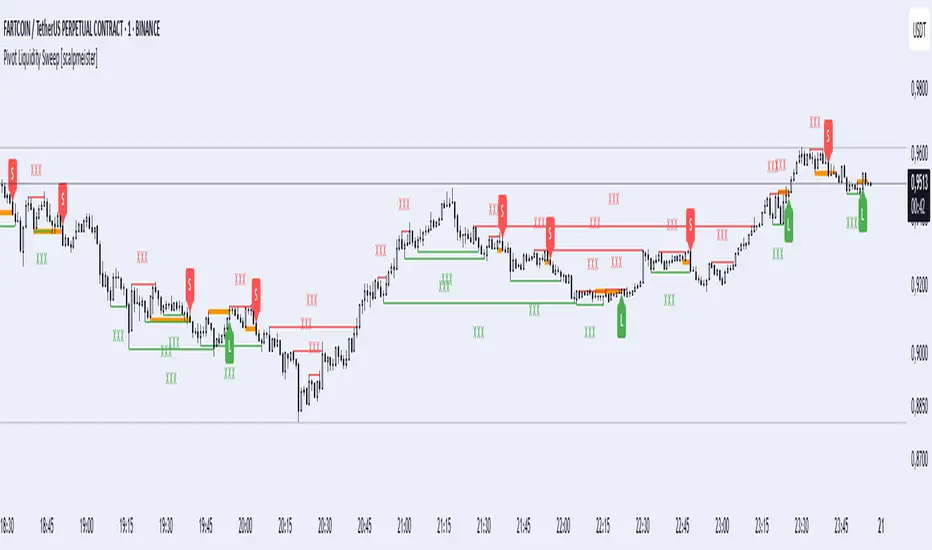
Pivot Liquidity Sweep [scalpmeister]📌 Pivot Liquidity Sweep
Scalp-oriented, liquidity sweep-based advanced signal and strategy indicator.
This indicator analyzes the price's sweeping of significant pivot levels and the subsequent breakouts to generate long/short signals based on different logics. It is sensitive to both classic sweep logic and strong reversal candles. Additionally, it visually marks liquidity gathering zones, offering excellent opportunities especially for scalp and intraday traders.
⚙️ Features and Strategy Types
🟢 Automatic Pivot Detection:
Pivot high/low levels are detected and stored based on the number of left and right bars.
🔴 Sweep Detection (Stop Hunt):
If the price violates a pivot level with a wick and closes inside, it is considered a sweep (liquidity cleaning). Strategies activate after this sweep.
🧠 5 Different Signal Styles:
SweepBreak:
It is expected that the extreme (high/low) level of the sweeping candle is broken with a close.
PivotBreak:
After the sweep, the first newly formed pivot in the trend direction is expected to break. (It is dynamically determined and drawn on the chart.)
StrongSweep:
It is sufficient if the candle following the sweep surpasses the previous candle with a single candle. No additional breakout is expected.
StrongCandle:
Strong momentum candles measured with a special RSI calculation are taken into account. It considers strong opposite-direction candles formed shortly after a pivot sweep.
ReversalCandleSweep:
Reversal candles that close in the opposite direction after a sweep (e.g., a red close on a sweep candle formed at the top or a green close at the bottom) are directly considered as signals.
📐 Technical Details:
Signals are triggered only once (triggered control).
Sweep lines (green/red), Long and Short lines (Orange)
Strong candles are filtered using an RSI-momentum-based measurement system (StrongCandle).
Sweep and breakout zones are dynamically invalidated. That is, if the zones are violated by the price, the signals and lines are automatically canceled.
🎯 Who Should Use It?
Professional traders working with liquidity zones
Scalp and intraday strategy practitioners
Those focused on stop hunts, sweeps, and reversal zones
🔔 Alert Support:
Sweep High / Low Alert
Long / Short Signal Alert
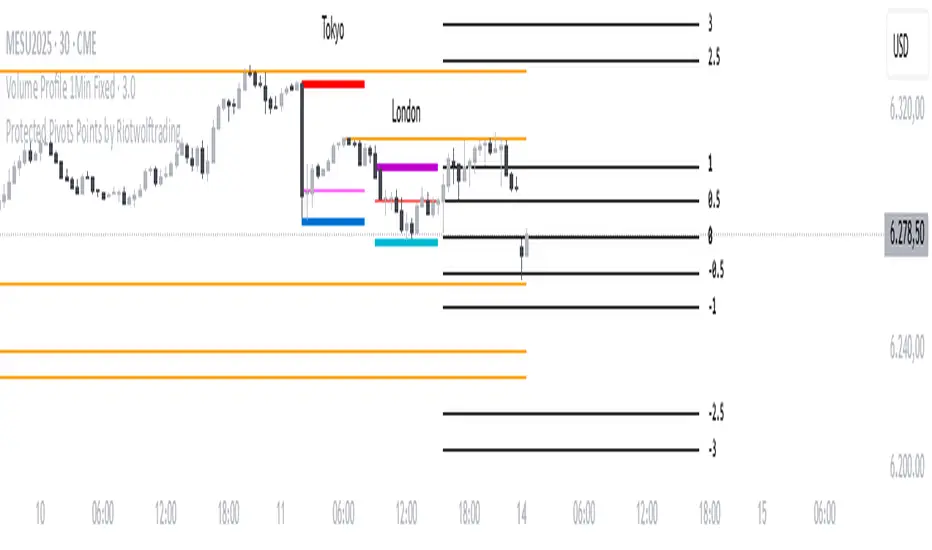
Protected Pivots Points by RiotwolftradingProtected Pivots Points by Riotwolftrading
---
You have an advanced visual tool designed for traders who want to identify and manage key price levels with maximum precision.
This script detects protected pivots (significant highs and lows) and marks them with horizontal lines on the chart. These lines automatically extend for a fixed number of bars or until price invalidates the level with a closing break.
---
🚀 What makes this indicator special?
---
✅ Protected pivot detection:
The indicator identifies protected highs and lows using a fixed pivot strength
✅ Wick break detection (liquidity sweep visualization):
When a wick crosses the pivot level **without the candle closing beyond the level, the indicator automatically changes the line’s color and style.
👉 This immediately shows the trader that the level was tested but remains structurally valid.
✅ Highly customizable visuals:
* Choose whether to show color for protected highs, lows, or wick break levels.
* Set your own colors, line styles (solid, dashed, dotted), and line widths.
---
### 🌟 Why is wick break detection so valuable?
---
💡 Instant context on price action:
No need to manually check every candle to see if a level was barely tested. The indicator changes the line’s appearance automatically, so you can focus on decisions.
💡 Clear distinction between untouched levels and tested levels:
* A level with no wick test is pristine support/resistance.
* A level tested by a wick but not invalidated is still valid — but may have been swept for liquidity.
💡 Crucial for precision trading strategies:
This is particularly important for strategies that rely on:
✅ Liquidity sweeps / stop hunts.
✅ Reversals from tested zones.
✅ Smart Money Concepts (SMC).
✅ ICT concepts, breakers, Quasimodo, BOS/MSS.
The wick break visualization helps filter false breakouts and highlights areas where institutional players may have stepped in.
💡 Avoid premature exits or entries:**
The color/style change tells you a level was tested but not broken, so you avoid overreacting to wick activity.
---
### ⚡ Example use case**
Imagine a protected low line:
🔹 Price dips and its wick touches the level — the line changes color (e.g. violet solid line).
🔹 The level is still valid because the close didn’t break it.
🔹 This could signal a stop hunt or liquidity grab, with a possible reversal opportunity right at that level.
---
### 🧭 **Why most pivot indicators don’t offer this**
Most pivot indicators:
❌ Simply mark the level and remove it after a close break.
❌ Don’t distinguish between a wick test and a true break.
🌟 **This indicator does — giving traders an extra layer of market insight.**
---
### ⚠ **Disclaimer**
This indicator is a visual aid to help identify key levels and price reactions. It does **not** generate buy or sell signals and should be used alongside your trading analysis and strategy.
---
Liquidity Sweep Candlestick Pattern with MA Filter📌 Liquidity Sweep Candlestick Pattern with MA Filter
This custom indicator detects liquidity sweep candlestick patterns—price action events where the market briefly breaks a previous candle’s high or low to trap traders—paired with optional filters such as moving averages, color change candles, and strictness rules for better signal accuracy.
🔍 What is a Liquidity Sweep?
A liquidity sweep occurs when the price briefly breaks the high or low of a previous candle and then reverses direction. These events often occur around key support/resistance zones and are used by institutional traders to trap retail positions before moving the price in the intended direction.
🟢 Bullish Liquidity Sweep Criteria
The current candle is bullish (closes above its open).
The low of the current candle breaks the low of the previous candle.
The candle closes above the previous candle’s open.
Optionally, in Strict mode, it must also close above the previous candle’s high.
Optionally, it can be filtered to only show if the candle changed color from the previous one (e.g., red to green).
Can be filtered to only show when the price is above or below a moving average (if MA filter is enabled).
🔴 Bearish Liquidity Sweep Criteria
The current candle is bearish (closes below its open).
The high of the current candle breaks the high of the previous candle.
The candle closes below the previous candle’s open.
Optionally, in Strict mode, it must also close below the previous candle’s low.
Optionally, it can be filtered to only show if the candle changed color from the previous one (e.g., green to red).
Can be filtered to only show when the price is above or below a moving average (if MA filter is enabled).
⚙️ Features & Customization
✅ Signal Strictness
Choose between:
Less Strict (default): Basic wick break and close conditions.
Strict: Must close beyond the wick of the previous candle.
✅ Color Change Candles Only
Enable this to only show patterns when the candle color changes (e.g., from red to green or green to red). Helps filter fake-outs.
✅ Moving Average Filter (optional)
Supports several types of MAs: SMA, EMA, WMA, VWMA, RMA, HMA
Choose whether signals should only appear above or below the selected moving average.
✅ Custom Visuals
Show short (BS) or full (Bull Sweep / Bear Sweep) labels
Plot triangles or arrows to represent bullish and bearish sweeps
Customize label and shape colors
Optionally show/hide the moving average line
✅ Alerts
Includes alert options for:
Bullish sweep
Bearish sweep
Any sweep
📈 How to Use
Add the indicator to your chart.
Configure the strictness, color change, or MA filters based on your strategy.
Observe signals where price is likely to reverse after taking out liquidity.
Use with key support/resistance levels, order blocks, or volume zones for confluence.
⚠️ Note
This tool is for educational and strategy-building purposes. Always confirm signals with other indicators, context, and sound risk management.

Apex Edge - Session Sweep ProApex Edge Session Sweep Pro
By Apex Edge | 2025 Edition
🔍 What is it?
The Apex Session Sweep Pro is a precision trading tool designed for identifying high-probability liquidity sweep entries during key global market sessions. It combines powerful sweep detection logic with dynamic candle colouring, session visualization, TP projections, and real-time alerts — all within a clean, performance-optimized Pine Script engine.
This is not your average session box indicator. This is Apex-grade.
⚙️ How it Works
The indicator detects session liquidity sweeps by tracking price action relative to previous session highs and lows. When a session high/low is swept (i.e., price breaches it and then closes in the opposite direction), it generates a signal:
Buy Signal → Price sweeps previous low and closes back above it
Sell Signal → Price sweeps previous high and closes back below it
Each session is boxed on the chart (Tokyo, London, New York, Sydney), color-coded, and dynamically labelled.
Upon detecting a valid sweep, the script:
Plots a small entry label (toggleable)
Projects up to 5 customizable TP levels
Coloured candles for visual trade direction
Alerts for Buy or Sell sweep signals (optional)
All elements are memory-managed and customizable to suit your trading style.
🧠 Key Features
✅ Smart Sweep Detection Logic
✅ Global Market Session Boxes (Custom Times)
✅ Toggleable Entry Labels + TP Levels
✅ Candle Colouring by Signal
✅ Manual TP input + TP toggles
✅ Real-time Alerts for Apex entries
🕒 Why Are My Sessions Offset?
Your chart’s time zone may be different from UTC. This script is UTC-based by design, so if your chart is set to UTC+1, for example, the sessions will appear one hour later. Either:
Adjust your chart to UTC or or Exchange for perfect alignment,
Or tweak the session input times manually.
🧰 Who is this for?
This tool is made for:
Intraday traders looking for sweeps into liquidity
SMC (Smart Money Concept) strategists
Forex, crypto, and indices traders
Anyone who uses session-based levels to define entries
Whether you scalp London or ride NY swings, this tool frames each session cleanly — and shows you where the traps are laid.
🚨 Disclaimer
This indicator is a technical tool, not financial advice. Use proper risk management. Past performance ≠ future results.

Pure Price Action Liquidity Sweeps [LuxAlgo]The Pure Price Action Liquidity Sweeps indicator is a pure price action adaptation of our previously published and highly popular Liquidity-Sweeps script.
Similar to its earlier version, this indicator detects the presence of liquidity sweeps on the user's chart, while also identifying potential areas of support/resistance or entry when liquidity levels are taken. The key difference, however, is that this price action version relies solely on price patterns, eliminating the need for numerical swing length settings.
🔶 USAGE
A Liquidity Sweep occurs when the price breaks through a liquidity level , after which the price returns below/above the liquidity level , forming a wick.
The examples below show a bullish and bearish scenario of "a wick passing through a liquidity level where the price quickly comes back".
Short-term liquidity sweep detection is based on short-term swing levels. Some of these short-term levels, depending on further market developments, may evolve into intermediate-term levels and, in the long run, become long-term levels. Therefore, enabling short-term detection with the script means showing all levels, including minor and temporal ones. Depending on the trader's style, some of these levels may be considered noise. Enabling intermediate and long-term levels can help filter out this noise and provide more significant levels for trading decisions. For further details on how swing levels are identified please refer to the details section.
The Intermediate-term option selection for the same chart as above, filters out minor or noisy levels, providing clearer and more significant levels for traders to observe.
🔶 DETAILS
The swing points detection feature relies exclusively on price action, eliminating the need for numerical user-defined settings.
The first step involves detecting short-term swing points, where a short-term swing high (STH) is identified as a price peak surrounded by lower highs on both sides. Similarly, a short-term swing low is recognized as a price trough surrounded by higher lows on both sides.
Intermediate-term swing and long-term swing points are detected using the same approach but with a slight modification. Instead of directly analyzing price candles, we now utilize the previously detected short-term swing points. For intermediate-term swing points, we rely on short-term swing points, while for long-term swing points, we use the intermediate-term ones.
🔶 SETTINGS
Detection: Period options of the detected swing points.
🔶 RELATED SCRIPTS
Pure-Price-Action-Structures.
Liquidity-Sweeps.

ICT Setup 01 [TradingFinder] FVG + Liquidity Sweeps/Hunt Alerts🔵 Introduction
The ICT (Inner Circle Trader) style of trading involves analyzing the behavior of market participants and market makers to identify areas where fake buy and sell activities occur. This trading style helps retail traders align with market maker behavior and avoid falling into market traps.
A key aspect of the ICT strategy is focusing on liquidity hunts. This involves searching for trading opportunities in areas of the market with low liquidity or where other traders have little activity. The ICT method leverages market inefficiencies and weaknesses, allowing traders to profit from small price movements that might go unnoticed by others.
In "ICT Setup 01," our focus is on these liquidity areas and stop hunts that form in Fair Value Gaps (FVGs). Trading within FVGs, combined with confirmations from "Hunts" and "Sweeps," can enhance trader performance.
🔵 How to Use
The presence of Fair Value Gaps (FVGs) in the market indicates rapid, powerful movements likely caused by the influx of smart money. When the price returns to these levels, a market reaction is expected.
Combining this with the complex and deceptive behavior of smart money—such as "Liquidity Sweeps" and "Stop Hunts"—forms an ICT-based price action setup that we expect to perform well.
Components of "ICT Setup 01" :
● Fair Value Gap (FVG)
● Premium and Discount
● Hunts / Sweeps
Whenever the price returns to an FVG area and reacts in such a way that only the wicks of the candles remain in the area and the candle bodies are outside the FVG, the first condition for creating the setup is met.
If subsequent candles hunt the wick that has penetrated the deepest into the FVG, a buy or sell signal is issued. In the format where hunting is based on Sweeps, penetrations that extend even outside the area are considered signals, provided they do not form a body within the area.
Additionally, a refining system exists for cases where a candle body forms in the area, optimizing the proximal levels of the FVG.
Bullish Setup :
Bearish Setup :
🔵 Features and Settings of "ICT Setup 01"
You can Find out more in Setting :
● FVG Detector Multiplier Factor
● FVG Validity Period
● Level in Low-Risk Zone
● Issuing Signals Method
● Number of Signals Allowed from a Zone
● Signal after Hunts/Sweeps
● How Many Hunts/Sweeps
● Show or Hide
● Alert Sender
FVG Detector Multiplier Factor :
This feature allows you to determine the size of the moves forming the FVGs based on the ATR (Average True Range). The default value is 1 to identify the majority of setups. You can increase this value according to the symbol and market you are trading in to achieve better results.
FVG Validity Period :
This shows the validity period of an FVG based on the number of candles. By default, an FVG area is valid for up to 15 candles. However, you can increase or decrease this period.
Level in Low-Risk Zone :
This feature helps reduce your risk. The method works by identifying the entire length of the three candles forming the FVG and dividing it into two equal areas. The upper area is "Premium," and the lower area is "Discount." To reduce risk, it is better for "Demand FVG" to be in the "Discount" and "Supply FVG" in the "Premium." This feature is off by default.
Issuing Signals Method :
This feature allows you to specify whether the hunt should occur only within the FVG area or if the wicks can extend outside the area.
If set to "Hunts," only signals where the wicks are within the area are issued, and the area loses its validity if the wicks extend outside.
In "Sweeps" mode, wicks can extend outside the area as long as they do not form a body within the area.
Number of Signals Allowed from a Zone :
This feature allows you to specify how many valid signals can be issued from one area.
Signal after Hunts/Sweeps :
In markets or symbols with a tendency for frequent stop hunts, this feature allows you to specify how many hunts should occur before you receive a signal to avoid receiving potentially failed signals.
How Many Hunts/Sweeps :
Enter the number of hunts you want to set for the "Signal after Hunts/Sweeps" feature here.
Show or Hide :
The number of setups formed may be very large, and displaying all of them on the chart can be distracting and messy. By default, only the last setup is displayed, but if you want to see all setups, you can turn on the relevant options.
Alert Sender :
You cannot constantly monitor multiple charts to identify trading opportunities. Using the alert sending feature can save time and improve performance.
Alerts Name : Customize the alert name to your preference.
Message Frequency : Determines the frequency of alert messages. Options include 'All' (triggers every time the function is called), 'Once Per Bar' (triggers only on the first call within the bar), and 'Once Per Bar Close' (triggers only on the final script execution of the real-time bar upon closure). The default is 'Once per Bar.'
Show Alert Time by Time Zone : Configure the alert messages to reflect any chosen time zone. For instance, input 'UTC+1' for London time. The default is 'UTC.'
By configuring these settings, traders can effectively utilize ICT setups to improve their trading strategies and outcomes.

Session Sweeps [LuxAlgo]The Session Sweeps indicator combines ICT-based features for a complete trading methodology involving market sessions, market structure, and fair value gaps to find optimal entry conditions for trading price action.
Traders frequently tend to place stop/limit orders at the high and low points of major trading sessions such as Asian (Tokyo), European (London), and North American (New York), resulting in the establishment of liquidity pools at those particular levels. The Session Sweeps indicator is crafted to recognize and underscore occurrences of session sweeps or liquidity sweeps during these major trading sessions.
🔶 USAGE
Default settings utilize major forex trading sessions, yet users can select their preferred opening and closing times, rename the sessions, or adjust the colors. It's important to note that the specified times for each session align with the respective local timezones: Asian (Tokyo) UTC+9, European (London) UTC, and North American (New York) UTC-5.
If the price briefly crosses either the highest or lowest point of a market session. These movements, aiming at triggering stop losses, suggest potential shifts in the market direction. Detecting such movements is the fundamental purpose and core functionality of the script.
🔹Market Structure Shifts
A Market Structure Shift refers to a change in market direction, either from an uptrend to a downtrend or vice versa. A part of a common entry model when using session sweeps is waiting for the formation of a CHoCH after a session sweep.
🔹Fair Value Gaps
A Fair Value Gap (FVG) holds particular appeal for price action traders, emerging when there are inefficiencies or imbalances in the market, often a result of uneven buying and selling activity. The underlying concept of FVGs is that the market tends to revisit these inefficiencies before resuming its trajectory in alignment with the initial impulsive move.
After the formation of a CHoCH traders can enter a position when the price enters the area of a Fair Value Gap (FVG).
🔹Setup Examples
This entry setup is commonly used by ICT traders and is shared for informational & educational purposes only.
Long Positions (5-Minute Timeframe):
Wait for the previous session's low to be swept.
Look for a Bullish Choch.
Find a Bullish FVG formed by or before the Choch.
Entry Point: At the FVG.
Take Profit (TP): At the session high or aim for a 1:2 Risk-Reward Ratio.
Stop Loss (SL): At the session low or nearest Swing Low.
Take partial profits at intermediate swings, but don’t shift SL prematurely.
Short Positions (5-Minute Timeframe):
Wait for the previous session's high to be swept.
Look for a Bearish Choch.
Find a FVG formed by or before the Choch.
Entry Point: At the FVG.
Take Profit (TP): At the previous session's low or aim for a 1:2 RR.
Stop Loss (SL): At the session high or nearest Swing High.
Take partial profits at intermediate swings, but don’t shift SL prematurely.
🔶 SETTINGS
🔹Session Sweeps
Buyside Sweep Zones, Color, and Margin: toggles the visibility of bullside sweep zones, customizes the associated color, and sets the margin value defining the range of a bullside sweep zone.
Sellside Sweep Zones, Color, and Margin: toggles the visibility of sell-side sweep zones, customizes the associated color, and sets the margin value defining the range of a sell-side sweep zone.
Sweep Margin Length: specifies the maximum allowed length of a sweep zone invalidation, the length over which the price slightly invalidated the margin range.
Detect Sweeps Once per Session: if enabled will detect only once a sweep zone within a session.
Hide Fake Sweep Zones, and Color: controls the visibility and color of the fake sweep zones.
🔹Sessions
Session (Asia, London, New York AM, and New York PM), Start Time, and End Time: enables or disables the visibility of the named market session range, and customization of the session hours.
Color: color customization option of the named session.
Extend Max/Min: extends the highest and lowest price levels of the named session until the end of the next enabled session. This option is recommended to be enabled when sweep zone detection is activated to observe the relationship between the sweep zone and previous session extreme levels.
Extend Mid: extends the mean price levels of the named session until the end of the next enabled session. The extended line may serve as potential support and resistance levels.
Fill: enables/disables background coloring of the named session.
New York DST | London DST: enabling this option initiates Daylight Saving Time (DST) for New York or London. Note: Daylight Saving Time is not applied to the Asian (Tokyo) session.
Sessions Extreme Lines | Sessions Names: toggles the visibility of the highest and lowest price levels, as well as the names, for all market sessions.
Session Lines Width: sets the width of the lines for all sessions.
Session Fill Transparency: sets the background color transparency of the range for all sessions.
🔹Market Structure Shifts
Market Structure Shifts: toggles the visibility of market structure shifts, also known as change of character (CHoCH).
Detection Length: specifies the detection length.
Market Structure Shifts; Bull & Bear: color customization options.
🔹Fair Value Gaps
Fair Value Gaps: toggles the visibility of the fair value gaps.
Fair Value Gap Width Filter: specifies the filtering multiplier; additional details can be found in the tooltip of the respective input option.
Bullish & Bearish Imbalance: color customization options.
🔹Sessions Tabular View
Sessions Tabular View: toggles the visibility of the tabular view of the sessions, displaying date &time, status, and countdown counter.
Hide if not Forex Market Instrument: checks the market and automatically enables/disables the option based on the market instrument.
Table Text Size & Position: size and placement customization options
🔶 LIMITATIONS
Please be aware that fair value gap filtering cannot be applied to the initial 144 candles (with a fixed-length ATR) as the ATR value necessary for filtering won't be available during this period.
🔶 RELATED SCRIPTS
Buyside-Sellside-Liquidity
Sessions
Liquidity-Voids-FVG
Thank you to our community for the recommendation of this script. To explore additional conceptual scripts and related content, we invite you to visit >>> LuxAlgo-Scripts .

Consecutive Unswept Lower Highs/ Higher Lows CounterCounts consecutive Lower Highs and Higher Lows; number resets to zero when previous pivot high or low gets swept
-To help give an idea of when a retracement / run-on-stops may be overdue. i.e. the higher the counter number grows, the longer we've gone without a proper retracement.
//inputs//
~pivot lookback/lookforward: increase this for more significant pivot highs and lows.
~number of pivot high 'counter' labels (pairs) to show in history.
~formatting options.

Typical Sweeps: Pivot high/low boxes. Grade sweeps, Handles/PipsTool to show typical pip-grade/ handle-grade sweep distance above pivot highs and pivot lows
-In consolidation/ranging periods (i.e. most of the time); Highs/Lows may by swept by fairly consistent distances in typical stop raids.
-Idea is from ICT teaching on typical Pip-grade sweeps in FX (10,20,30pips). Designed to work on FX, Indices, Commodities, Bitcoin.
-Above chart shows S&P; sweeping below and then above by 5 handles.
///inputs///
~choose sweep distance handles ($) or pips: will auto-calculate depending on the asset: FX= pips; Indices/stocks/commodities = handles ($)
--(2,5,10,20,30,50,100, 500, 1000)
~choose pivot lookback: larger number for more significant swing highs/lows
~choose number of historical boxes to display
~toggle on/off Pivot high boxes and Pivot low boxes independently
~extend boxes fully to the right (default is not extend)
~toggle on/off text
~text & box formatting options
Bitcoin, hourly chart; Pivot lookback = 15; $100 sweep boxes:
Eur/Usd; 15m chart; Pivot lookback = 30; 10pip sweep boxes; Boxes extended fully to the right:

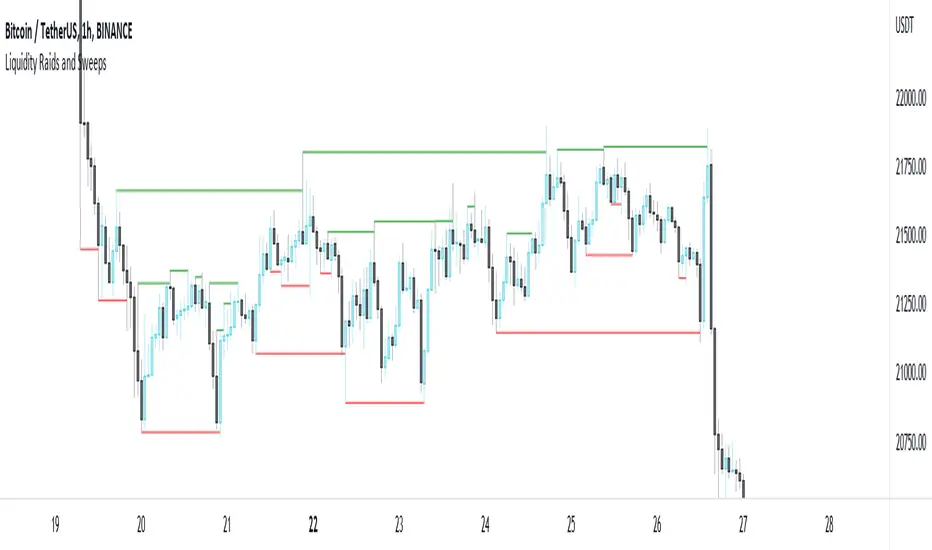
Liquidity Raids and Sweeps by TexmoonbeamLiquidity is a vital concept in trading. It gives us an indication of where buy / sell orders are in the market, and the direction price is likely to move once this liquidity has been taken.
The purpose of this indicator is to show you when and where there has been a 'raid' or 'sweep' of this liquidity, meaning a reversal might occur.
The indicator does this by looking for candle wicks, that go beyond a previous pivot high or low.
Settings:
Timeframe – This settings changes the timeframe that the indicator looks for raids/sweeps. Higher timeframes generally mean stronger moves.
Left bars – the number of bars gap higher/lower to the left of a pivot low/high. A higher number means the high or low was formed from a stronger move.
Right bars – the number of bars gap higher/lower to the right of a pivot low/high. A higher number means the high or low started a stronger move.
Max Gap – the maximum number of candles between a raid or sweep. Reduce this number on higher time frames if there are memory errors.
Min Gap – the minimum number of candles between a raid or sweep.
Alerts Wait For Close – If ticked, this means an alert will not be triggered by the current candle wick, overlapping a previous, until the close of that candle. Unticked you will be alerted as soon as the current candle crosses a previous high/low, though it might close far beyond that point and not actually turn out to be a raid/sweep.
Buy Side/Sell Side – line style and colour preferences for buy and sell side.
Strategy:
As seen in the example chart, the raid/sweep of liquidity, where only a wick reaches beyond a previous high or low, can be followed by a reversal of direction, often to seek other liquidity targets. This indicator could provide an opportunity to enter a trade at this point and the alert feature means you will be able to set up custom alerts on multiple charts or timeframes.
You should use other confluence and a lower time frame confirmation after a raid/sweep, to identify your entry, stop loss and targets. Familiarity with liquidity and smart money concepts are recommended.
Daily and Weekly Sweep - LiquidityDaily and Weekly Sweep – Liquidity
Description:
The script is designed to illustrate the sweeps of the high and low of the previous day and week. The larger the ratio of shares traded to the percentage price change, the more deep and liquid the market is presumed to be, therefore the market maker always seeks liquidity. Liquidity rests above previous highs and below previous lows as many traders see these as obvious points to place their stops. These are areas on the chart where many orders are placed together and serve as tipping points for market makers. The script focuses on the previous day and week. We can assume these are potential areas for mitigation.
How to use:
The indicator plots the highs and lows of the previous day and week. On default, it also shows the high and low price for the first 8 hours of the opening day of the week. Users can customise this in settings. The weekly open is also plotted. The background changes colour once a daily/weekly high or low has been breached and stops at the extreme point of price. These areas may provide points of interest in the future.
A good understanding of supply and demand, order blocks, market structure, and how to identify fresh levels is expected to utilise it's full potential.
Alert function added for:
- Daily Sweep
- Weekly Sweep
Indicator in use:

Koalafied EdgesIndicator based on user selected periods 'edges' (highs/lows). Includes One-Time-Framing and sweeps of levels.
User selection of previous Session/Day/Week highs and lows. These will plot over the relevant period once it has completed. Intra-day there are three periods that can be plotted.
For now these are most relevant to crypto. It can be useful to think of previous levels being locations that are likely to contain liquidity that the market might sweep in the future,
as much like pivot points, traders stop orders can be found there. Session breaks are included to allow for clear delineation between user selected periods. Additionally the option
to colour the background of a specific period is given to the user, this can be useful as an aid for visual analysis of session behaviour over time.
Untapped Levels
Previous Levels (Highs/Lows) that price has not re-tested will remain on the chart. These are typically the levels that are swept for liquidity in future periods.
Sweeps
Sweeps are formed when a candle opens above/below a previous periods level, crosses it and closes back on the side of the open. Often can mark important
pivots in the market and potential reversals. Useful if you think of stop liquidity resting outside previous periods highs/lows. Market 'sweeps' the level,
taking liquidity and reverses. Alerts for these are included.
One-Time-Framing
Indicator shows One-Time-Framing (OTF) for user selection of Candle, Session, Day, and Weekly timeframes. The background between the periods highs and lows (or candle colour)
will display the OTF state. This is a Market Profile concept that isn't typically found in Tradingview Scripts.
OTF is a sequence of days or time period where you don’t get a break of the previous candles low (OTF Up) or high (OTF Down). Typically shows a market
that is trending in one direction. If it's an outside day then no OTF status, if it's an inside day then the previous period high or low hasn't been
breached so OTF status stays same.
Candle colouring. I've included the option to switch between OTF coloured candles or my Volume Extension candles. I find the Volume Extension Candles invaluable
in showing areas of high market participation and can be quite informative at significant levels often showing exhaustion at support/resistance or market strength on breakouts.
Candles not supported by rising volume are coloured black while those that are retain their colouring.
Important to note that this indicator plots prior levels only when the selected period has ended. So at the start of a new period, the high/low of the previous
period will be plotted, with untapped lines extended into the future. The indicator is designed to show you what 'has' happened and to provide areas
of interest where you may wish to initiate trades. The sweep signals are the only real-time plots.

BenTrading - Upsweep+CMThis indicator can gives an alert when a candle purges a 3- or 4-candle swing high but closes below it (1). It can also give an alert when a candle closes below the last 3- or 4-candle swing low prior to the sweep (2).
How to:
1. Add indicator to chart chart of your desired timeframe
2. Right click indicator and "add alert
3. Decide the conditions for when you to be alerted (sweep or sweep+CM) and specify to be alerted on "candle close only"
4. Double click the chart and the indicator-window will be closed. (The indicator window has no value and should not be visible/taking up chart space)

BenTrading - Downsweep+CMThis indicator can gives an alert when a candle purges a 3- or 4-candle swing low but closes above it (1). It can also give an alert when a candle closes above the last 3- or 4-candle swing high prior to the sweep (2).
How to:
1. Add indicator to chart chart of your desired timeframe
2. Right click indicator and "add alert
3. Decide the conditions for when you to be alerted (sweep or sweep+CM) and specify to be alerted on "candle close only"
4. Double click the chart and the indicator-window will be closed. (The indicator window has no value and should not be visible/taking up chart space)
