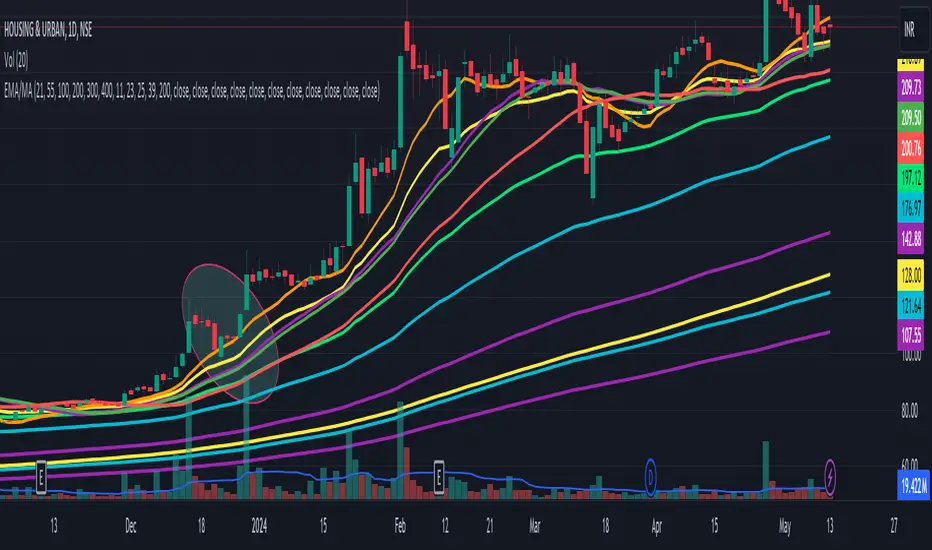
EPS TableEPS Table for tracking Earning per share This can be useful for Techo- a fundamental analyst, If you want more Tables on the fundamental or technical analysis you can contact me here. Pine Script® indicatorby ARUN_SAXENAUpdated 3370
DeleteArrayObject█ OVERVIEW Delete array object according to array size such as label, line, linefill, box and table. █ CREDITS HeWhoMustNotBeNamedPine Script® libraryby RozaniGhani-RG3
Harmonic Table Combo Point B█ OVERVIEW This indicator was intended as educational purpose only and alternative way to show value in table as shown in Harmonic Pattern Possibility Table . █ CREDITS Credit to Scott M Carney, Harmonic Trading Volume 3: Reaction vs. Reversal. █ USAGE EXAMPLE Pine Script® indicatorby RozaniGhani-RGUpdated 44
Harmonic Pattern Possibility Table█ OVERVIEW This indicator was intended as educational purpose only based on Harmonic Pattern Table (Source Code) and Ratio For Harmonic Points to show Harmonic Pattern Possibility. █ INSPIRATION This indicator was build upon realizing there are some overlap for B = XA among Alternate Bat, Bat, Crab and Gartley. Hence, the values split up to showcase the possibility of non overlap ratio. █ USAGE Possible pattern, priority pattern and selected pattern may differs based value input. Therefore C = AB, D = BC, D = XA and Stop Loss will change based value input and also selected pattern. █ CREDITS Credit to Scott M Carney, Harmonic Trading Volume 3: Reaction vs. Reversal.Pine Script® indicatorby RozaniGhani-RGUpdated 22162
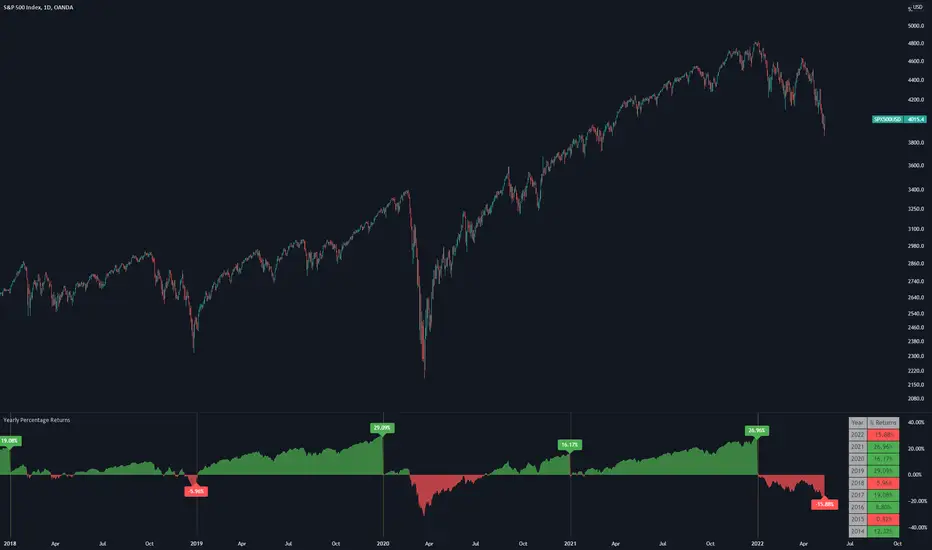
Yearly Percentage ReturnsAn indicator that lets you visualize the historical Yearly Percentage returns of any symbol . Key Features: Displays the yearly returns from start to end of each year Displays a table showing all yearly returns for current symbol Displays start of each year as a vertical line Displays up to 5 custom horizontal levels Table Settings: Enable table - Show/Hide the table Size - Sets the size of the table Position - Sets the position of the table on the screen Direction - Sets the direction of the table to display the data (Vertically or Horizontally) Pine Script® indicatorby Botnet101Updated 77387
[HELPER] Math Constant Helper█ OVERVIEW This indicator is to show constant in table using built-in math name space, coded in latest Pine Script version 5. █ CREDITS Credits to PineCoders. █ FEATURES - Display table by changing table position, font size and color.Pine Script® indicatorby RozaniGhani-RG11
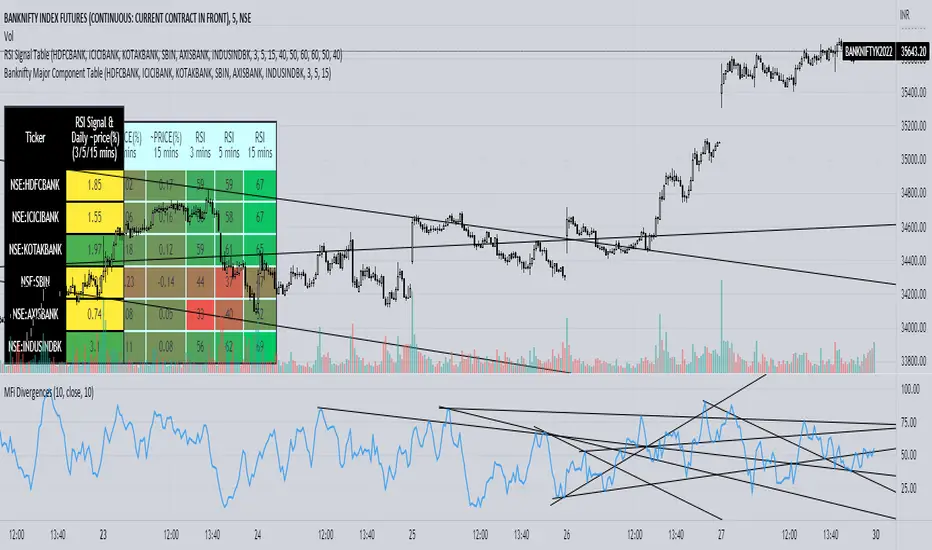
Banknifty Major Component TableThe table presented here is comprised of major Banknifty Index constituents showing price change in percentage terms and RSI value of three different timeframes to gauge overall Banknifty sentiment. This table is primarily created to cater scalpers and day traders. It helps traders to see market activity at a glance.Pine Script® indicatorby arn_sadUpdated 33183
Strategy Table LibraryLibrary "table_library" TODO: With this library, you can add tables to your strategies. strategy_table() Returns: Strategy Profit Table Adds a table to the graph of the strategy for which you are calling the function. You can see data such as net profit in this table. No parameters. Just call the function inside the strategy. Example Code : import only_fibonacci/table_lib/1 as st st.strategy_table()Pine Script® libraryby only_fibonacci77168
Selamat Hari RayaA fun way to express Selamat Aidil Fitri to all muslims. Selamat Hari Raya Aidil Fitri Maaf Zahir Dan Batin.Pine Script® indicatorby RozaniGhani-RG4411
Multiple Indicator 50EMA Cross AlertsHere’s a screener including Symbol, Price, TSI, and 50 ema cross in a table output. The 50 Exponential Moving Average is a trend indicator You can find bullish momentum when the 50 ema crossed over or a bearish momentum when the 50 ema crossed under we are looking to take advantage by trading the reversion of these trends. True strength index (TSI) is a trend momentum indicator Readings are bullish when the True Strength Index shows positive values Readings are bearish when the indicator displays negative values. When a value is above 20, we look for selling overbought opportunity and when the value is under 20, we look for buying oversold opportunity. You can select the pair of your choice in the settings. Make sure to create an alert and choose any alerts then an alert will trigger when a price cross under or cross over the 50 ema for every pair separately. This allow the user to verify if there is a trade set up or not. Disclaimer This post and the script don’t provide any financial advice. Pine Script® indicatorby F_rank_01Updated 2727522
matrixautotableLibrary "matrixautotable" Automatic Table from Matrixes with pseudo correction for na values and default color override for missing values. uses overloads in cases of cheap float only, with additional addon for strings next, then cell colors, then text colors, and tooltips last.. basic size and location are auto, include the template to speed this up... TODO : make bools version var string group_table = ' Table' var int _tblssizedemo = input.int ( 10 ) string tableYpos = input.string ( 'middle' , '↕' , inline = 'place' , group = group_table, options= ) string tableXpos = input.string ( 'center' , '↔' , inline = 'place' , group = group_table, options= , tooltip='Position on the chart.') int _textSize = input.int ( 1 , 'Table Text Size' , inline = 'place' , group = group_table) var matrix _floatmatrix = matrix.new (_tblssizedemo, _tblssizedemo, 0 ) var matrix _stringmatrix = matrix.new (_tblssizedemo, _tblssizedemo, 'test' ) var matrix _bgcolormatrix = matrix.new (_tblssizedemo, _tblssizedemo, color.white ) var matrix _textcolormatrix = matrix.new (_tblssizedemo, _tblssizedemo, color.black ) var matrix _tooltipmatrix = matrix.new (_tblssizedemo, _tblssizedemo, 'tool' ) // basic table ready to go with the aboec matrixes (replace in your code) // for demo purpose, random colors, random nums, random na vals if barstate.islast varip _xsize = matrix.rows (_floatmatrix) -1 varip _ysize = matrix.columns (_floatmatrix) -1 for _xis = 0 to _xsize -1 by 1 for _yis = 0 to _ysize -1 by 1 _randomr = int(math.random(50,250)) _randomg = int(math.random(50,250)) _randomb = int(math.random(50,250)) _randomt = int(math.random(10,90 )) bgcolor = color.rgb(250 - _randomr, 250 - _randomg, 250 - _randomb, 100 - _randomt ) txtcolor = color.rgb(_randomr, _randomg, _randomb, _randomt ) matrix.set(_bgcolormatrix ,_yis,_xis, bgcolor ) matrix.set(_textcolormatrix ,_yis,_xis, txtcolor) matrix.set(_floatmatrix ,_yis,_xis, _randomr) // random na _ymiss = math.floor(math.random(0, _yis)) _xmiss = math.floor(math.random(0, _xis)) matrix.set( _floatmatrix ,_ymiss, _xis, na) matrix.set( _stringmatrix ,_ymiss, _xis, na) matrix.set( _bgcolormatrix ,_ymiss, _xis, na) matrix.set( _textcolormatrix ,_ymiss, _xis, na) matrix.set( _tooltipmatrix ,_ymiss, _xis, na) // import here import kaigouthro/matrixautotable/1 as mtxtbl // and render table.. mtxtbl.matrixtable(_floatmatrix, _stringmatrix, _bgcolormatrix, _textcolormatrix, _tooltipmatrix, _textSize ,tableYpos ,tableXpos) matrixtable(_floatmatrix, _stringmatrix, _bgcolormatrix, _textcolormatrix, _tooltipmatrix, _textSize, tableYpos, tableXpos) matrixtable Parameters: _floatmatrix : float vals _stringmatrix : string _bgcolormatrix : color _textcolormatrix : color _tooltipmatrix : string _textSize : int tableYpos : string tableXpos : string matrixtable(_floatmatrix, _stringmatrix, _bgcolormatrix, _textcolormatrix, _textSize, tableYpos, tableXpos) matrixtable Parameters: _floatmatrix : float vals _stringmatrix : string _bgcolormatrix : color _textcolormatrix : color _textSize : int tableYpos : string tableXpos : string matrixtable(_floatmatrix, _stringmatrix, _bgcolormatrix, _txtdefcol, _textSize, tableYpos, tableXpos) matrixtable Parameters: _floatmatrix : float vals _stringmatrix : string _bgcolormatrix : color _txtdefcol : color _textSize : int tableYpos : string tableXpos : string matrixtable(_floatmatrix, _stringmatrix, _txtdefcol, _bgdefcol, _textSize, tableYpos, tableXpos) matrixtable Parameters: _floatmatrix : float vals _stringmatrix : string _txtdefcol : color _bgdefcol : color _textSize : int tableYpos : string tableXpos : string matrixtable(_floatmatrix, _txtdefcol, _bgdefcol, _textSize, tableYpos, tableXpos) matrixtable Parameters: _floatmatrix : float vals _txtdefcol : color _bgdefcol : color _textSize : int tableYpos : string tableXpos : stringPine Script® libraryby kaigouthroUpdated 10
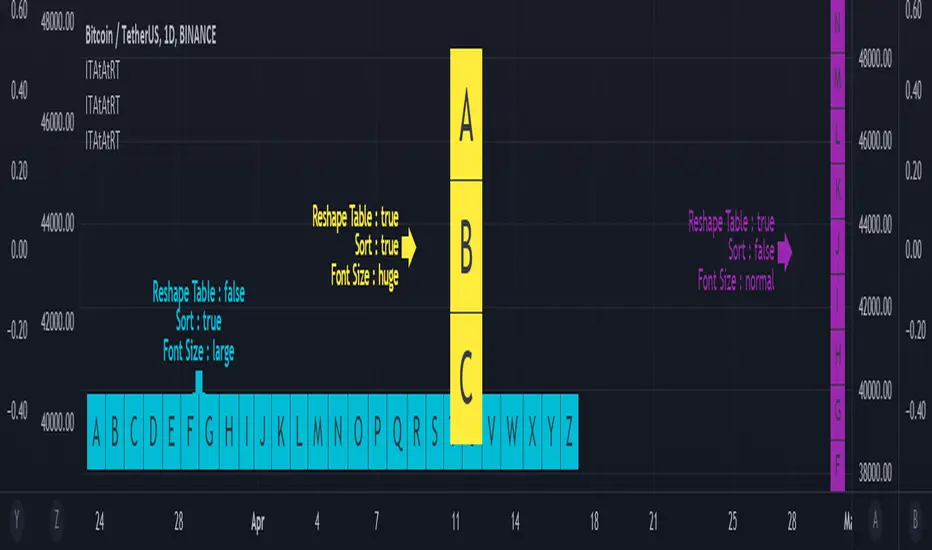
Input Text Area to Array then Reshape Table█ OVERVIEW Simple method to convert from input.text_area to array using str.split. Reshape table using switch, not necessary must use matrix.reshape. Might be useful pine script to replace input.symbol. █ FEATURES Table can positioned by any position and font size can be resized. Reshape table and sorting array if necessary. █ CREDITS Credits to TradingView for new update of input.text_area.Pine Script® indicatorby RozaniGhani-RGUpdated 4477
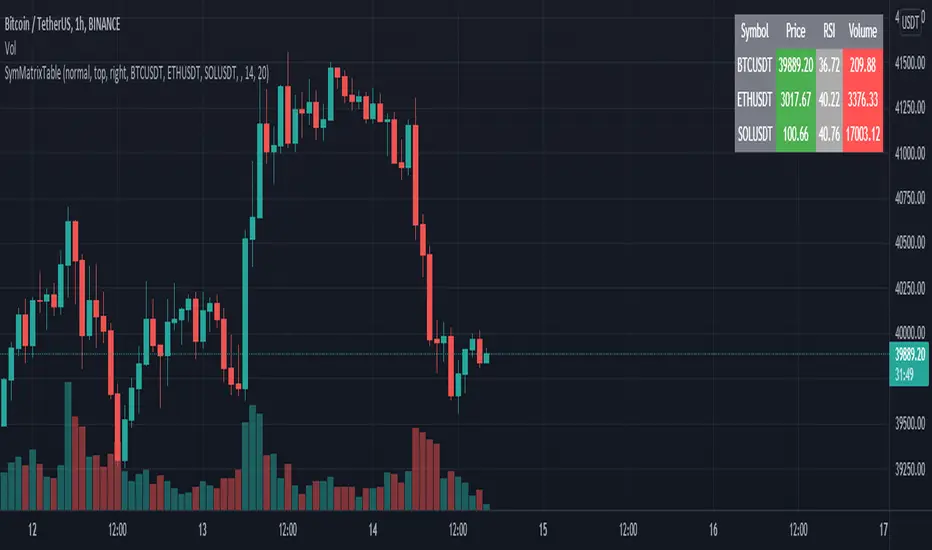
SymMatrixTableSimple Example Table for Displaying Price, RSI, Volume of multiple Tickers on selected Timeframe Displays Price, RSI and Volume of 3 Tickers and Timeframe selected by user input Conditional Table Cell coloring Price color green if > than previous candle close and red if < previous candle close RSI color green if < 30 and red if > 70 (RSI14 by default) Volume color green if above average volume and red if less than that (SMA20 volume by default) Can turn on/off whole table, header columns, row indices, or select individual columns or rows to show/hide // Example Mixed Type Matrix To Table // access the simple example script by uncommenting the code at the end Basically I wanted to have the headers and indices as strings and the rest of the matrix for the table body as floats, then conditional coloring on the table cells And also the functionality to turn rows and columns on/off from table through checkboxes of user input Before I was storing each of the values separately in arrays that didn't have a centralized way of controlling table structure so now the structure is : - string header array, string index array - float matrix for table body - color matrix with bool conditions for coloring table cells - bool checkboxes for controlling table display Pine Script® indicatorby machdragonUpdated 3366
Reshape Table Matrix█ OVERVIEW Simple method to reshape matrix to table. Credits to Tradingview for new matrix update.Pine Script® indicatorby RozaniGhani-RG66
Squeeze Detector 3000This is a bespoke, unfinished script for Kyle. It is primarily designed to be used to provide useful data for unusually volatile stocks premarket, and for some other situations too. Featuring: Pre/post market volume Short data RVOL ATR and turnover Pine Script® indicatorby barnabygraham43
US Stock Market Sectors Overview Table [By MUQWISHI]US Market Overview Table will identify the bullish and bearish sectors of a day by tracking the SPDR sectors funds. It's possible to add a ticker symbol for correlation compared to each sector. Overview Indicator Pine Script® indicatorby MUQWISHIUpdated 1717703
Valuation TableHey folks, I hope you are all doing well! This is an indicator that you can use to help you to evaluate companies. There are a few things I added to the valuation table that I personally use and I will explain what they are. I added Joel Greenblatt's ROC% because it takes Earnings before Interest and Taxes to reflect more closely what the company earns from its operations, while including the cost of depreciation/amortization of assets. A high double digit figure often means that the company has a defensible edge versus its competitors (e.g. a strong brand or a unique product). It's good for relative valuation (comparing two companies in the same industry). I also added Donald Yacktman's forward rate of return. Yacktman defines forward rate of return as the normalized free cash flow yield plus real growth plus inflation . Unlike the Earnings Yield %, the Forward Rate of Return uses the normalized Free Cash Flow of the past seven years, and considers growth. The forward rate of return can be thought of as the return that investors buying the stock today can expect from it in the future. Yacktman’s Forward Rate of Return may or may not be a useful metric. However, it does present new ways to see and think about stocks we may want to buy. I added a box called "real price" and that is from Peter Lynch's book, "One Up on Wall Street," where he talked about how the real price of the stock is really the current price - Net Cash Per Share. I would also personally pair this script with TradingView's built in financial indicators that shows the revenue growth, net income, etc. Note: the script only works on the weekly timeframe and it will take some time to load because it has a lot of data.Pine Script® indicatorby kenhuangsy2Updated 1616297
Performance Table From OpenThis indicator plots the percentage performance from the open of up to 20 different customizable tickers. Enjoy! Pine Script® indicatorby barnabygrahamUpdated 22194
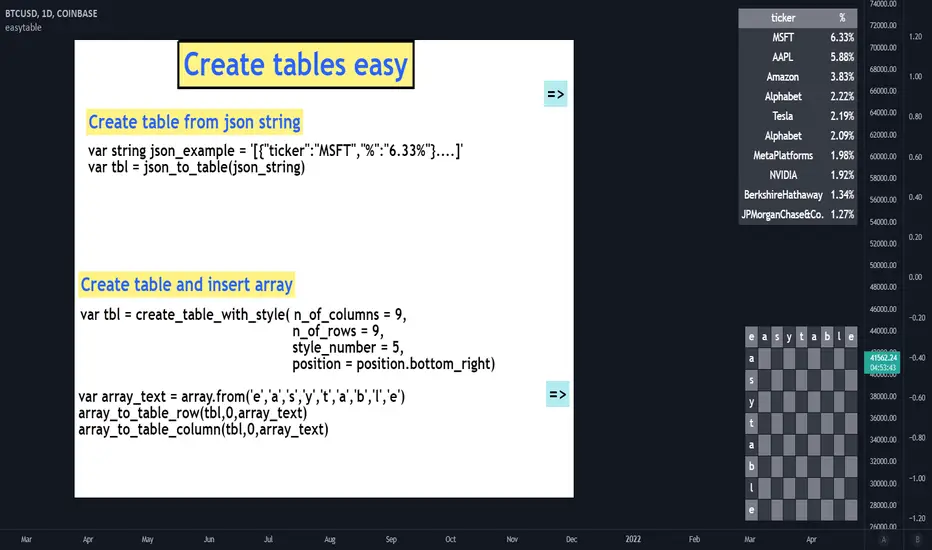
easytableLibrary "easytable" Create tables easily, with minimal code ▦ FEATURES ▦ █ Create tables █ JSON To Table █ Change Colors █ Array to Rows/Columns █ Pre-Styles █ Change Text Size █ Delete Rows/Columns █ Blink Cells indentify_table_id() Identifies all tables ID number in each cell(0,0). get_table_by_id(id_number) Get table object by ID number. Parameters: id_number : (int) ID number of the table to fetch. Returns: table. change_cells_color(table_object, cells_color, start_column, end_column, start_row, end_row) Change cells background colors. Parameters: table_object : (table) table object to be changed. cells_color : (color) Cells color. start_column : (int) Start column. end_column : (int) End column. start_row : (int) Start Row. end_row : (int) End Row to change. Returns: Void. change_cells_text_color(table_object, text_color, start_column, end_column, start_row, end_row) Change cells text colors. Parameters: table_object : (table) table object to be changed. text_color : (color) Text color. start_column : (int) Start column. end_column : (int) End column. start_row : (int) Start Row. end_row : (int) End Row. Returns: Void. change_all_table_text_color(table_object, text_color, table_column_size, table_row_size) Change All table text color. Parameters: table_object : (table) table object to be changed. text_color : (color) Text color. table_column_size : (int) Size of the table columns. table_row_size : (int) Size of the table rows. Returns: Void. change_table_size(table_object, n_of_columns, n_of_rows, tbl_size) Change table size. Parameters: table_object : (table) table object to be changed. n_of_columns : (int) Size of the table columns. n_of_rows : (int) Size of the table rows. tbl_size : (string) size of the table. Returns: Void. change_cells_text_size(text_size, start_column, end_column, start_row, end_row, table_id) Change table cells text size . Parameters: text_size : (string) Text size. start_column : (int) Start column. end_column : (int)(optional) End column. start_row : (int)(optional) Start Row. end_row : (int)(optional) End Row. table_id : (int)(optional) Number of the ID of the table. Returns: Void. table_delete_row(table_object, table_column_size, start_row, end_row) Delete specified rows from table. Parameters: table_object : (table) table object to be changed. table_column_size : (int) Table columns max size. start_row : (int) Start row to delete. end_row : (int)(optional) End row to delete (optional — Assumes start_row value). Returns: Void. table_delete_column(table_object, table_row_size, start_column, end_column) Delete specified columns from table. Parameters: table_object : (table) table object to be changed. table_row_size : (int) Table rows max size. start_column : (int) Start column to delete. end_column : (int)(optional) End column to delete (optional — Assumes start_column value). Returns: Void. array_to_table_column_auto(column_to_insert, array_to_insert, table_id) Insert string array to table column without passing table object. Parameters: column_to_insert : (int) Column to be inserted. array_to_insert : (string array) Start column to delete. table_id : (int)(optional) Number of the ID of the table. Returns: Void. array_to_table_row_auto(row_to_insert, array_to_insert, table_id) Insert string array to table row without passing table object. Parameters: row_to_insert : (int) Column to be inserted. array_to_insert : (string array) Start column to delete. table_id : (int)(optional) Number of the ID of the table. Returns: Void. array_to_table_row(table_object, row_to_insert, array_to_insert) Insert string array to table row by passing table object. Parameters: table_object : (table) table object to be changed. row_to_insert : (int) Row to be inserted. array_to_insert : (string array) Start column to delete. Returns: Void. array_to_table_column(table_object, column_to_insert, array_to_insert) Insert string array to table column by passing table object. Parameters: table_object : (table) table object to be changed. column_to_insert : (int) Column to be inserted. array_to_insert : (string array) Start column to delete. Returns: Void. blink_cell(cell_column, cell_row, c_color, blink_interval_ms, table_id) Changes cell color at set intervals (blink). Parameters: cell_column : (int) Cell column position. cell_row : (int) Cell row position. c_color : (color) Color to blink. blink_interval_ms : (int)(opt) Interval in milliseconds. table_id : (int)(opt) Table ID number. change_table_style(table_object, number_of_columns, number_of_rows, color) Changes table pre-style by selecting a pre-style number. Parameters: table_object : (table) table object to be changed. number_of_columns : (int) Table column size. number_of_rows : (int) Table row size. color : 1 (color) Color of . Returns: Void. create_table_clean(n_of_columns, n_of_rows, position) Create a simple(blank) table without any styling. Parameters: n_of_columns : (int) Numbers of columns in the table. n_of_rows : (int) Number of rows in the table. position : (string) table position. Returns: table object. create_table_with_style(n_of_columns, n_of_rows, style_number, position) Create table with a pre-set style. Parameters: n_of_columns : (int) Numbers of columns in the table. n_of_rows : (int) Number of rows in the table. style_number : (int) Style number. position : (string) table position. Returns: table object. json_to_table(raw_json) Create table based on input raw json string. Parameters: raw_json : (int) Raw json string. Returns: table object. json_example() Example function that display a table based on a json example_create_table() Pine Script® libraryby MA_PT8835
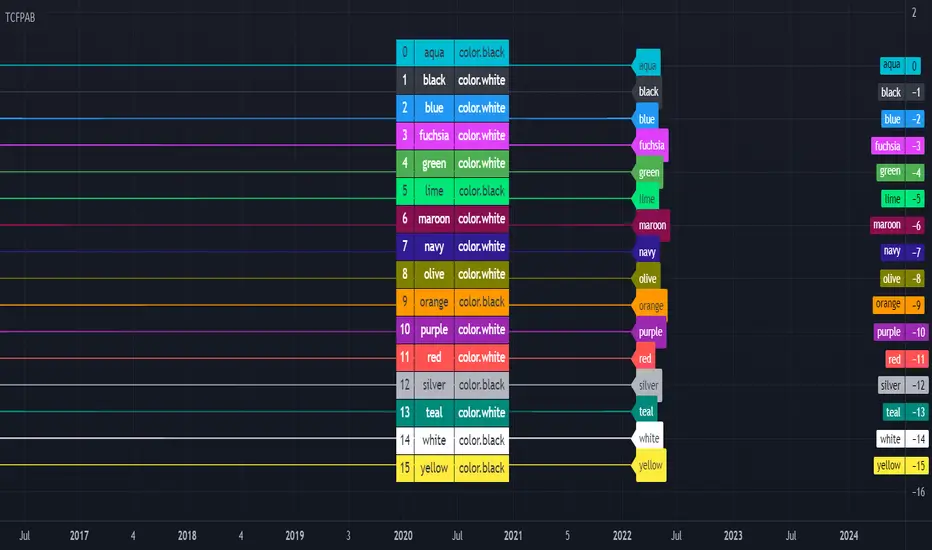
[HELPER] Table Color For Pairing Black And White█ OVERVIEW This helper intend to simplify which color pair better with black or white color, may help some pine coders. █ INSPIRATION This color choice was inspired during plot especially user enable dark color theme. Color displayed at table and label are based on Indicator name label and Indicator last value label displayed at Scales. █ FEATURES Color can be tick to be inverted color. Display table by changing table position and font size. Pine Script® indicatorby RozaniGhani-RGUpdated 1172
Logger Library For Pinescript (Logging and Debugging)Library "LoggerLib" This is a logging library for Pinescript. It is aimed to help developers testing and debugging scripts with a simple to use logger function. Pinescript lacks a native logging implementation. This library would be helpful to mitigate this insufficiency. This library uses table to print outputs into its view. It is simple, customizable and robust. You can start using it's .log() method just like any other logging method in other languages. ////////////////// USAGE ////////////////// -- Recommended: Please Read The Documentation From Source Code Below. It Is Much More Readable There And Will Be Updated Along With Newer Versions. -- Importing the Library --------------------- import paragjyoti2012/LoggerLib/ as Logger .init() : Initializes the library and returns the logger pointer. (Later will be used as a function parameter) .initTable: Initializes the Table View for the Logger and returns the table id. (Later will be used as a function parameter) parameters: logger: The logger pointer got from .init() max_rows_count: Number of Rows to display in the Logger Table (default is 10) offset: The offset value for the rows (Used for scrolling the view) position: Position of the Table View Values could be: left right top-right (default is left) size: Font Size of content Values could be: small normal large (default is small) hide_date: Whether to hide the Date/Time column in the Logger (default is false) returns: Table example usage of .initTable() import paragjyoti2012/LoggerLib/1 as Logger var logger=Logger.init() var logTable=Logger.initTable(logger, max_rows_count=20, offset=0, position="top-right") ------------------- LOGGING ------------------- .log() : Logging Method params: (string message, |string| logger, table table_id, string type="message") logger: pass the logger pointer from .init() table_id: pass the table pointer from .initTable() message: The message to log type: Type of the log message Values could be: message warning error info success (default is message) returns: void /////////////////////////////////////// Full Boilerplate For Using In Indicator /////////////////////////////////////// P.S: Change the | (pipe) character into square brackets while using in script (or copy it from the source code instead) offset=input.int(0,"Offset",minval=0) size=input.string("small","Font Size",options=|"normal","small","large"|) rows=input.int(15,"No Of Rows") position=input.string("left","Position",options=|"left","right","top-right"|) hide_date=input.bool(false,"Hide Time") import paragjyoti2012/LoggerLib/1 as Logger var logger=Logger.init() var logTable=Logger.initTable(logger,rows,offset,position,size,hide_date) rsi=ta.rsi(close,14) |macd,signal,hist|=ta.macd(close,12,26,9) if(ta.crossunder(close,34000)) Logger.log("Dropped Below 34000",logger,logTable,"warning") if(ta.crossunder(close,35000)) Logger.log("Dropped Below 35000",logger,logTable) if(ta.crossover(close,38000)) Logger.log("Crossed 38000",logger,logTable,"info") if(ta.crossunder(rsi,20)) Logger.log("RSI Below 20",logger,logTable,"error") if(ta.crossover(macd,signal)) Logger.log("Macd Crossed Over Signal",logger,logTable) if(ta.crossover(rsi,80)) Logger.log("RSI Above 80",logger,logTable,"success") //////////////////////////// // For Scrolling the Table View //////////////////////////// There is a subtle way of achieving nice scrolling behaviour for the Table view. Open the input properties panel for the table/indicator. Focus on the input field for "Offset", once it's focused, you could use your mouse scroll wheel to increment/decrement the offset values; It will smoothly scroll the Logger Table Rows as well. ///////////////////// For any assistance using this library or reporting issues, please write in the comment section below. I will try my best to guide you and update the library. Thanks :) ///////////////////// Pine Script® libraryby CyberMenschUpdated 212152
ObjectStackLibrary "ObjectStack" init() push() push() push() push() push() nextIndex() nextIndex() nextIndex() nextIndex() nextIndex() delete() delete() delete() delete() delete() cleanOldest() cleanOldest() cleanOldest() cleanOldest() cleanOldest() Pine Script® libraryby cryptolinxUpdated 10
[Nic] Intraday Vix LabelsPrints intraday percent change of VIX9D, VVIX, PCC, and any other arbitrary symbol on a table for quick reference.Pine Script® indicatorby NicTheMajesticUpdated 2299