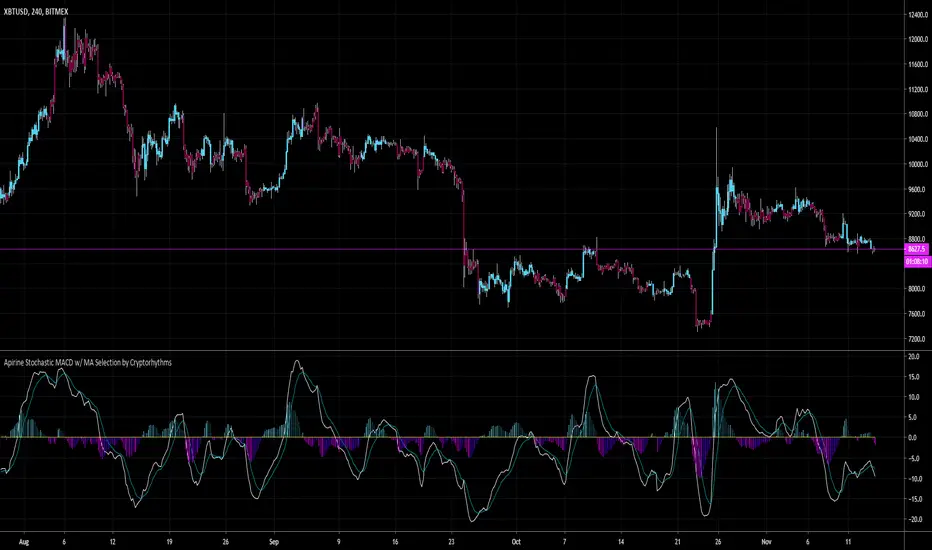
Apirine Stochastic MACD w/ MA Selection by Cryptorhythms📊 Apirine Stochastic MACD w/ MA Selection by Cryptorhythms
Intro
Had to re-release due to moderation.
This happens to be my first open source indicator, hope you all enjoy it!
Description
This indicated is ported from November 2019 issue of TASC. “The Stochastic MACD Oscillator” in this issue, author Vitali Apirine introduces a new indicator created by combining the stochastic oscillator and the MACD . He describes the new indicator as a momentum oscillator and explains that it allows the trader to define overbought and oversold levels similar to the classic stochastic but based on the MACD .
Options
-You can enable bar coloration for trade state (signal conditions setup in the "long" and "short" variables).
-You can choose histogram or columns for the convergence/divergence display.
-You can turn on/off and adjust the overbought / oversold zones.
-You can choose what type of moving average to use in the calculation from a small selection of options. This gives you more flexibility to adapt the indicator to your needs.
👍 We hope you enjoyed this indicator and find it useful! We post free crypto analysis, strategies and indicators regularly. This is our 70th script on Tradingview!
🤐Check my Signature for other information
Tasc
Fourier series Model Of The Market█ OVERVIEW
The Fourier Series Model of the Market (FSMM) decomposes price action into harmonic components using bandpass filtering, then reconstructs a composite wave weighted by rolling energy ratios. This approach isolates cyclical market behavior at multiple frequencies, emphasizing dominant cycles for cleaner signal generation. The energy-adaptive weighting is the key differentiator from simple harmonic summation: cycles that dominate current price action contribute more to the output.
Based on Fourier analysis principles applied to financial markets, the indicator extracts harmonics (fundamental, 2nd, 3rd, etc.) using second-order IIR bandpass filters, then weights each harmonic's contribution by its relative energy compared to adjacent harmonics. This energy-adaptive weighting naturally emphasizes the cycles that are most prominent in current market conditions.
█ CONCEPTS
Fourier Decomposition
Fourier analysis represents any periodic signal as a sum of sine waves at different frequencies. In market analysis, price action can be decomposed into a fundamental cycle (the base period) plus harmonics at integer multiples of that frequency (period/2, period/3, etc.). Each harmonic captures oscillations at a specific frequency band, and their sum reconstructs the original cyclical behavior.
Bandpass Filtering
Each harmonic is extracted using a second-order IIR (Infinite Impulse Response) bandpass filter tuned to that harmonic's frequency. The filter isolates price activity within a narrow frequency range while rejecting both higher-frequency noise and lower-frequency trend drift. Before filtering, the source is debiased via 2-bar momentum to remove DC offset, ensuring each bandpass operates around true zero.
Energy-Weighted Reconstruction
Rather than simply summing all harmonics equally, FSMM weights each harmonic by its rolling energy relative to the previous harmonic. The energy score combines the current harmonic value with its rate of change, so it reflects both amplitude and momentum. Higher harmonics that hold comparatively more energy therefore contribute more to the composite wave, while weaker harmonics fade out. This adaptive weighting allows the model to respond to changing market cyclicality.
Quadrature Component (Rate of Change)
The rate of change output represents the 90°-phase-shifted (quadrature) component of the wave. When the wave is at zero and rising, the rate of change is at maximum positive. This provides complementary information about cycle phase and can be used for timing entries relative to cycle position.
█ INTERPRETATION
Wave Output
The composite wave oscillates around zero, representing the sum of all extracted harmonic components weighted by energy:
• Above zero : Net bullish cyclical momentum across harmonics
• Below zero : Net bearish cyclical momentum across harmonics
• Zero crossings : Cycle phase transitions - potential reversal points
• Wave amplitude : Strength of cyclical behavior; larger swings indicate cleaner cycles
Rate of Change
The quadrature component (90° phase-shifted) provides cycle phase information:
• Maximum rate of change : Wave is near zero and accelerating - early cycle phase
• Zero rate of change : Wave is at peak or trough - cycle extremes
• Rate/Wave divergence : When wave makes new highs/lows but rate of change does not confirm (lower momentum), suggests cycle exhaustion or impending phase shift
Combined Analysis
• Wave crossing above zero with positive rate of change: Strong bullish cycle initiation
• Wave crossing below zero with negative rate of change: Strong bearish cycle initiation
• Wave at extreme with rate of change reversing: Potential cycle peak/trough
Threshold Bands
When enabled, threshold bands define statistically significant wave deviations:
• Breach above +threshold : Unusually strong bullish cyclical behavior
• Breach below -threshold : Unusually strong bearish cyclical behavior
• Return inside thresholds : Normalizing behavior, potential mean reversion ahead
Alert Conditions
Four built-in alerts trigger on bar close (no repainting):
• Above +Threshold : Strong bullish cycle behavior
• Below -Threshold : Strong bearish cycle behavior
• Above Zero : Bullish cycle phase shift
• Below Zero : Bearish cycle phase shift
█ SETTINGS & PARAMETER TUNING
Fourier Series Model
• Source : Price series to decompose into harmonic components.
• Period (6-100): Base period for the fundamental harmonic. Higher harmonics divide this period (harmonic 2 = period/2, harmonic 3 = period/3). Match to the dominant market cycle for best results. Default 20.
• Bandwidth (0.05-0.5): Bandpass filter selectivity. Lower values create narrower passbands that isolate harmonics more precisely but may miss slightly off-frequency cycles. Higher values capture broader ranges but reduce harmonic separation. Default 0.1 balances precision and robustness.
• Harmonics (1-20): Number of harmonic components to extract. More harmonics capture finer cyclical detail but increase computation. For most applications, 3-5 harmonics suffice. The fundamental alone (1 harmonic) functions as a simple bandpass filter.
Display Settings
• Wave Outputs : Toggle visibility and color of the composite Fourier wave.
• Rate of Change : Toggle visibility and color of the quadrature component (90° phase-shifted wave).
• Zero Line : Reference line for oscillator neutrality.
Diagnostics - Dynamic Thresholds
Optional significance bands that identify when wave readings indicate strong cyclical behavior:
• Dynamic Threshold : Toggle threshold bands and set colors.
• Threshold Mode : Select calculation method:
- MAD (Median Absolute Deviation) : Robust, outlier-resistant measure using k * MAD where MAD ≈ 0.6745 * stdev.
- Standard Deviation : Volatility-sensitive, calculated as k * stdev of wave over the lookback period.
- Percentile Rank : Fixed probability bands using percentile of |wave| (90% means only 10% of values exceed threshold).
• Period (2-200): Lookback for threshold calculations. Default 50.
• Multiplier (k) : Scaling for MAD/Standard Deviation modes. Default 1.5.
• Percentile (%) (0-100): For Percentile Rank mode only. Default 90%.
Parameter Interactions
• Shorter periods respond faster to cycle changes but may capture noise.
• Lower bandwidth + more harmonics = more precise decomposition but requires accurate period setting.
• Higher bandwidth is more forgiving of period mismatches.
• For strongly trending markets, restrict harmonics to 1-2 so the model tracks the dominant cycle with fewer higher-frequency components.
• For ranging/oscillating markets, more harmonics (4-6) capture complex cycles.
█ LIMITATIONS
Inherent Characteristics
• Period dependency : Effectiveness depends on correctly matching the Period parameter to actual market cycles. Use cycle measurement tools (autocorrelation, FFT, dominant cycle indicators) to identify appropriate periods.
• Stationarity assumption : The indicator assumes cycle frequencies remain relatively stable within the lookback window. Rapidly shifting dominant cycles (regime transitions) may produce inconsistent results until the buffer adapts.
• Filter lag : Despite bandpass design, some lag remains inherent to causal filtering. Higher harmonics have less lag but more noise sensitivity.
• Energy weighting artifacts : During regime changes when harmonic energy ratios shift rapidly, weighting may produce transient anomalies.
Market Conditions to Avoid
• Strong trending markets : Pure trends with no cyclicality produce weak, meandering signals. The indicator assumes cyclical market behavior.
• News events/gaps : Large discontinuities disrupt filter continuity. Requires 1-2 full periods to stabilize.
• Period mismatch : If the Period parameter doesn't match actual market cycles, harmonic extraction produces noise rather than signal.
Parameter Selection Pitfalls
• Too many harmonics : Beyond 5-6 harmonics, additional components often capture noise rather than meaningful cycles.
• Bandwidth too narrow : Very low bandwidth (< 0.05) requires extremely precise period matching; slight mismatches cause signal loss.
• Over-optimization : Perfect historical parameter fits typically fail forward. Use robust defaults across multiple instruments.
█ NOTES
Credits
This indicator applies Fourier analysis principles to financial market data, building on the extensive work of Dr. John F. Ehlers in applying digital signal processing to trading. The bandpass filter implementation and harmonic decomposition approach draw from DSP fundamentals as presented in Ehlers' publications.
For those interested in the underlying mathematics and DSP concepts:
• Ehlers, J.F. (2001). Rocket Science for Traders: Digital Signal Processing Applications . John Wiley & Sons.
• Ehlers, J.F. (2013). Cycle Analytics for Traders . John Wiley & Sons.
• Various TASC articles by John Ehlers on bandpass filters, cycle analysis, and harmonic decomposition.
by ♚@e2e4

Voss Predictive Filter█ OVERVIEW
The Voss Predictive Filter (VPF) is a negative group delay (NGD) filter that anticipates cyclical price movement through phase compensation. The VPF isolates band-limited cyclical components via a bandpass filter, then applies negative group delay to shift the signal's phase forward, causing the output to lead the input by a fraction of the cycle period.
Based on Dr. John F. Ehlers' "Voss Predictive Filter" article in Technical Analysis of Stocks & Commodities (TASC) magazine, the VPF displays a predictive oscillator with optional dynamic threshold bands for identifying significant cycle behavior. The indicator is timeframe-agnostic - the mathematics work identically from tick charts to monthly bars, though shorter timeframes require more careful parameter selection due to noise.
█ CONCEPTS
Bandpass Filtering
A bandpass filter isolates price activity within a specific frequency range, removing both high-frequency noise and low-frequency trend drift. The VPF uses a second-order IIR (Infinite Impulse Response) bandpass filter characterized by the center frequency (the Bandpass Period input) and bandwidth. The center frequency determines which cycle period the filter emphasizes, while bandwidth controls the damping coefficient - how tightly the filter focuses around that frequency. Before filtering, the source is debiased via 2-bar momentum to remove DC offset, ensuring the filter operates around a true zero centerline.
Negative Group Delay Filtering
The predictive capability stems from negative group delay (NGD) - a filter characteristic where output appears to "lead" the input. Most causal filters introduce lag (positive group delay), but by combining the bandpass filter output with appropriately weighted past values, the VPF achieves negative group delay characteristics.
This is a universal NGD filter application for band-limited signals: the bandpass filter isolates the cyclical component of interest, then the NGD stage advances the phase within this limited frequency range to create an anticipatory output. This isn't statistical forecasting; it's phase compensation that shifts the signal's timing forward, causing peaks and troughs to appear before they occur in the bandpass output.
Negative Group Delay Stage
The NGD stage combines the current bandpass output with weighted historical values to produce an output that leads the input. By subtracting a weighted average of past deviations from a scaled version of the current filter value, the algorithm advances the signal's phase: peaks and zero-crossings in the voss output appear before the corresponding events in the bandpass filter.
The prediction order (`3 * Prediction Multiplier`) controls how many past values contribute to the phase advance. Higher orders provide smoother output but reduce the leading effect; lower orders maximize anticipation at the cost of stability.
█ INTERPRETATION
Zero-Line Crossovers
Crossings above zero suggest bullish momentum in the filtered cycle; below zero suggests bearish momentum. Crossings from near-zero regions are most reliable, as extreme excursions need time to return to equilibrium.
Threshold Bands
Threshold bands define "significant" deviation. Breaches indicate unusually strong behavior and can serve as:
• Trend confirmation when aligned with price direction
• Overbought/oversold warnings at extremes
• Trade entry filters (requiring threshold breach in the intended direction)
Threshold Mode affects sensitivity: MAD (outlier-resistant), Standard Deviation (volatility-sensitive), Percentile Rank (fixed probability bands).
Alert Conditions
Four built-in alerts trigger on bar close (no repainting): Above +Threshold (strong bullish cycle), Below -Threshold (strong bearish cycle), Above Zero (bullish phase shift), Below Zero (bearish phase shift).
█ SETTINGS & PARAMETER TUNING
Voss Predictive Filter
• Source : Price series to filter.
• Bandpass Period (1-100): Primary tuning parameter determining which cycle length the filter emphasizes. Short periods (8-15) are more responsive but noisier; medium periods (16-30) balance responsiveness and smoothness; long periods (31-100) focus on longer cycles with more smoothing.
• Bandwidth (0.01-0.45): Controls filter selectivity. Narrow bandwidths (0.01-0.15) isolate specific cycle periods precisely; medium (0.16-0.30) tolerate cycle irregularity; wide (0.31-0.45) capture broader cycle ranges. Shorter periods pair well with narrower bandwidths.
• Prediction Multiplier (2-10): Controls how many past values contribute to the phase advance. Higher values provide smoother output but reduce the leading effect; lower values maximize anticipation at the cost of stability.
Display Settings
Control visibility and colors of the Voss output, bandpass filter, and zero reference lines.
Diagnostics - Dynamic Thresholds
Three methods identify significant signal deviation:
• MAD (Median Absolute Deviation) : Robust, outlier-resistant measure using `k * MAD` where `MAD ≈ 0.6745 * stdev`.
• Standard Deviation : Volatility-sensitive, calculated as `k * stdev` of Voss over the lookback period.
• Percentile Rank : Fixed probability bands using the percentile of |Voss| (e.g., 90% means only 10% of values exceed threshold).
Settings:
• Dynamic Threshold : Toggle threshold bands and set colors.
• Threshold Mode : Select MAD, Standard Deviation, or Percentile Rank.
• Period (2-200): Lookback for threshold calculations. Default 50.
• Multiplier (k) : Scaling for MAD/Standard Deviation modes. Default 1.5.
• Percentile (%) (0-100): For Percentile Rank mode only. Default 90%.
█ LIMITATIONS
Inherent Characteristics
• Residual lag : Despite negative group delay design, some lag remains relative to price action.
• Cyclical markets required : Performs best on instruments with clear cyclical components. Strongly trending markets with little cyclicality produce less useful signals.
• Signal interpretation : Absolute Voss values are instrument-specific. Always interpret relative to adaptive threshold bands, not fixed levels.
Market Conditions to Avoid
• Sudden news events/gaps : Major discontinuities disrupt cycle continuity, causing erratic signals. Requires 1-2 full cycle periods to re-stabilize.
• Low volume/illiquid markets : Sporadic trading produces false cycles from liquidity artifacts. Use only on actively traded instruments during liquid hours.
• Regime changes : During cyclical ↔ trending transitions, watch for persistent extremes without mean reversion, increasing price/indicator divergence, or unresolved threshold breaches.
Parameter Selection Pitfalls
• Mismatched period : If Bandpass Period doesn't match actual market cycles, the filter produces weak signals. Use cycle measurement tools (FFT, autocorrelation, Dominant Cycle) to identify appropriate periods first.
• Overoptimization : Perfect historical fits typically fail forward. Choose robust parameters that work across multiple instruments and timeframes.
█ NOTES
Credits
This indicator is based on concepts from Dr. John F. Ehlers' work on predictive filters and bandpass techniques for technical analysis. Dr. Ehlers has published extensively on applying digital signal processing methods to financial markets in Technical Analysis of Stocks & Commodities (TASC) magazine. His articles on bandpass filters and predictive techniques, particularly the Voss Predictive Filter concept, provided the theoretical foundation for this implementation.
For those interested in the underlying mathematics and DSP concepts:
• Ehlers, J.F. (2001). Rocket Science for Traders: Digital Signal Processing Applications . John Wiley & Sons.
• Various TASC articles by John Ehlers on bandpass filters, cycle analysis, and predictive filtering techniques.
• Ehlers, J.F. "Voss Predictive Filter" - Technical Analysis of Stocks & Commodities magazine.
by ♚@e2e4

Ehlers DSMA by Tim D.The Deviation-Scaled Moving Average from July 2018 TASC. "In “The Deviation-Scaled Moving Average” in this issue, author John Ehlers introduces a new adaptive moving average that has the ability to rapidly adapt to volatility in price movement. The author explains that due to its design, it has minimal lag yet is able to provide considerable smoothing."

Apirine Slow RSI [LazyBear]The slow relative strength index (SRSI) indicator created by Vitali Apirine is a momentum price oscillator similar to RSI in its application and interpretation. Oscillating between 0 and 100, it generates both OB/OS signals and midline (50) cross over signals and divergences.
As author suggests, bullish/bearish divergences generated by SRSI are not as effective during strong trends. To avoid fading an established trend, the system is used in conjunction with a trend confirmation tool like ADX indicator.
You can configure the OB/OS levels, default are 70/30.
More info:
The slow relative strength index, TASC 2015-07
List of my public indicators: bit.ly
List of my app-store indicators: blog.tradingview.com

Indicator: Relative Volume Indicator & Freedom Of MovementRelative Volume Indicator
------------------------------
RVI is a support-resistance technical indicator developed by Melvin E. Dickover. Unlike many conventional support and resistance indicators, the Relative Volume Indicator takes into account price-volume behavior in order to detect the supply and demand pools. These pools are marked by "Defended Price Lines" (DPLs), also introduced by the author.
RVI is usually plotted as a histogram; its bars are highlighted (black, by default) when the volume is unusually large. According to the author, this happens if the indicator value exceeds 2.0, thus signifying that a possible DPL is present.
DPLs are horizontal lines that run across the chart at levels defined by following conditions:
* Overlapping bars: If the indicator spike (i.e., indicator is above 2.0 or a custom value)
corresponds to a price bar overlapping the previous one, the previous close can be used as the
DPL value.
* Very large bars: If the indicator spike corresponds to a price bar of a large size, use its
close price as the DPL value.
* Gapping bars: If the indicator spike corresponds to a price bar gapping from the previous bar,
the DPL value will depend on the gap size. Small gaps can be ignored: the author suggests using
the previous close as the DPL value. When the gap is big, the close of the latter bar is used
instead.
* Clustering spikes: If the indicator spikes come in clusters, use the extreme close or open
price of the bar corresponding to the last or next to last spike in cluster.
DPLs can be used as support and resistance levels. In order confirm and refine them, RVI is used along with the FreedomOfMovement indicator discussed next.
Freedom of Movement Indicator
------------------------------
FOM is a support-resistance technical indicator, also by Melvin E. Dickover. FOM is the ratio of relative effect (relative price change) to the relative effort (normalized volume), expressed in standard deviations. This value is plotted as a histogram; its bars are highlighted (black, by default( when this ratio is unusually high. These highlighted bars, or "spikes", define the positioning of the DPLs.
Suggestions for placing DPLs are the same as for the Relative Volume Indicator discussed above.
Note that clustering spikes provide the strongest DPLs while isolated spikes can be used to confirm and refine those provided by the Relative Volume Indicator. Coincidence of spikes of the two indicator can be considered a sign of greater strength of the DPL.
More info:
S&C magazine, April 2014.
I am still trying these on various instruments to understand the workings more. Don't forget to share what you learn -- any use cases / ideal scenarios / gotchas, would love to hear them all.
