PyraTime Harmonic 369Concept and Methodology PyraTime Harmonic 369 is a quantitative time-projection tool designed to apply Modular Arithmetic to market analysis. Unlike linear time indicators, this tool projects non-linear integer sequences derived from Digital Root Summation (Base-9 Reduction).
The core logic utilizes the mathematical progression of the 3-6-9 constants. By anchoring to a user-defined "Origin Pivot," the script projects three distinct harmonic triads to identify potential Temporal Confluence—moments where mathematical time cycles align with price action.
Technical Features This script focuses on the Standard Scalar (1x) projection of the Digital Root sequence:
The Root-3 Triad (Red): Projects intervals of 174, 285, 396. (Mathematical Sum: 1+7+4=12→3)
The Root-6 Triad (Green): Projects intervals of 417, 528, 639. (Mathematical Sum: 4+1+7=12→3, inverted)
The Root-9 Triad (Blue): Projects intervals of 741, 852, 963. (Mathematical Sum: 7+4+1=12→3... completion to 9)
How to Use
Set Anchor: Input the time of a significant High or Low in the settings.
Select Resolution: This tool is optimized for 1-minute (Micro-Harmonics) and 15-minute (Intraday Harmonics) charts.
Analyze Clusters: The vertical lines represent calculated harmonic intervals. Traders look for "Clusters" where a Root-3 and Root-9 cycle land on adjacent bars, indicating a high-probability pivot.
System Architecture & Version Comparison This script represents the foundational layer of the PyraTime ecosystem.
This Script (PyraTime Harmonic 369):
Scalar: Standard 1x Multiplier only.
Focus: Intraday & Micro-structure (1m, 15m).
Engine: Core Digital Root Integers.
PyraTime Harmonic Matrix (Advanced Edition):
Scalar Engine: Unlocks Quad-Fractal (4x), Tri-Fractal (3x), and Bi-Fractal (2x) multipliers for institutional cycle analysis.
Apex Logic: Auto-detection of the "963" Completion Sequence (Gold Highlight).
Event Horizon: Includes a live Predictive Dashboard that calculates the time-delta to the next harmonic event across all scalar groups.
Disclaimer This tool is for the educational analysis of Number Theory in financial markets. It projects time intervals and does not predict price direction. Past performance does not guarantee future results.
Timecycles

PyraTime Intraday Cycles**Concept and Methodology**
PyraTime Intraday Cycles is a technical analysis tool designed to introduce the concept of **Temporal Cycle Projection**. While most indicators analyze price action (Y-axis), this tool focuses exclusively on the X-axis (Time).
By anchoring to a specific "Origin Pivot" (a user-defined High or Low), the script projects harmonic time intervals into the future. These vertical vectors serve as a grid, helping traders identify moments where time-based cycles may align with price structure.
**Technical Features**
This edition is optimized for **Multi-Timeframe Harmonic Flows**, utilizing a fixed algorithm for key intervals:
* **Anchor Point Logic:** The user manually selects a significant market pivot. The script calculates forward projections from this exact timestamp.
* **Standard Rhythms:** This version renders the **5-minute**, **15-minute**, **1-hour**, and **Daily** harmonic sequences. This allows for analysis across scalping, intraday, and swing trading structures.
* **Visual Confluence:** The indicator draws vertical lines to highlight potential zones of temporal exhaustion or acceleration.
**How to Use**
1. **Identify a Pivot:** Locate a significant High or Low on the chart.
2. **Set the Origin:** Open the settings and input the date/time of that pivot.
3. **Analyze Confluence:** Watch how price behaves when it approaches a vertical line. If price hits a key support/resistance level *at the same time* it hits a PyraTime vertical line, this is considered a high-probability "Time/Price" intersection.
**Version Comparison**
This script represents the foundational layer of the Great Pyramid system (PyraTime Apex).
* **PyraTime Intraday Cycles (This Script):** Focuses on Standard Timeframes (5m, 15m, 1h, Daily).
* **GPM Architecture (Advanced):** The full methodology extends these calculations to Esoteric Sequences (33, 144, 108), includes 3x Cycle Extensions, and features a Predictive Dashboard for complex multi-timeframe analysis.
**Disclaimer**
This tool is for educational and analytical purposes only. It identifies time cycles, not price direction. Past performance of a time cycle does not guarantee future results.

Thiru Time CyclesThiru Time Cycles - Advanced Time-Based Market Analysis System
WHAT IT DOES:
Automatically identifies and visualizes trading sessions, time cycles, and market structure elements. Helps traders identify optimal entry times, track session ranges, and monitor market structure through ICT/SMC methodologies.
KEY FEATURES:
1. SESSION KILLZONES
- Asia, London, NY AM, NY PM, Lunch, Power Hour sessions
- Customizable colors, transparency, and visual styles (Filled, Outline, TopLine, SideBars)
- Real-time high/low tracking within each session
2. 90-MINUTE TIME CYCLES
- Divides major sessions into three 90-minute cycles (A/M/D phases)
- London: LO A, LO M, LO D
- NY AM: AM A, AM M, AM D
- NY PM: PM A, PM M, PM D
3. 30-MINUTE SUB-CYCLES
- Granular 30-minute breakdowns (A1-A3, M1-M3, D1-D3)
- Precise entry timing within larger cycles
4. TOI (TIME OF INTEREST) TRACKER
- London: 2:45-3:15 AM, 3:45-4:15 AM
- NY AM: 9:45-10:15 AM, 10:45-11:15 AM
- NY PM: 1:45-2:15 PM, 2:45-3:15 PM
5. TRADE SETUP TIME WINDOWS
- London: 2:30-4:00 AM
- NY AM: 9:30-10:30 AM
- NY PM: 1:30-2:30 PM
6. TOI VERTICAL LINES
- 90-minute and 30-minute cycle boundary markers
- Customizable opacity, style, and height
7. PIVOT ANALYSIS
- High/Low pivot identification per session
- Pivot midpoints
- Customizable labels with price display
- Extension options (until mitigated/past mitigation)
8. SESSION RANGE TABLE
- Real-time range display
- Average range calculation
- Color-coded active sessions
9. OPENING PRICE LINES
- Daily Chart Open, hourly opens
- Customizable session opens
10. DAY/WEEK/MONTH FILTERS
- Filter by day of week
- Current week/last 4 weeks options
- D/W/M high/low tracking
HOW TO USE:
BASIC SETUP:
1. Add indicator to chart
2. Set timezone (default: America/New_York)
3. Enable desired sessions in Killzones section
4. Customize colors and styles
FOR SESSION TRADING:
- Enable session killzones you trade
- Monitor session boxes for high/low ranges
- Use range table for current/average ranges
FOR TIME CYCLE ANALYSIS:
- Enable 90-min or 30-min cycles
- Watch price action at cycle boundaries
- Use vertical lines for cycle transitions
FOR PIVOT TRADING:
- Enable "Show Pivots" in Killzone Pivots
- Use pivots as support/resistance
- Set alerts for pivot breaks
FOR TOI TRADING:
- Enable TOI Tracker
- Monitor specific time windows
- Use for precise entry timing
UNIQUE FEATURES:
✓ Custom visual system (Filled/Outline/TopLine/SideBars box styles)
✓ Proprietary color processing functions
✓ Dual cycle system (90-min + 30-min simultaneous tracking)
✓ Integrated TOI system with vertical line visualization
✓ Smart label positioning with collision detection
✓ Comprehensive range analysis with averaging
✓ Flexible session management with custom time windows
TECHNICAL:
- Pine Script v6
- 500 max labels/lines/boxes
- Full DST-aware timezone support
- Multi-timeframe compatible
- Customizable timeframe limits
BEST PRACTICES:
- Start with session killzones, add cycles gradually
- Set appropriate timeframe limits to avoid clutter
- Use consistent colors for clarity
- Enable only sessions you actively trade
- Monitor range table for session volatility
- Set pivot break alerts for your trading sessions
Compatible with all instruments (forex, stocks, futures, crypto). Works on all timeframes, optimized for intraday trading.
For support: @thirudinesh on TradingView
© 2025 thirudinesh - Advanced Time Cycle Analysis System
Proprietary Algorithm - All Rights Reserved

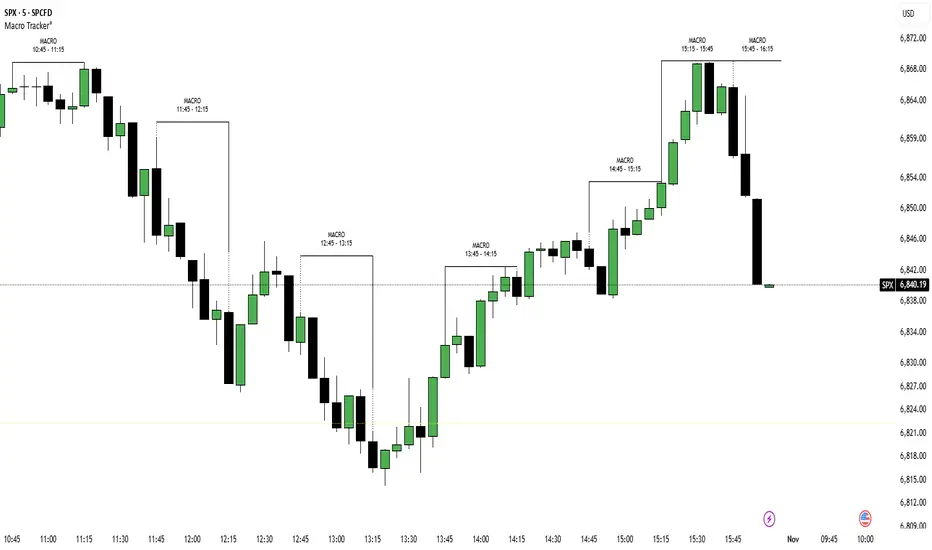
ICT Macro Tracker (xx:45-xx:15) (MTMGBS)Adjusted pinescript to reflect xx:45-xx:15 instead of the traditional xx:50-xx:15
Power of 369 [SmartFoxy]The Power of 369 Indicator detects market swing structures and overlays dynamic time-based color labeling using the 3-6-9 numeric pattern.
It highlights price turning points with summed time signatures, aligning intraday structure with temporal symmetry.
Includes OTT session filtering, automatic box plotting, ATR-based validation, and custom color control for 3, 6, 9 digit resonance.
---
## 📘 How to Use
Activate the Indicator
1. Add Magic 369 to your chart.
It works on any timeframe and market — Forex, Crypto, Indices, or Stocks.
2. Adjust the Session Duration to divide the chart into visual time blocks.
3. Use the OTT filter to show activity only during your preferred trading session.
4. Enable “Show sum of times” to display the digit sum of each candle’s time (e.g., m+m or h+h+m+m).
Combine this with “Show Swing Labels” or Market Structures to visualize both time and structure interaction.
5. Turn on “Set new colors 369” in the settings.
Each label changes its color based on the time-sum value:
3 → Orange — Accumulation;
6 → Blue — Manipulation;
9 → Purple — Distribution;
Other digits → Neutral gray.
6. Market Structure Tools:
Detects Swing Highs/Lows automatically;
Marks BoS (Break of Structure) and CHoCH (Change of Character);
Optionally validates swings using ATR deviation for confirmation.
7. Customize Visuals – Adjust label size, line style, colors, and opacity to match your chart theme.
8. Interpretation – Use the 3-6-9 patterns to identify time-based energy shifts in market flow —
3 initiates accumulation, 6 signals manipulation, and 9 completes distribution. Together, they reveal the rhythm behind structural price movements.
---
## ⚙️ Settings Overview
🕓 Session Settings:
Show Boxes Session – enables time-block boxes on chart.
Session Duration – defines how many bars each session lasts.
Show only at OTT – displays sessions only during your chosen trading hours (e.g., 16:30–22:00).
Boxes Drawing Limit – limits the maximum number of boxes drawn on the chart.
🔢 3-6-9 Color Logic
Set new colors 369 – activates unique colors based on the time-sum digit.
/3, /6, /9, /others – customize colors for each digit group:
3 → Accumulation;
6 → Manipulation;
9 → Distribution;
others → Neutral.
🧭 Labels
Show Swings Labels – toggles display of H/L, HH/HL/LL/LH, or symbol ◆.
Show sum of times – displays digit-sum values next to swing labels.
Type of Sum – choose between:
m+m → uses minute sum only
h+h+m+m → uses hour + minute sum combined
Label Size – adjusts label text size.
📈 Market Structure (𝓜𝓢)
Show Market Structures – enables structure detection and visualization.
Show 𝓜𝓢 Validation (ATR) – confirms structure strength using ATR-based deviation logic.
Show 𝓜𝓢 Labels – shows BoS and CHoCH labels directly on the chart.
Show Levels – draws support/resistance levels from recent structures.
Colors – separate settings for bullish and bearish structures.

Sessions [New_ProfitEfex]This script is use for displaying session in a very attractive an clarity way
You can give it a try for free

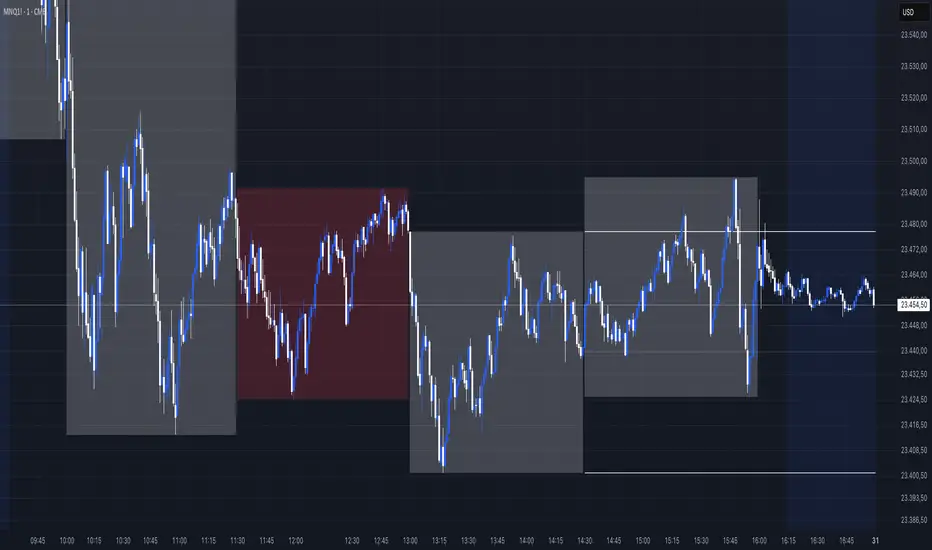
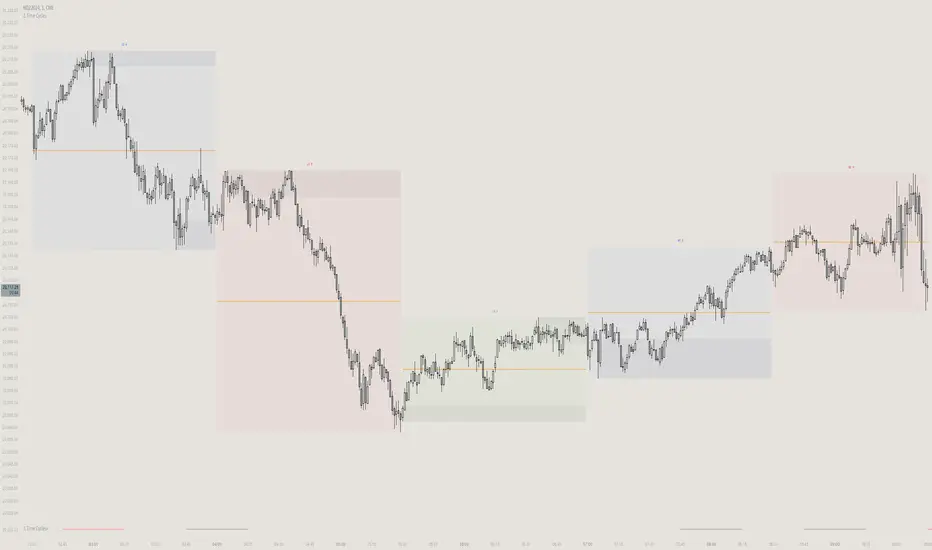
NY Time Cycles# New York Time Cycles Indicator
## Overview
The Time Cycles indicator is a specialized technical analysis tool designed to divide the trading day into distinct time blocks based on New York trading hours. Developed for TradingView, this indicator helps traders identify and analyze market behavior during specific time periods throughout the trading session. The indicator displays six consecutive time blocks, each representing 90-minute segments of the trading day, while tracking price ranges within each block.
## Core Concept
The Time Cycles indicator is built on the premise that different periods during the trading day often exhibit unique market characteristics and behaviors. By segmenting the trading day into standardized 90-minute blocks, traders can:
1. Identify recurring patterns at specific times of day
2. Compare price action across different time blocks
3. Recognize potential support and resistance levels based on the high and low of previous time blocks
4. Develop time-based trading strategies specific to certain market hours
## Time Block Structure
The indicator divides the trading day into six sequential 90-minute blocks based on New York time:
1. **Box 1**: 07:00 - 08:30 ET
2. **Box 2**: 08:30 - 10:00 ET
3. **Box 3**: 10:00 - 11:30 ET
4. **Box 4**: 11:30 - 13:00 ET
5. **Box 5**: 13:00 - 14:30 ET
6. **Box 6**: 14:30 - 16:00 ET
These time blocks cover the core US trading session from pre-market into regular market hours.
## Visual Representation
Each time block is represented on the chart as a visual box that:
- Spans the exact time period of the block (horizontally)
- Extends from the highest high to the lowest low recorded during that time period (vertically)
- Is displayed with customizable colors and transparency levels
- Automatically builds in real-time as price action develops
Additionally, the indicator draws dashed projection lines that:
- Display the high and low of the most recently completed time block
- Extend forward in time (for up to 24 hours)
- Help traders identify potential support and resistance levels
## Technical Implementation
The indicator employs several key technical features:
1. **Time Detection**: Accurately identifies the current New York time to place each box in the correct time period
2. **Dynamic Box Creation**: Initializes and updates boxes in real-time as price action develops
3. **Range Tracking**: Continuously monitors and adjusts the high and low of each active time block
4. **Projection Lines**: Creates horizontal dashed lines projecting the high and low of the most recently completed time block
5. **Daily Reset**: Automatically resets all boxes and lines at the start of each new trading day
6. **Customization**: Allows users to set custom colors and transparency levels for each time block
This Time Cycles indicator provides traders with a structured framework for analyzing intraday market movements based on specific time periods. By understanding how the market typically behaves during each 90-minute block, traders can develop more targeted strategies and potentially identify higher-probability trading opportunities throughout the trading day.
Timeframe Marker - know when timeframes start/end
When you're on a lower timeframe, it's important to know which timeframes are starting/ending.
Timeframe Marker will display a bars that stack notifying you of your chosen timeframes.
For example, if you're on the one minute chart or another low timeframe, you'll be aware of the larger timeframes are about to begin or start.
It's always good to select the lowest timeframe first in ascending order so that the lowest bar is the lowest timeframe and bars that stack on top are larger timeframes.
The default timeframes are:
• 5 minutes (green)
• 15 minutes (yellow)
• 1 hour (orange)
• 4 hour (red)
• daily (blue)
• weekly (purple)
• monthly (gray)
If your chart's timeframe is higher than the timeframe marker you've selected, then it won't display a bar stack for that timeframe as it would normally display on every bar (this is to avoid clutter).
The future timeframe marks basically will offset to future timeframes. Set how many bars forward you'd like to see.

itradesize /\ Time Cycles x Zeussy supplementaryThis is a supplementary script to my previous itradesize /\ Time Cycles x Zeussy script. It should be displayed in a new pane.
This script will display the 30 and 90 AMD Time Cycles, along with the Asia, London, and New York AM & PM sessions in a new pane, based on the times taught by Zeussy.
You have the option to customize which cycles you would like to display, as well as the arrangement of the cycles based on the location of the pane (above or below the current chart).
The script can also be used for backtesting; just uncheck the 'Draw Today's Only' option.
Session timings are as follows:
Asia: 20:00 - 00:00
London: 02:30 - 07:00
NY AM: 07:00 - 11:30
NY PM: 11:30 - 16:00
London Cycles:
- 02:30 - 04:00
- 04:00 - 05:30
- 05:30 - 07:00
AM Cycles:
- 07:00 - 08:30
- 08:30 - 10:00
- 10:00 - 11:30
PM Cycles:
- 11:30 - 13:00
- 13:00 - 14:30
- 14:30 - 16:00
itradesize /\ Time Cycles x ZeussyI created this script based on Zeussy's & TOTK time cycle tweets.
The base 90-minute cycle starts at 2:30 AM NY time. For the best outcome, trade only during the New York AM & PM cycles. If you are a London trader, use mainly the Asian high and low instead of those 90-minute cycles as the algorithm mostly refers to them instead of the 90M cycles high or low.
In the current time cycle, we use the high and low of the previous cycle(s) to determine order flow.
During the current time cycle, IPDA refers to the previous cycle(s) as high or low. How the price reacts to these price levels is crucial for measuring order flow.
Every turning point in the market is timed and predetermined beforehand. The importance of timing can be seen by glancing at the history of the charts.
To measure order flow, we look for the following signs of reversal or continuation:
- If the price was bullish but does not find support at the previous cycle's high after breaking above it, it is the first warning sign that the order flow is potentially changing.
- If the price was bearish but does not find resistance at the previous cycle's low after breaking below it, it is the first warning sign that the order flow is potentially changing.
- If the price is bullish, then it should find support at the previous cycle's high after breaking above it.
- If the price is bearish, then it should find support at the previous cycle's low after breaking below it.
Each cycle has its Accumulation , Manipulation , and Distribution (AMD) characteristics within the larger sessions.
Even smaller cycles have these characteristics too. You can divide them further or add them up to get a more complex picture.
The indicator primarily shows the 90-minute cycles, but you can also view the multiples of 90-minute cycles to get a higher 270-minute picture. You can even divide them further into 30-minute cycles. (These 30-minute cycles can also be divided into 10-minute cycles.)
The AM sessions are from:
- 07:00 - 8:30
- 8:30 - 10:00
- 10:00 - 11:30
The PM sessions are from:
- 11:30 - 13:00
- 13:00 - 14:30
- 14:30 - 16:00
Regarding the features of the indicator, you can show the cycles as dividers or use boxes to highlight them.
The indicator also comes with a pivot high & low for the 90-minute cycles, which means the script automatically lengthens the high or low of the former 90-minute cycle until it's taken. If it has not been taken until the 90-minute cycle ends, it stops drawing.

Time Cycles IndicatorThis script is used to analyze the seasonality of any asset (commodities, stocks, indices).
To use the script select a timeframe D or W and select the months you are interested in the script settings. You will see all the candles that are part of those months highlighted in the chart.
You can use this script to understand if assets have a cyclical behavior in certain months of the year.

Market Time Cycle (Expo)█ Time Cycles Overview
Time cycles are a fascinating and powerful concept in the world of trading and investing. They are all about understanding and predicting the timing of market moves based on the premise that market events and price movements are not random, but instead occur in repeatable, cyclical patterns.
The Concept of Time Cycles: The foundation of time cycles lies in the belief that historical market patterns tend to repeat themselves over specific periods. These periods or cycles could be influenced by a myriad of factors like economic data releases, earnings reports, geopolitical events, or even natural human behavior. For example, some traders observe increased market activity around the start and end of a trading day, which is a form of intraday time cycle.
Understanding time cycles can provide traders with a roadmap, helping them anticipate potential trend shifts and make more informed decisions about when to buy or sell.
█ Indicator Overview
The Market Time Cycle (Expo) is designed to help traders track and analyze market cycles and generate signals for potential trading opportunities. It uses mathematical techniques to analyze market cycles and detect possible turning points. It does this by projecting the estimated cycle timeline and providing visual indications of cyclical phases through the use of color-coded lines and sine wave cycles.
Time cycles offer a compelling way to forecast market trends and time your trades better. By adding time cycles to your trading toolbox, you could potentially gain a new perspective on market movements and refine your trading strategy further. The indicator generates trading signals based on the sine wave's behavior. When the sine wave crosses certain thresholds, the indicator generates a signal suggesting a potential trading opportunity based on cycle behavior.
█ How to use
This indicator can be a valuable tool to help traders understand and predict market trends and time their trades more accurately. By visualizing the cyclic nature of markets, traders can better anticipate potential turning points and adjust their trading strategies accordingly. It helps traders to spot ideal entry and exit points based on the cyclical nature of financial markets.
█ Settings
You can customize the number of bars (NumbOfBars) that are taken into consideration for the cycle. Including a higher number of bars will provide more data, which can be helpful for analyzing long-term trends.
-----------------
Disclaimer
The information contained in my Scripts/Indicators/Ideas/Algos/Systems does not constitute financial advice or a solicitation to buy or sell any securities of any type. I will not accept liability for any loss or damage, including without limitation any loss of profit, which may arise directly or indirectly from the use of or reliance on such information.
All investments involve risk, and the past performance of a security, industry, sector, market, financial product, trading strategy, backtest, or individual's trading does not guarantee future results or returns. Investors are fully responsible for any investment decisions they make. Such decisions should be based solely on an evaluation of their financial circumstances, investment objectives, risk tolerance, and liquidity needs.
My Scripts/Indicators/Ideas/Algos/Systems are only for educational purposes!

timing marketIntraday time cycle . it is valid for nifty and banknifty .just add this on daily basis . ignore previous day data

Highlight Trading Window (Simple Hours / Time of Day Filter)As the name says this is a straightforward way to highlight the times of day that you are interested in studying.
Like to trade just a market open, or highlight a full session?
Could also be used negatively to "block out" a window of time each day.
Usage:
Just set your preferred time zone and then your time window (start and end).
Hope you find it useful! 😁

⚛WPZO - Wave Period Zone Oscillator by Cryptorhythms⚛WPZO - Wave Period Zone Oscillator by Cryptorhythms
Intro
Based upon Akram El Sherbini's article "Time Cycle Oscillators" published in IFTA journal 2018.
Companion indicator to the Wave Period Oscillator, this is simply a transformation to display in a familiar manner like an RSI. Occasionally WPO can exceed the upper and lower boundary lines in strong moves. With WPZO, it will never go below -80 or above +80.
Description
In the Authors words....
"The wave period zone oscillator (WPZO) is a bounded oscillator for the wave period oscillator (WPO) and calculates the period of the market’s cycle. In other words, the wave period refers to the time taken by buyers or sellers to complete one cycle. The oscillator moves within a range of -100 to 100 percent.
The WPZO has overbought and oversold levels at +40 and -40 respectively. At extreme periods, the oscillator may reach the levels of +60 and -60. The zero level demonstrates an equilibrium between the periods of bulls and bears. The WPZO oscillates between +40 and -40. The crossover at those levels creates buy and sell signals. In an uptrend, the WPZO fluctuates between 0 and +40 where the bulls are controlling the market.
On the contrary, the WPZO fluctuates between 0 and -40 during downtrends where the bears control the market. Reaching the extreme level of -60 in an uptrend is a sign of weakness. Mostly, the oscillator will retrace from its centerline rather than the upper boundary of +40. On the other hand, reaching +60 in a downtrend is a sign of strength, and the oscillator will not be able to reach its lower boundary of -40.
During an ideal uptrend, the WPZO does not reach the lower boundary of -40 and usually rebounds from a higher level than -40. This means that the bulls have taken control earlier. Hence, a zeroline crossover generates a buy signal. The WPZO crosses the upper boundary at +40, then pulls back again below +40 to generate a sell signal. During sideways, the WPZO fluctuates between the lower and upper boundaries of -40 and +40. This tactic is also used in an uptrend where corrections are strong enough to drive the WPZO line below the lower boundary. During downtrends, the WPZO fails to reach the upper boundary and oscillates between the 0 and -40 levels.
The bears enter early, indicating an obvious weakness in the market. Therefore, crossing the zero level generates a sell signal. The exit at weakness tactic is used during uptrend reversals and downtrends. The WPZO oscillates between the centerline and the lower boundary of -40. The bears are controlling the market and move in wide cycle periods, while the bull’s strength is almost absent. An exit signal is triggered once the WPZO crosses -40. When prices decline, the WPZO may cross its extreme lower boundary at -60. Therefore, a swift exit signal is triggered once the WPZO crosses -40.
The WPZO gives an insight about the relation between time and price movements. In this article, we used the oscillator to differentiate between the time taken by bulls and bears to complete one cycle. Due to the boundaries effect, the WPZO may diverge less than the WPO with prices."
TL:DR
More strategy discussed above, but heres the short version:
Bullish signals are generated when WPZO crosses over 0
Bearish signals are generated when WPZO crosses under 0
OverBought level is 40
OverSold level is -40
ExtremeOB level is 60
ExtremeOS level is -60
👍 Enjoying this indicator or find it useful? Please give me a like and follow! I post crypto analysis, price action strategies and free indicators regularly.
💬 Questions? Comments? Want to get access to an entire suite of proven trading indicators? Come visit us on telegram and chat, or just soak up some knowledge. We make timely posts about the market, news, and strategy everyday. Our community isn't open only to subscribers - everyone is welcome to join.
For Trialers & Chat: t.me

⚛WPO - Wave Period Oscillator by Cryptorhythms⚛WPO - Wave Period Oscillator by Cryptorhythms
Intro
The indicator is based on Akram El Sherbini's article "Time Cycle Oscillators" published in IFTA journal 2018. The third in a series of 4 time cycle indicators I will be publishing.
The WPO is a short-term oscillator that measures the buying and selling period of price cycles over a certain time interval. The leading oscillator indicates a rise in buying period when it moves above the zero line and a rise in selling period when it moves below the zero line.
Description
Centerline Crossover: A bullish centerline crossover occurs when the WPO line moves above the zero level to turn positive. A bearish centerline crossover occurs when the WPO line moves below the zero level to turn negative. When bulls are in control, the price rally begins and the average of the bull’s period T increases to drive the WPO line above the centerline. A buy signal is subsequently triggered. When the bulls start to loose power, prices move sideways and the average period decreases. In this case, the WPO line may flutter near the centerline and cause false signals, whipsaws. To avoid the whipsaws occurring on the centerline, the following trading tactics are proposed.
TL:DR
Bullish signals are generated when WPO crosses over 0
Bearish signals are generated when WPO crosses under 0
OverBought level is 2
OverSold level is -2
ExtremeOB level is 2.7
ExtremeOS level is -2.7
👍 Enjoying this indicator or find it useful? Please give me a like and follow! I post crypto analysis, price action strategies and free indicators regularly.
💬 Questions? Comments? Want to get access to an entire suite of proven trading indicators? Come visit us on telegram and chat, or just soak up some knowledge. We make timely posts about the market, news, and strategy everyday. Our community isn't open only to subscribers - everyone is welcome to join.
For Trialers & Chat: t.me

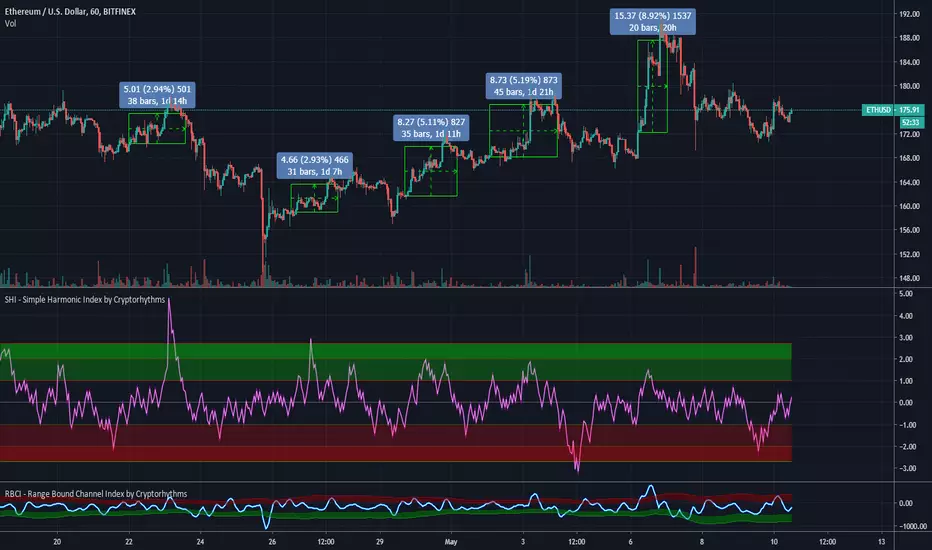
🆓 SHI - Simple Harmonic Index by Cryptorhythms🆓 SHI - Simple Harmonic Index by Cryptorhythms
Intro
The indicator is based on Akram El Sherbini's article "Time Cycle Oscillators" published in IFTA journal 2018.
The simple harmonic index (SHI) is based on the derivations of the simple harmonic equation.
Description
The trading tactic used for the simple harmonic index is merely the centerline crossover. A buy signal is generated when the SHI line moves above the zero level to turn positive. The period of the bull cycle rises, leading to an increase in price displacement. A sell signal is generated when the SHI line crosses down the centerline to turn negative.
Alternately I provided overbought and oversold zones. With these you can use the signal line reentry to the channel as an entry or exit signal. Just keep in mind if you enter a position based on this rules and the signal line goes back into OB/OS area, you should exit as it maybe a false entry.
What I would recommend is using the 0 crossover strategy, and the OB/OS zones as potential turnaround areas.
TL:DR
Bullish signals are generated when SHI crosses over 0
Bearish signals are generated when SHI crosses under 0
I put a few example trades up on the chart.
👍 Enjoying this indicator or find it useful? Please give me a like and follow! I post crypto analysis, price action strategies and free indicators regularly.
💬 Questions? Comments? Want to get access to an entire suite of proven trading indicators? Come visit us on telegram and chat, or just soak up some knowledge. We make timely posts about the market, news, and strategy everyday. Our community isn't open only to subscribers - everyone is welcome to join.
For Trialers & Chat: t.me