Trend Analysis
Liquidity Sweep Breakout - LSBLiquidity Sweep Breakout - LSB
A professional session-based breakout system designed for OANDA:USDJPY and other JPY pairs.
Not guesswork, but precision - built on detailed observation of institutional moves to capture clear trade direction daily.
Master the Market’s Daily Bank Flow.
---
Strategy Detail:
I discovered this strategy after carefully studying how Japanese banks influence the forex market during their daily settlement period. Banks are some of the biggest players in the financial world, and when they adjust or settle their accounts in the morning, it often creates a push in the market. From years of observation, I noticed a consistent pattern, once banks finish their settlements, the market usually continues moving in the same direction that was formed right after those actions. This daily banking flow often sets the tone for the entire trading session, especially for JPY pairs like USDJPY.
To capture this move, I built the indicator so that it follows the bank-driven trend with clear rules for entries, stop-loss (SL), and take-profit (TP). The system is designed with professional risk management in mind. By default, it assumes a $10,000 account size, risks only 1% of that balance per trade, and targets a 1:1.5 reward-to-risk ratio. This means for every $100 risked, the potential profit is $150. Such controlled risk makes the system safer and more sustainable for long-term traders. At the same time, users are not limited to this setup, they can adjust the account balance in the settings, and the indicator will automatically recalculate the lot size and risk levels based on their own capital. This ensures the strategy works for small accounts and larger accounts alike.
🌍 Why It Works
Fundamentally driven: Based on **daily Japanese banking settlement flows**.
Session-specific precision: Targets the exact window when USDJPY liquidity reshapes.
Risk-managed: Always calculates lot size based on account and risk preferences.
Automatable: With webhook + MT5 EA, it can be fully hands-free.
---
✅ Recommended
Pair: USDJPY (best observed behavior).
Timeframe: 3-Minute chart.
Platform: TradingView Premium (for webhooks).
Execution: MT5 via EA.
---
🔎 Strategy Concept
The Tokyo Magic Breakout (TMB) is built on years of session observation and the unique daily rhythm of the Japanese banking system.
Every morning between 5:50 AM – 6:10 AM PKT (09:50 – 10:10 JST), Japanese banks perform daily reconciliation and settlement. This often sets the tone for the USDJPY direction of the day.
This strategy isolates that critical moment of liquidity adjustment and waits for a clean breakout confirmation. Instead of chasing noise, it executes only when price action is aligned with the Tokyo market’s hidden flows.
---
🕒 Timing Logic
Session Start: 5:00 AM PKT (Tokyo market open range).
Magic Candle: The 5:54 AM PKT candle is marked as the reference “breakout selector.”
Checkpoints: First confirmation at 6:30 AM PKT, then every 15 minutes until 8:30 AM PKT.
* If price stays inside the magic range → wait.
* If a breakout happens but the candle wick touches the range → wait for the next checkpoint.
* If by 8:30 AM PKT no clean breakout occurs → the day is marked as No Trade Day (NTD).
👉 Recommended timeframe: 3-Minute chart (3M) for precise signals.
---
📈 Trade Execution
Entry: Clean break above/below the magic candle’s range.
Stop-Loss: Opposite side of the Tokyo session high/low.
Take-Profit: Calculated by Reward\:Risk ratio (default 1.5:1).
Lot Size: Auto-calculated based on your risk model:
* Fixed Dollar
* % of Equity
* Conservative (minimum of both).
Visuals include:
✅ Entry/SL/TP lines
✅ Shaded risk (red) and reward (green) zones
✅ Trade labels (Buy/Sell with lot size & levels)
✅ TP/SL hit markers
---
🔔 Alerts & Automation (AutoTMB)
This strategy is fully automation-ready with EA + MT5:
1. Enable alerts in TMB settings.
2. Insert your PineConnector License Key.
3. Configure your risk management preferences.
4. Create a TradingView alert → in the message box simply type:
Pine Script®
{{alert_message}}
and set the EA webhook.
Now, every breakout trade (with exact entry, SL, TP, and lot size) is sent instantly.
👉 On your MT5:
* Install the EA.
* Use the same license key.
* Run it on a VPS or local MT5 terminal.
You now have a hands-free trading system: AutoTMB.


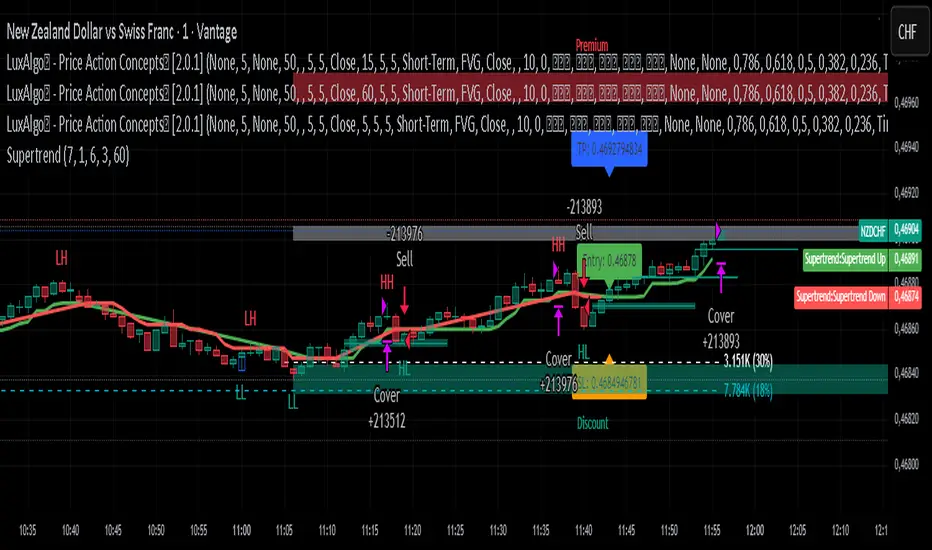
HMK-2 | PCA-1 + Rejim + Chebyshev + VWAP (Input'lu, v6)📌 HMK-2 | PCA-1 + Regime + Chebyshev + VWAP Strategy
1️⃣ Core Structure
Instead of relying on a single indicator, this system uses the Z-Score normalized average of three oscillators (RSI, MFI, ROC).
Signal (PCA-1):
RSI(14), MFI(14), ROC(5) → each is converted into a z-score.
Their average becomes the “composite signal,” our PCA-1 value.
Trend direction: If the Z-score EMA is rising → trend UP. If falling → trend DOWN.
2️⃣ Side Filters
Regime Filter (ADX + EMA)
ADX is calculated manually.
If ADX > 20 → trend exists → a 50-period EMA of this value smooths it.
This turns “trend regime” into a probability between 0–1.
Chebyshev Filter
A return series is checked against mean ± k*sigma bands.
If the return is within this band → valid signal. Extreme moves are filtered out.
VWAP Filter
Long trades: price must be above VWAP.
Short trades: price must be below VWAP.
Trades are only taken on the correct side of institutional cost averages.
3️⃣ Entry Conditions
Long:
PCA-1 signal crosses above threshold.
Trend Up + Regime OK + Chebyshev OK + Above VWAP.
Short:
PCA-1 signal crosses below threshold.
Trend Down + Regime OK + Chebyshev OK + Below VWAP.
4️⃣ Exit Mechanism
Main Exit: ATR-based stop/target.
Stop = entry price – ATR × (SL factor).
Take profit = entry price + ATR × (TP factor).
Additional Exit:
If price crosses to the opposite side of VWAP.
If PCA-1 signal crosses zero.
👉 Prevents trades from being locked, makes exits adaptive.
5️⃣ Labels / Visualization
AL / SHORT → entry points.
SAT / COVER → exit points.
VWAP line plotted in blue.
🧩 Strategy Features
Optimizable parameters:
Z-window (zWin)
Threshold
Chebyshev factor
ATR stop/target multipliers
This system works with:
Disciplined core (PCA-1 signal)
Triple protection (Regime + Chebyshev + VWAP)
Adaptive exits (ATR + VWAP/signal cross)
👉 Not a “single-indicator robot,” but a multi-filtered trade direction engine.
💡 Final Note
This is a base model of the system — open for further development.
I’ve shared the logic to give you a roadmap.
If you spot errors, fix them → that’s how you’ll improve it.
Don’t waste time asking me questions — refine and build it better yourselves.
Wishing you profitable trades. Stay well 🙏

Script_Algo - High Low Range MA Crossover Strategy🎯 Core Concept
This strategy uses modified moving averages crossover, built on maximum and minimum prices, to determine entry and exit points in the market. A key advantage of this strategy is that it avoids most false signals in trendless conditions, which is characteristic of traditional moving average crossover strategies. This makes it possible to improve the risk/reward ratio and, consequently, the strategy's profitability.
📊 How the Strategy Works
Main Mechanism
The strategy builds 4 moving averages:
Two senior MAs (on high and low) with a longer period
Two junior MAs (on high and low) with a shorter period
Buy signal 🟢: when the junior MA of lows crosses above the senior MA of highs
Sell signal 🔴: when the junior MA of highs crosses below the senior MA of lows
As seen on the chart, it was potentially possible to make 9X on the WIFUSDT cryptocurrency pair in just a year and a half. However, be careful—such results may not necessarily be repeated in the future.
Special Feature
Position closing priority ❗: if an opposite signal arrives while a position is open, the strategy first closes the current position and only then opens a new one
⚙️ Indicator Settings
Available Moving Average Types
EMA - Exponential MA
SMA - Simple MA
SSMA - Smoothed MA
WMA - Weighted MA
VWMA - Volume Weighted MA
RMA - Adaptive MA
DEMA - Double EMA
TEMA - Triple EMA
Adjustable Parameters
Senior MA Length - period for long-term moving averages
Junior MA Length - period for short-term moving averages
✅ Advantages of the Strategy
🛡️ False Signal Protection - using two pairs of modified MAs reduces the number of false entries
🔄 Configuration Flexibility - ability to choose MA type and calculation periods
⚡ Automatic Switching - the strategy automatically closes the current position when receiving an opposite signal
📈 Visual Clarity - all MAs are displayed on the chart in different colors
⚠️ Disadvantages and Risks
📉 Signal Lag - like all MA-based strategies, it may provide delayed signals during sharp movements
🔁 Frequent Switching - in sideways markets, it may lead to multiple consecutive position openings/closings
📊 Requires Optimization - optimal parameters need to be selected for different instruments and timeframes
💡 Usage Recommendations
Backtest - test the strategy's performance on historical data
Optimize Parameters - select MA periods suitable for the specific trading instrument
Use Filters - add additional filters to confirm signals
Manage Risks - always use stop-loss and take-profit orders.
You can safely connect to the exchange via webhook and enjoy trading.
Good luck and profits to everyone!!

EMA Crossover StrategyAs the name suggests. It is an EMA crossover with a custom buy, sell signal on the chart with the take profit signal on the chart itself. SL would be the original candle low on the candle where the buy sell signal is generated. kindly give a feedback on the script so i can update it.

MTF RSI + ADX + ATR SL/TP vivekDescription:
This strategy combines the power of multi-timeframe RSI filtering with ADX trend confirmation and ATR-based risk management to capture strong directional moves.
🔑 Entry Rules:
• Daily RSI > 60
• 4H RSI > 60
• 1H RSI > 60
• 10m RSI > 40
• ADX (current timeframe) > 20
When all conditions align, a long entry is triggered.
🛡 Risk Management:
• ATR-based Stop-Loss (customizable multiplier)
• Take-Profit defined as a Risk-Reward multiple of the ATR stop
🎯 Why this Strategy?
• Ensures alignment across higher timeframes before entering a trade
• Uses ADX to avoid choppy/range-bound markets
• Built-in ATR stop-loss & take-profit for disciplined risk control
• Fully customizable parameters
This strategy is designed for trend-following swing entries. It works best on liquid instruments such as indices, forex pairs, and large-cap stocks. Always optimize the parameters based on your preferred asset and timeframe.

MTF RSI + ADX + ATR SL/TPThis strategy combines the power of multi-timeframe RSI filtering with ADX trend confirmation and ATR-based risk management to capture strong directional moves.
🔑 Entry Rules:
• Daily RSI > 60
• 4H RSI > 60
• 1H RSI > 60
• 10m RSI > 40
• ADX (current timeframe) > 20
When all conditions align, a long entry is triggered.
🛡 Risk Management:
• ATR-based Stop-Loss (customizable multiplier)
• Take-Profit defined as a Risk-Reward multiple of the ATR stop
🎯 Why this Strategy?
• Ensures alignment across higher timeframes before entering a trade
• Uses ADX to avoid choppy/range-bound markets
• Built-in ATR stop-loss & take-profit for disciplined risk control
• Fully customizable parameters
This strategy is designed for trend-following swing entries. It works best on liquid instruments such as indices, forex pairs, and large-cap stocks. Always optimize the parameters based on your preferred asset and timeframe.

Imbalance No SL📊 Strategy Name: Imbalance No SL
This strategy specially trades on price jumps (true imbalances) in the market, takes advantage of momentum only, and as soon as the opposite signal and profit is received, the trade is closed immediately.
Imbalance No SL strategy specially generates buy and sell signals based on "Imbalance" logic, without any fixed Stop Loss.
🔍 Core Logic
Imbalance Detection
Bullish Imbalance : When the low of the current candle is above the high of the previous candle.
(i.e. a jump type gap occurred in the market – demand is high, price went straight up)
Bearish Imbalance : When the high of the current candle is below the low of the previous candle.
(i.e. the market suddenly fell down)
Creating Visual Box and Label on Signal:
As soon as bullish imbalance is found, green box & IMB BULL label is displayed on the chart.
Bearish has red box & IMB BEAR label.
Trade Entry Logic
BUY on Bullish Imbalance: If there is already a buy or neutral position, then a new “BUY” signal will fire.
SELL on Bearish Imbalance: If already in sell or neutral position, then new “SELL” signal will fire.
You can set quantity/lot size from ‘qty’ input field.
Trade Average Calculation
Buy/Sell maintains average price and their count (so that if averaging is done then correct P&L is calculated).
Trade Exit Logic (Profit Booking/Signal Reverse)
If your buy is going on and bearish imbalance is formed + price is above your average, then buy will be closed (profit condition).
If sell is going on and bullish imbalance is formed + price is below average, then sell will be closed.
Chart Cleaning/Management
Only keep the label and box of the latest signal on the chart, old boxes/labels are automatically deleted.
Alert
You can get alert on bullish or bearish signal (by using alert feature of TradingView).
✅ Simple Explanation for User
This strategy buys or sells directly at the gap (imbalance).
Whenever there is a clear signal of momentum in the market (breakout of the gap), then the trade entry takes place.
When there is an imbalance in the opposite direction and profit is made, the system closes the trade (closes).
There is no fixed stop-loss, risk management is handled by trade averaging/close.
You will know at every point on the visually chart that at which bar the buy, sell and exit took place.
⚠️ What to remember?
If the market is in trend then this script gives very good signals.
In choppy/sideways market, some loss trades can also come because there is no SL.
Big profit or big loss – both depend on the imbalance signal and market speed.

BDNS ORB Strategy v3BDNS Opening Range Breakout Strategy
What This Strategy Does This strategy implements an Opening Range Breakout (ORB) system that identifies the high and low prices during a customizable opening period, then trades breakouts above or below these levels with momentum confirmation. The strategy goes beyond basic ORB concepts by incorporating ADX momentum filtering, VWAP directional bias, dynamic position sizing, and sophisticated exit management including breakeven moves and trailing stops.
Core Strategy Logic
Opening Range Definition: The strategy tracks price action during a user-defined opening period (default: 9:30-9:35 AM ET for 5 minutes). During this time, blue horizontal lines appear marking the session high and low. A yellow background highlights this opening range period.
Breakout Detection: After the opening range completes, green and red horizontal lines appear showing the actual entry levels - these are offset from the range boundaries by a configurable number of ticks (default: 24 ticks) to filter out false breakouts and ensure committed moves.
Entry Conditions: Trades trigger when price breaks through these offset levels during the trading window (green background, default until 10:30 AM ET), but only when:
ADX momentum indicator exceeds threshold (default 24.0) in the breakout direction
Price relationship to VWAP confirms directional bias (when VWAP filter enabled)
Daily trade limits haven't been reached
Large range filtering conditions are met
Visual Elements and Usage
Range Lines: Blue lines show the actual opening range boundaries. These appear immediately when the opening session begins.
Entry Levels: Green (long) and red (short) lines show where trades will trigger, appearing after the opening range completes.
Information Table: A data table appears in the top-right showing real-time strategy status including range size in ticks, ADX readings, filter status, trade counts, and momentum conditions.
Position Management:
When in a trade, colored circles appear showing:
Lime circles: Long position targets (T1, T2, T3)
Orange circles: Short position targets
Red circles: Stop loss levels
Blue crosses: Breakeven levels (when that feature activates)
Purple lines: Trailing stop levels (when position 3 trailing activates)
Background Colors:
Yellow: Opening range session active
Green: Trading window active
Purple: Large range day detected
Gray: Large range day being skipped
Position Management System
The strategy uses a three-tier exit approach:
Position 1: Takes partial profits at first target (default 50% of range size)
Position 2: Exits at second target (default 100% of range size)
Position 3: Either exits at third target or uses trailing stop after Position 2 wins
Breakeven Feature: When enabled and price reaches the breakeven trigger level, all stop losses move to a more favorable breakeven level instead of the original stop, protecting against giving back profits.
Trailing Stop System: After Position 2 hits its target, Position 3 automatically switches to a trailing stop that moves in the trader's favor as price continues trending.
Customization for Different Instruments
The default settings are configured for MNQ (Micro NASDAQ futures) but the ORB concept is highly customizable for any futures instrument and timeframe. Range duration, breakout offsets, and filter thresholds should be adjusted based on the specific instrument's volatility characteristics and typical intraday patterns.
Filter Usage Guidelines
ADX Momentum Filter: Essential for avoiding breakouts during consolidation. Higher thresholds (30+) for trending markets, lower (20-25) for more opportunities.
VWAP Filter: Helpful in trending conditions but may reduce trade frequency. Better to disable during range-bound or mean-reverting periods.
Large Range Filter: Critical risk management tool. When the opening range exceeds your threshold:
Skip: Avoids trades when stops would be too large
Fade: Trades mean reversion back into the range
Trade: Takes breakouts regardless (higher risk)
Range Size Considerations: Setting a large range threshold (200-400 ticks) helps avoid days when both sides of the range get tested before any meaningful breakout occurs, which often leads to whipsaws.
Risk Management Features
Dynamic Stops and Targets: All exit levels scale with the opening range size, ensuring risk/reward remains consistent regardless of daily volatility. A 100-tick range day will have proportionally smaller stops than a 300-tick range day.
Position Sizing: Configure contract amounts for each position tier based on account size and risk tolerance.
Daily Trade Limits: Prevents overtrading by limiting trades per direction per day.
Breakout Offset: The tick offset from range boundaries is crucial - too small creates false signals, too large misses good moves. Test different values based on your instrument's typical noise levels.
Advanced Features
Large Third Target: Set Target 3 to 300-500% to essentially hold runners indefinitely, using the trailing stop as the primary exit method for capturing extended trends.
Fade Trading: On large range days, the strategy can trade mean reversion when initial breakouts fail, often providing good counter-trend opportunities.
Time-Based Exits: All positions close at the end of the trading window, preventing overnight risk.
Strategy Properties Used
Initial Capital: $5,000 (realistic for micro contract trading)
Commission: $0.50 per contract (realistic retail rates)
Position Size: 100% of equity (manages risk through contract quantities and stop placement)
Default quantities: 3/1/1 contracts across the three positions
The default settings assume larger account sizes or proprietary trading firm accounts where higher risk tolerance is acceptable. With MNQ at $0.50 per tick, a typical 200-tick opening range with 75% stop loss (150 ticks) would risk $375 on a 5-contract position. For smaller retail accounts, consider reducing position sizes significantly - using only Position 1 (3 contracts) would risk $225, or even reducing to 1-2 total contracts to maintain appropriate risk levels relative to account size.
Getting Started Apply the strategy to your preferred instrument
Adjust the opening range time and duration for your market
Set appropriate breakout offset based on typical noise levels
Configure large range threshold based on your risk tolerance
Test filter combinations to find what works best for your trading style
Adjust contract quantities based on your account size and risk management rules
The strategy works best on liquid instruments with clear opening sessions and sufficient volatility to generate meaningful ranges. Results will vary significantly based on market conditions, parameter settings, and the specific instrument traded.
I warrant that the information created and published by by me here on TradingView is not prohibited, doesn't constitute investment advice, and isn't created solely for qualified investors.

Instant Breakout Strategy with RSI & VWAPInstant Breakout Strategy with RSI & VWAP
This TradingView strategy (Pine Script v6) trades breakouts using pivot points, with optional filters for volume, momentum, RSI, and VWAP. It’s optimized for the 1-second timeframe.
Overview
The strategy identifies breakouts when price crosses above resistance (pivot highs) or below support (pivot lows). It can use basic pivot breakouts or add filters for stronger signals. Take-profit and stop-loss levels are set using ATR, and signals are shown on the chart.
Inputs
Left/Right Pivot Bars: Bars to detect pivots (default: 3). Lower values increase sensitivity.
Volume Surge Multiplier: Volume threshold vs. 20-period average (default: 1.5).
Momentum Threshold: Minimum % price change from bar open (default: 1%).
Take-Profit ATR Multiplier: ATR multiplier for take-profit (default: 9.0).
Stop-Loss ATR Multiplier: ATR multiplier for stop-loss (default: 1.0).
Use Filters: Enable/disable volume, momentum, RSI, and VWAP filters (default: off).
How It Works
1. Pivot Detection
Finds pivot highs (resistance) and lows (support) using ta.pivothigh and ta.pivotlow.
Tracks the latest pivot levels.
2. Volume Surge
Compares current volume to a 20-period volume average.
A surge occurs if volume exceeds the average times the multiplier.
3. Momentum
Measures price change from the bar’s open.
Bullish: Price rises >1% from open.
Bearish: Price falls >1% from open.
4. RSI and VWAP
RSI: 3-period RSI. Above 50 is bullish; below 50 is bearish.
VWAP: Price above VWAP is bullish; below is bearish.
5. ATR
14-period ATR sets take-profit (close ± atr * 9.0) and stop-loss (close ± atr * 1.0).
Trading Rules
Breakout Conditions
Bullish Breakout:
Price crosses above the latest pivot high.
With filters: Volume surge, bullish momentum, RSI > 50, price > VWAP.
Without filters: Only the crossover is needed.
Bearish Breakout:
Price crosses below the latest pivot low.
With filters: Volume surge, bearish momentum, RSI < 50, price < VWAP.
Without filters: Only the crossunder is needed.
Entries and Exits
Long: Enter on bullish breakout. Set take-profit and stop-loss. Close any short position.
Short: Enter on bearish breakout. Set take-profit and stop-loss. Close any long position.
Visuals
Signals: Green triangles (bullish) below bars, red triangles (bearish) above bars.
Pivot Levels: Green line (resistance), red line (support).
Indicators: RSI (blue, separate pane), VWAP (purple, on chart).
How to Use
Apply to a 1-second chart in TradingView for best results.
Adjust inputs (e.g., pivot bars, multipliers). Enable filters for stricter signals.
Watch for buy/sell triangles and monitor RSI/VWAP.
Use ATR-based take-profit/stop-loss for risk management.
Notes
Best on 1-second timeframe due to fast RSI and responsiveness.
Disable filters for more signals (less confirmation).
Backtest before live trading to check performance.
This strategy uses pivots, volume, momentum, RSI, and VWAP for clear breakout trades on the 1-second timeframe.


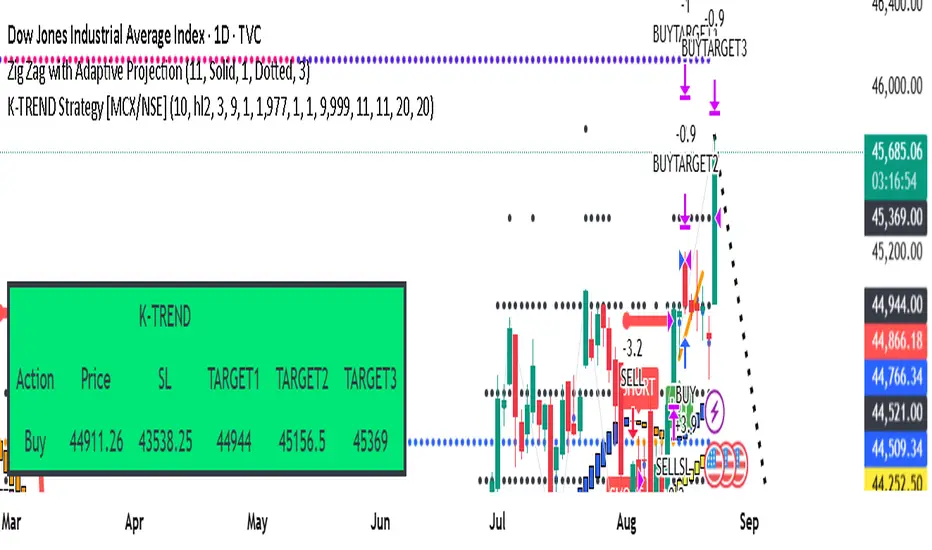
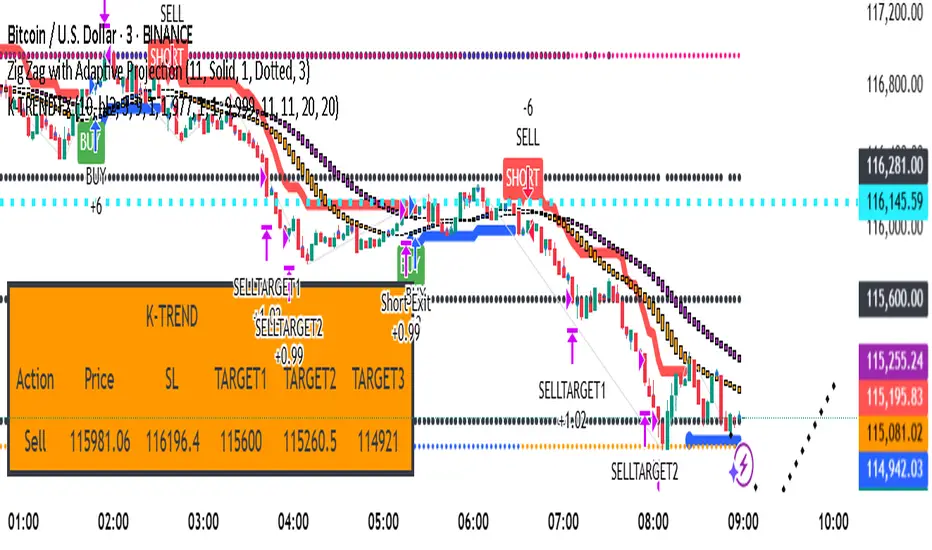
K-TREND Strategy k trend is very useful and high profitablility , it gives entry signals with buy/sell entry signalwith stoploss and targets

US100 Liquidity Precision StrategyScalping strategy 5-10 point sl / 17 points tp
Automatic BE
Consistent money over time

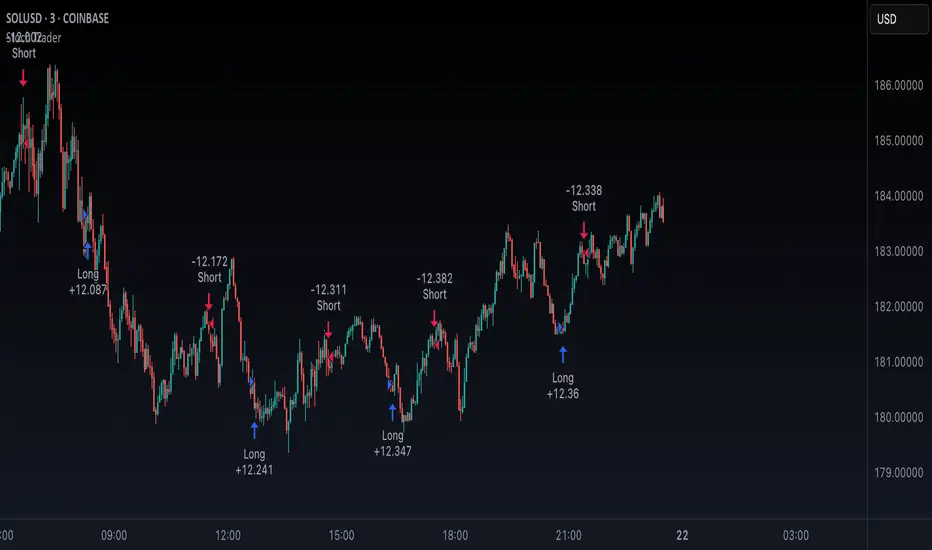
Stoch TraderSimple example strategy that has greater than 60% win rate on 1m, 3m, and 5m views. Using something as simple as this with leverage can produce decent returns within 15-30min. It's also very easy to lose money doing this.
TTE Elite Market SignalsWelcome to TTE Elite Market Signals Your very own personal trading assistant
Trading today demands more than intuition—it requires exclusive access to elite-level market intelligence and the discipline to act on high-probability signals. Every professional trader seeks that decisive advantage: the clarity and confidence that separates consistent profitability from market uncertainty. The financial markets show no mercy, demanding precision, logic, and strategy grounded in institutional-grade analysis.
Human judgment, while powerful, can be compromised by fatigue and emotion, leading to costly trading errors. This is precisely where TTE Elite Market Signals excels. Our sophisticated platform combines proven trading methodologies with advanced signal generation technology, delivering market intelligence that empowers you to identify optimal entry and exit opportunities while maintaining complete control over your trading decisions.
Revolutionary Signal Intelligence
TTE Elite Market Signals features adaptive learning technology that evolves with market conditions. It continuously refines its analysis, helping you identify higher-probability setups while providing the market intelligence needed for superior risk management.
Elite Analysis Modes
Our platform adapts its signal generation to match market personalities:
- Institutional Flow Mode (MM-hybrid): Identifies manipulation patterns and tracks smart money movement with exclusive institutional-grade precision
- Momentum Adaptive Mode: Rapidly adjusts analysis when volatility and momentum shift
- Conservative Precision Mode: Steady, risk-conscious signals for consistent performance
- Adaptive Intelligence Mode: Self-refining system that enhances signal quality over time from past trades (long term of use)
Comprehensive Signal Intelligence
TTE Elite Market Signals integrates multiple sophisticated analytical systems:
- Volume Profile analysis for exclusive institutional-level market insights
- Pattern recognition enhanced by machine learning algorithms
- Intelligent exit timing that identifies optimal profit-taking opportunities
- Protection against market manipulation tactics
- Position sizing guidance that scales with trading success
- Fibonacci based reversal logic
Perfect for Your Trading Evolution
Experienced traders appreciate our sophisticated market intelligence and institutional-grade analytics that provide genuine competitive advantages.
Developing traders benefit from intelligent signal analysis that handles complex market calculations while teaching professional-level market interpretation and risk management principles via visuals on chart and descriptive panel.
All timeframes supported—from scalping to swing trading, TTE Elite Market Signals adapts to your preferred trading style via several user input selections.
Two Elite Service Modes
1. Signal Intelligence Mode: Real-time market signals with AI-driven analysis and detailed trade rationale
2. Alert Precision Mode: High-probability setup notifications with comprehensive market context and risk parameters
The Exclusive Learning Advantage
What makes TTE Elite Market Signals exceptional: it maintains a comprehensive trade memory and identifies the highest-probability signals, adapts to changing volatility patterns, and continuously refines(does not repaint) its analysis to enhance your profit potential and trading accuracy.
Built-in Professional Protection
- Advanced manipulation detection safeguards against institutional market maker(MM) tactics
- Intelligent risk assessment adjusts signal confidence based on market conditions
- Progressive scaling guidance maximizes winners while minimizing losses(educational)
- Comprehensive oversight with customizable risk parameters
Experience the Elite Difference
TTE gives you visuals on the chart of past trades and live metrics results to see what actually work and what fails, to minimize unrealistic expectations. Just sit back and watch sophisticated algorithms work tirelessly on your behalf, identifying opportunities that others miss and alerting you as signals are generated. Transforming the stressful, emotional battlefield of trading into a systematic analytical approach.
Let the System Do the Heavy Lifting
While others struggle with analysis paralysis and emotional decision-making, you'll have access to signals that have already processed hundreds of data points, identified institutional patterns, and calculated optimal risk-reward scenarios for a far less stressful trading experience.
What Elite Traders Should Know
TTE Elite Market Signals represents cutting-edge signal generation technology designed for serious market education and skill development, but it is not a black box, nor perfect for all markets. It must be adjusted to yield optimal results. While our advanced capabilities and institutional-grade features provide significant analytical advantages, trading success requires discipline and proper execution. Markets evolve, and optimal results demand understanding of signal context.
Success with TTE Elite Market Signals comes from mastering our analytical modes and using the proper entry types such as breakout entry, machine learning(ML) entry etc, utilizing and selecting the most effective risk control to optimize it, and maintaining disciplined risk management.
Join the Elite Trading Revolution
This isn't just another signal service—it equips you with the tools to do proper market analysis displaying price movement and volume profile designed for serious traders who understand that consistent profitability comes from discipline, superior market intelligence and proper interpretation, not luck.
Trade smart, stay profitable, and achieve trading excellence.
Best TTE Settings
Trade Entry Types:
1st Best Breakout Entry(out perform all others when used alone)
2nd Best ML Entry by itself or + Pattern Entry Combined
Risk Management:
ATR Multiplier 2
Enable Master Size Control
Master Size Mode
Max Risk Per Trade % 2.5
Max Multiplier Cap 1.5
Enable Growth Scaling
Growth Scaling Mode-set to Time Based or Performance
Risk Management System- set to Hybrid
Enable ML System
ML Mode-set to Auto or Quantum Learning
ML Application Strategy-set to Universal All Entries
Enable Trend Continuation
Mode- Set to Standard
Independent Entry-stays unchecked(off)
Best Performing Instruments on TTE (will update list as more are adjusted and tested)
NVDA
AMD
AMZN
TSLA
SPY
QQQ
PLTR

Pivot Distance Strategy# Multi-Timeframe Pivot Distance Strategy
## Core Innovation & Originality
This strategy revolutionizes moving average crossover trading by applying MA logic to **pivot distance relationships** instead of raw price data. Unlike traditional MA crossovers that react to price changes, this system reacts to **structural momentum changes** in how current price relates to recent significant pivot levels, creating earlier signals with fewer false positives.
## Methodology & Mathematical Foundation
### Pivot Distance Oscillator
The strategy calculates:
- **High Pivot Percentage**: (Current Close / Last Pivot High) × 100
- **Low Pivot Percentage**: (Last Pivot Low / Current Close) × 100
- **Pivot Distance**: High Pivot Percentage - Low Pivot Percentage
This creates a standardized oscillator measuring market structure compression/expansion regardless of asset price or volatility.
### Multi-Timeframe Filter
Higher timeframe analysis provides directional bias:
- **HTF Long** → Allow long entries, force short exits
- **HTF Short** → Allow short entries, force long exits
- **HTF Squeeze** → Block all entries, force all exits
## Signal Generation Methods
### Method 1: Dual MA Crossover (Primary/Default)
**Fast MA (14 EMA)** and **Slow MA (50 SMA)** applied to pivot distance values:
- **Long Signal**: Fast MA crosses above Slow MA (accelerating bullish pivot momentum)
- **Short Signal**: Fast MA crosses below Slow MA (accelerating bearish pivot momentum)
**Key Advantage**:
- Traditional: Fast MA(price) crosses Slow MA(price) - reacts to price changes
- This Strategy: Fast MA(pivot distance) crosses Slow MA(pivot distance) - reacts to structural changes
- Result: Earlier signals, better trend identification, fewer ranging market whipsaws
### Method 2: MA Cross Zero
- **Long**: Pivot Distance MA crosses above zero
- **Short**: Pivot Distance MA crosses below zero
### Method 3: Pivot Distance Breakout (Squeeze-Based)
Uses dynamic threshold envelopes to detect compression/expansion cycles:
- **Long**: Distance breaks above dynamic breakout threshold after squeeze
- **Short**: Distance breaks below negative breakout threshold after squeeze
**Note**: Only the Breakout method uses threshold envelopes; MA Cross modes operate without them for cleaner signals.
## Risk Management Integration
- **ATR-Based Stops**: Entry ± (ATR × Multiplier) for stops/targets
- **Trailing Stops**: Dynamic adjustment based on profit thresholds
- **Cooldown System**: Prevents overtrading after stop-loss exits
## How to Use
### Setup (Default: MA Cross MA)
1. **Strategy Logic**: "MA Cross MA" for structural momentum signals
2. **MA Settings**: 14 EMA (fast) / 50 SMA (slow) - both adjustable
3. **Multi-Timeframe**: Enable HTF for trend alignment
4. **Risk Management**: ATR stop loss, ATR take profit
### Signal Interpretation
- **Blue/Purple lines**: Fast/Slow MAs of pivot distance
- **Green/Red histogram**: Positive/negative pivot distance
- **Triangle markers**: MA crossover entry signals
- **HTF display**: Shows higher timeframe bias (top-left)
### Trade Management
- **Entry**: Clean MA crossover with HTF alignment
- **Exit**: Opposite crossover, HTF change, or risk management triggers
## Unique Advantages
1. **Structural vs Price Momentum**: Captures market structure changes rather than just price movement, naturally filtering noise
2. **Multi-Modal Flexibility**: Three signal methods for different market conditions or strategies
3. **Timeframe Alignment**: HTF filtering improves win rates by preventing counter-trend trades

Supertrend Strategy with ATR TP and SLSupertrend Strategy with ATR TP and SL
Overview
The Supertrend strategy is a trend-following trading system that utilizes the Average True Range (ATR) to determine the market's volatility and to set dynamic support and resistance levels. This strategy employs the Supertrend indicator to identify entry and exit points for trades, specifically focusing on long and short positions in the market.
Key Components
Inputs
ATR Period: This defines the lookback period for calculating the ATR, which helps in understanding market volatility. The default value is set to 10.
Supertrend Multiplier: This multiplier adjusts the sensitivity of the Supertrend indicator. A value of 3 is used, affecting the upper and lower bands of the Supertrend calculation.
TP (Take Profit) ATR Multiplier: This multiplier is used to calculate the take profit level based on the ATR (default value is 3).
SL (Stop Loss) ATR Multiplier: This multiplier dictates the stop loss distance from the entry point concerning the ATR, set to a value of 1.5.
Number of Bars to Use for Backtest: This setting determines how many bars are analyzed during testing, set to a default of 240.
Trading Mode: Options are provided to choose whether to take only long positions or only short positions.
ATR Calculation
The ATR is computed using a specified period, allowing traders to gauge market volatility effectively. This is crucial for setting appropriate stop loss and take profit levels.
Supertrend Calculation
The Supertrend indicator is calculated using the ATR and the multiplier to derive upper and lower bands. The current market price is compared against these bands to determine the trend direction.
Trade Signals
Buy Signal: Generated when the price closes above the Supertrend line, indicating a potential upward trend.
Sell Signal: Generated when the price closes below the Supertrend line, indicating a potential downward trend.
Entry and Exit Strategies
When a buy signal is triggered, the strategy will enter a long position while setting the take profit and stop loss based on the ATR values.
Conversely, if a sell signal occurs, a short position is opened with respective take profit and stop loss levels.
Alert Conditions
Alerts are set up for both buy and sell signals, allowing users to be notified when trade opportunities arise.
Visualization
The Supertrend line is plotted on the chart, along with take profit and stop loss levels for each trade. Labels indicate entry points to facilitate easy tracking of trades.
Conclusion
This Supertrend strategy is designed to simplify trading decisions by automating the entry and exit points based on well-defined market conditions. By utilizing the ATR for dynamic risk management, traders can adapt their approach according to market volatility. This strategy is suitable for many trading styles and can be backtested to assess its performance across different market conditions.
Usage
To use this strategy, simply apply the script in TradingView and adjust the input parameters based on your trading preferences. The strategy can be modified further to enhance its performance according to specific market scenarios.