Smart Trend MASmart Trend MA - Adaptive Moving Average with VHF Technology
WHAT IT IS
Smart Trend MA is an adaptive moving average indicator based on Perry Kaufman's KAMA (Kaufman Adaptive Moving Average) algorithm enhanced with VHF (Vertical Horizontal Filter) technology. The indicator automatically adjusts its responsiveness to current market conditions, becoming faster during trending markets and slower during ranging conditions to reduce false signals.
ORIGINALITY AND VALUE
This implementation combines KAMA's efficiency ratio methodology with dynamic VHF period adaptation, creating an intelligent system that self-adjusts without manual intervention. Unlike standard moving averages with fixed periods, Smart Trend MA dynamically calculates optimal sensitivity based on market structure. The gradient color visualization system provides immediate trend strength feedback. This indicator adds value by reducing whipsaw trades in choppy markets while maintaining responsiveness during genuine trends.
HOW IT WORKS
The indicator employs Kaufman's efficiency ratio calculation to measure directional movement relative to volatility. When markets trend strongly, the efficiency ratio increases and the moving average responds quickly to price changes. During sideways or choppy markets, the efficiency ratio decreases and the moving average becomes smoother to filter noise.
The VHF adaptation layer adds a second dimension of intelligence by dynamically adjusting the calculation period based on vertical price movement relative to horizontal price range. This dual-adaptive approach creates a moving average that automatically optimizes itself for current conditions without requiring parameter changes.
The gradient color system uses slope calculation to display trend strength visually. Stronger trends display more saturated colors while weaker or consolidating markets show muted tones.
FEATURES
- KAMA algorithm with efficiency ratio calculation
- VHF adaptive period adjustment for enhanced responsiveness
- Gradient color visualization with 7 color scheme options
- Range detection line showing mid-range support and resistance levels
- Multi-timeframe compatible across all markets
- No repainting - calculations use confirmed bar data
- Native TradingView alert system with 6 alert conditions
SETTINGS AND PARAMETERS
Length: Base calculation period (default 21). Higher values produce smoother lines suitable for position trading. Lower values (9-12) increase sensitivity for shorter timeframes.
Fast Factor: Controls maximum responsiveness during strong trends (default 0.66). Higher values increase reaction speed but may produce more noise.
Slow Factor: Controls minimum responsiveness during ranging markets (default 0.0645). Lower values create more smoothing during consolidation.
Smoothing Method: Optional additional smoothing using Hann Window or T3 methods. Default "None" recommended for most applications.
Enable VHF Adaptiveness: Activates dynamic period adjustment based on market structure. Recommended to keep enabled.
Range Detection: Displays mid-range line calculated from recent highs and lows. Useful for identifying support and resistance zones.
Gradient Colors: Choose from 7 color schemes or disable for simple two-color trend indication.
USAGE INSTRUCTIONS
The indicator plots a single adaptive line on the price chart. When the line slopes upward, market conditions favor bullish positions. When the line slopes downward, market conditions favor bearish positions. The gradient color intensity indicates trend strength - more saturated colors signal stronger directional movement.
The range detection line identifies the midpoint between recent price extremes. Price above the range line suggests bullish bias while price below suggests bearish bias. This line often acts as dynamic support or resistance.
For best results, combine Smart Trend MA with volume analysis and price action confirmation. The indicator works across all timeframes and markets including forex, cryptocurrency, stocks, and indices.
ALERT CONDITIONS
The indicator provides six native alert conditions through TradingView's alert system:
Bullish Trend: Triggers when the moving average direction changes to upward
Bearish Trend: Triggers when the moving average direction changes to downward
Strong Bullish: Triggers when slope exceeds threshold indicating strong upward momentum
Strong Bearish: Triggers when slope exceeds threshold indicating strong downward momentum
Price Cross Above: Triggers when price crosses above the moving average
Price Cross Below: Triggers when price crosses below the moving average
TECHNICAL NOTES
This indicator uses lookahead_off to ensure calculations reflect only confirmed bar data, preventing repainting issues. The default 21-period setting represents a Fibonacci number statistically proven optimal for swing trading across multiple markets.
LIMITATIONS
Past performance does not guarantee future results. This indicator provides trend analysis based on historical price data and does not predict future price movement. Best results occur in markets with clear directional bias. During extreme volatility or news events, all technical indicators including adaptive moving averages may produce less reliable signals.
No indicator should be used as the sole basis for trading decisions. Combine Smart Trend MA with proper risk management, additional analysis methods, and thorough understanding of the markets you trade.
Trendfollow

Trend Oscillatorwhat is "Trend Oscillator"?
it is an indicator for determining the trend.
what it does?
analyzes the price action by reducing it to 4 different situations. Red means strong bear, orange means bearish, yellow means weak bull and green means strong bull. It was developed to help traders who trade in the direction of the trend and its biggest promise is to simplify price action.
how it does it?
He defines 4 different situations as follows. If the velocity of the price is positive and the acceleration is positive, it is a strong bull, if the velocity is positive and the acceleration is negative, it is a weak bull, if the velocity is negative and the acceleration is positive, it is a weak bear, if both velocity and acceleration are negative, it is a strong bear.
2 for strong bull
1 for the weak bull
-1 for weak bear
Creates a function that takes values of -2 for the strong bear. this function is the velocity of the principal indicator, and then the integral of this function forms the principal indicator.
how to use it?
"source" is used to change the source of the indicator,
"length" makes the indicator give a later but less signal.
you can use it to follow or analyze the trend. colors make it easy to use. learns about current or past trends by looking at colors. Like any trend indicator, it can give unsuccessful signals in a horizontal trend.

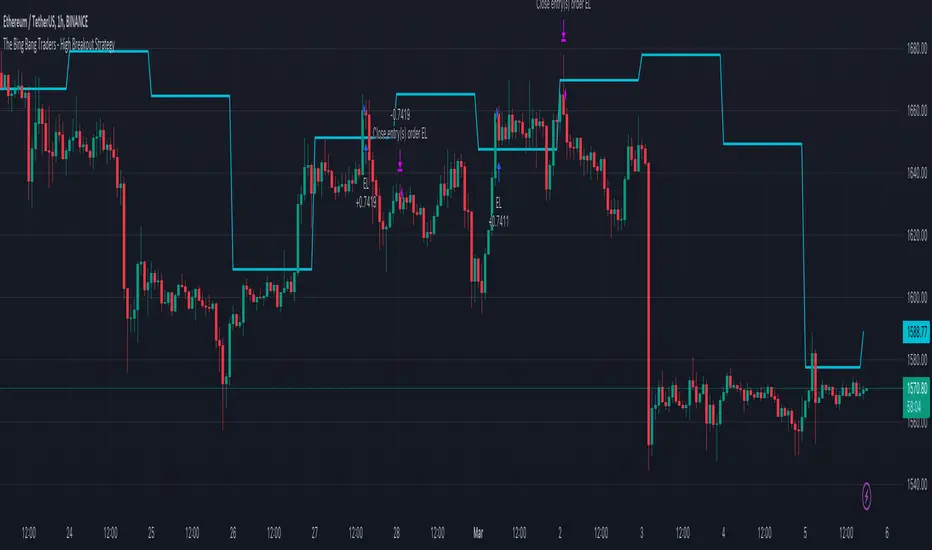
TheBigBangTraders BreakoutName: TheBigBangTraders Breakout
Category: Trend Follower
Operating mode: Spot
Trades duration: Intraday
Timeframe: 1H
Suggested usage: the purpose of this strategy is to help to investigate if the asset is sensitive to breakout approach.
Entry: Trigger point can be choose by the user between:
High of the N days ago
High of the N weeks ago
Exit: End of Day
Usage:
⁃ It can be useful to use this script to test the behaviour of a definite asset
⁃ This is a raw system that can be considered a base to realize a complete breakout strategy
Configuration:
- N/A
Backtesting
⁃ Exchange: BINANCE
⁃ Pair: ETHUSDT
⁃ Timeframe: !H
⁃ Fee 0.075%
⁃ Slippage 0
- Start : 2020-01-03
How you or we can improve? Source code is open so share your ideas!
Super_Macd_Alerts_EMA_publicQuickly find market caps, risk management and predict the timing of contrarian tensions.
By automatically receiving trend changes, we support trend follow, push and return strategies simply and quickly.
Make the most of this all-in-one system and take your trading style one step further.
・ Main functions
MACD slope change signal (UP / DN)
MACD hidden divergence signal (HL / HS)
Histogram divergence signal (vertical background: blue / pink)
You need to use signals without going against the trend.
·idea
Recommended for use with Elliott Wave, SUPER TREND
・ Chart example
WTI Crude Oil Futures | HS Signal Before Crash
GOLD CFD 1D
2021/7/1
UP signal before returning to the UP trend
2021/8/5
HS signal before the crash
BTCUSD 4H
2021/08/10
Signals to use: UP / HL on uptrend, Histogram divergence (pink)

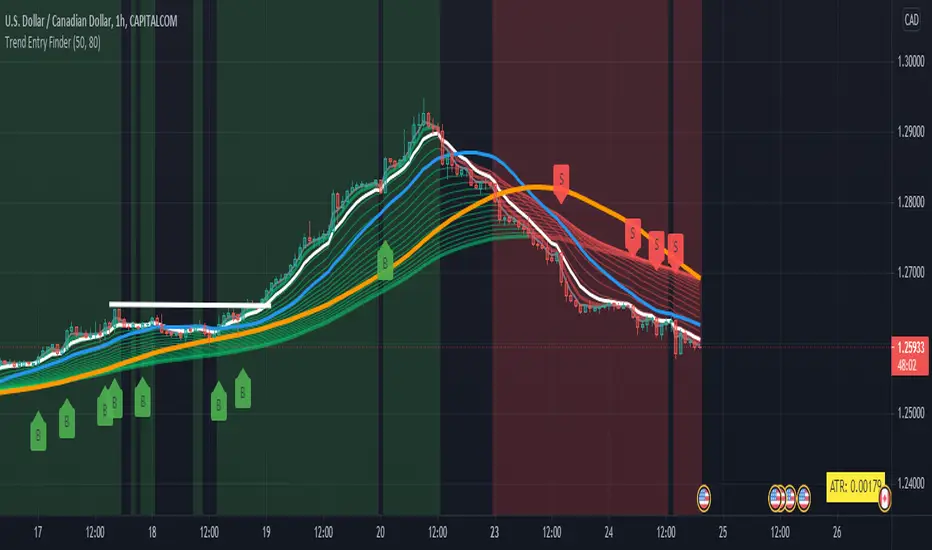
TEF - Trend Entry FinderWith the Trend Entry Finder indicator you can use an EMA ribbon to see if a trend is established (e.g. EMA lines dont intersect and go in one direction). Long and short signals are generated with potential entries into the trade.
Also the 20, 50 and 200 moving averages are displayed that can be used to spot levels of resistance.
CAPITALCOM:US100
ELIA MULTI INDICATORS STRATEGYExperimental multi indicators strategy, to catch right entry and avoid noise.
Each indicator included in the strategy, assume a value based on its status and because is a trend-follow strategy, some indicator value are higher then the other
Backtested on ETHUSDTPERP
BINANCE:ETHUSDTPERP

Bollinger Band+ Multi EMA, SMAHello Everyone.
I make Bollinger band , 3 ema and 3 sma combined.
I think this indicator can use all timeframe.
--------------------------------------------------------------
Indicator will show you
1. Trend follow
2. Pullback catch
2. Market bounce.
1. Trend Follow
- Trend Follow for I used 3 terms. They are short, Mid and Long Trend.
2. Pullback Catch
- EMA for Save, take care, alert Zones.
- Mid Term Trend can be catch also.
3. Market Bounce
- Bollinger Band will show you market re-bounce point.
Final Notes
Indicator will show Trend, Pullback, Market bounce and some support and resistant level.

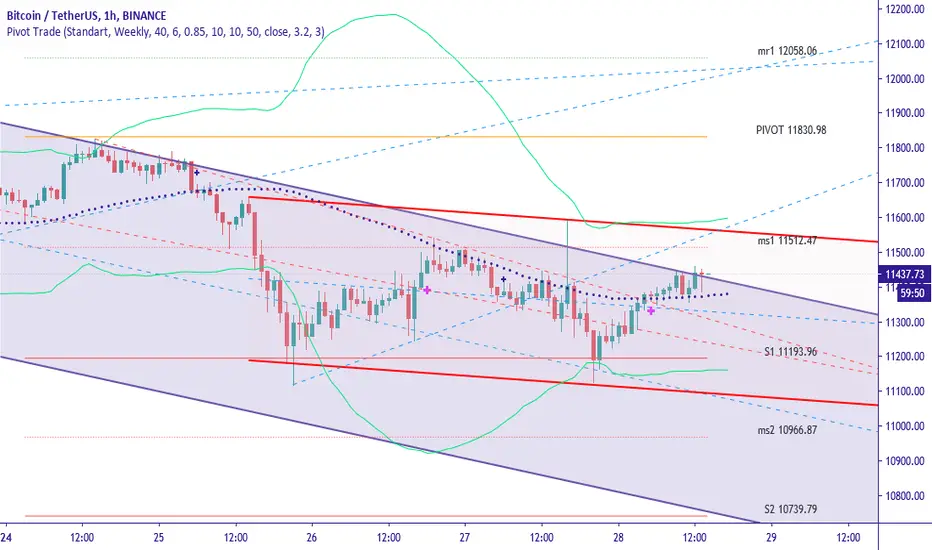
Pivot TradeThis study contains:
- A complete set of pivot calculation. Standart, Fibonacci, Woodie, Camarilla
- Standart Pivot with extended support and resistance levels.
- ALMA a new generation moving average indicator which succesfull to follow trend changes.
- System28 EMA Based trend follower. (Thanks to great master Ali Ömür)
- Auto Trend Lines drawing tool with pivot highs and lows.
- Alarm function on pivot levels.
How to Use :
UPTREND
Orange cross points to an uptrend,
Fuschia cross confirms uptrend.
DOWNTREND
Black cross points to an donwtrend,
Navy cross confirms uptrend.
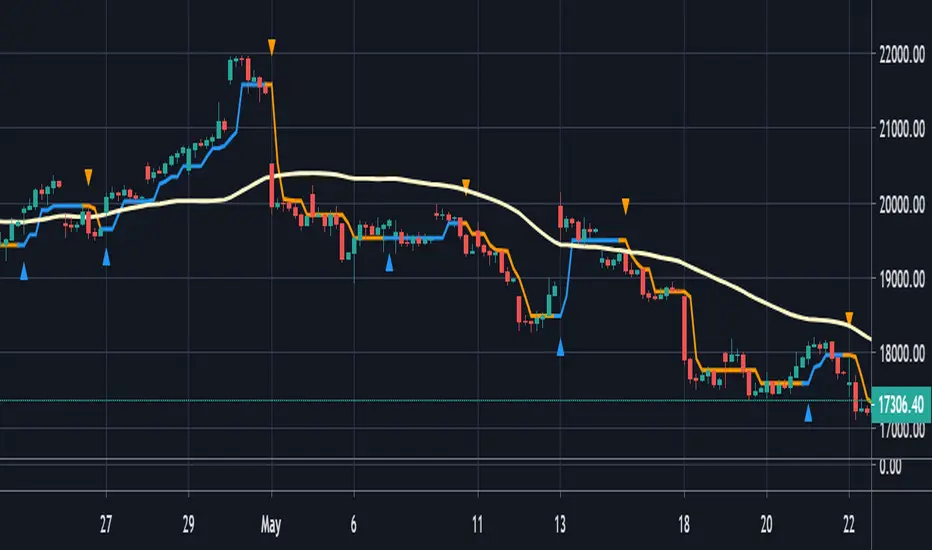
Xtreme TrendDisclaimer: This base Script is derived and tweaked from Half Trend. But unlike halftrend, it doesn't repaint and signals come at different logic.
Background:
I was using this script and trading with this for a while. Few weeks back I had come across a similar Script being sold as premium in Tradingview for $100 per month. The seller has a lots of videos in youtube and claims that he has created this script by investing lakhs and it also takes consideration of price action !!! . No doubt he is a successful trader but if you watch his other videos you will realize that he trades with S/R, trendlines and price action. He speaks quite well, and the morphed videos give impressions that all his profits are from using this indicator. I fell for it, but then after using for a few days I had realized that both the indicators are almost same, but giving signals at different time. When I edited my indicator for a few settings, it appeared that now signals are also coming exactly at same point. I never wanted to publish this script, but this person was going on and on fooling people. So, I have decided to publish it here, as a protected code. Again this is no holy grail. Works well in trending market and hell in sideways.
How to Use:
PLEASE WAIT TILL CANDLE CLOSE, take entry in the beginning of next candle. Time frame: 5 mins for index, 15 mins - 30 mins for stocks
Add 200 EMA over it ( Personally I love using 50 MA) and buy when signal and price both are on same side. Example, buy when there is buy signal + price is above 200 EMA
Sell: When price is below 200 EMA and there is a sell signal on the indicator.
Seems better when you mix it with pivots, S/R etc.
please comment, if you find this useful.
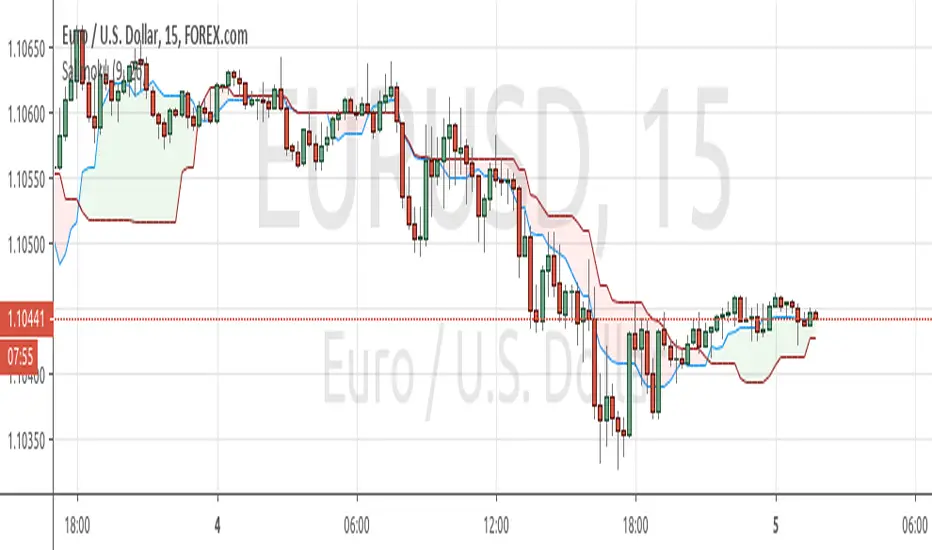
Salimoku T-OriginSalimoku is a simplified Ichimoku without clouds. This indicator is best used for trend following strategy. The advantage here is the possibility to catch a trend at it very beginning and also get clear entry signals on already formed trends.
To enter a trade:
a buy signal is triggered when price crosses the decision line and closes above it.
a sell signal is triggered when price crosses the decision line and closes below it
In the scenario of trend already formed:
a buy signal is triggered when price bounces in between baseline and conversion line and closes above baseline.
a sell signal is triggered when price bounces in between baseline and conversion line and closes below baseline
Pivot Reversal Strategy - FIGS & DATES 2.0Simple Pivot Reversal Strategy with some adding settings.
Date Range: To test over specific market conditions.
Initial Capitol: $10K - This is a more realistic representation of funds used this strategy (for me anyway). The default of $100K can give different results (usually better) than when using a smaller balance.
Order Size: 100% Equity - These trend following strategies typically used this way, going all in each direction.
Commission: .075% - It's always disheartening to think you've found a ridiculously good setting, and then realize you forgot to add the commission.
All of these settings can be changed, but it's easier for me (and more fool proof) to have them set as default.

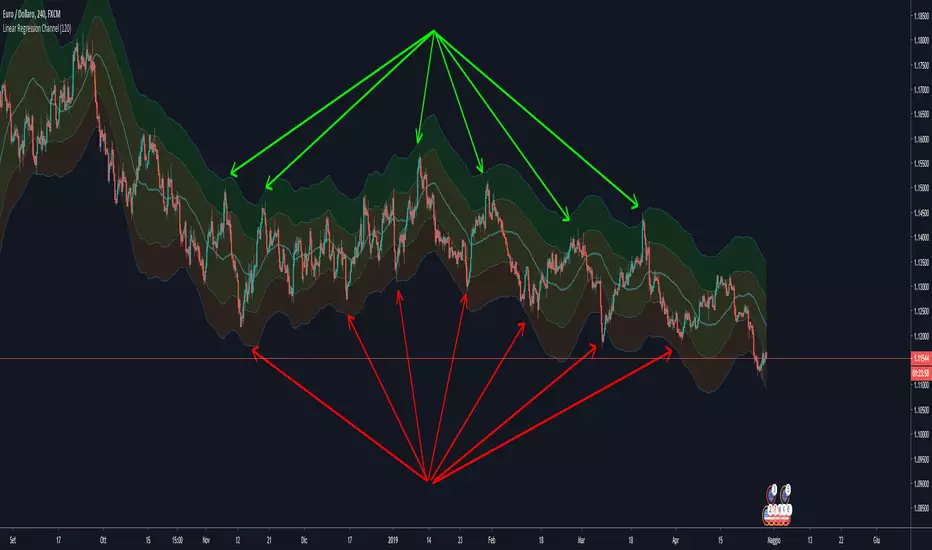
linear regression channelThe linear regression indicator is used for trend identification and trend following in a similar fashion to moving averages.
Best time frames to use the indicator: H1/H4
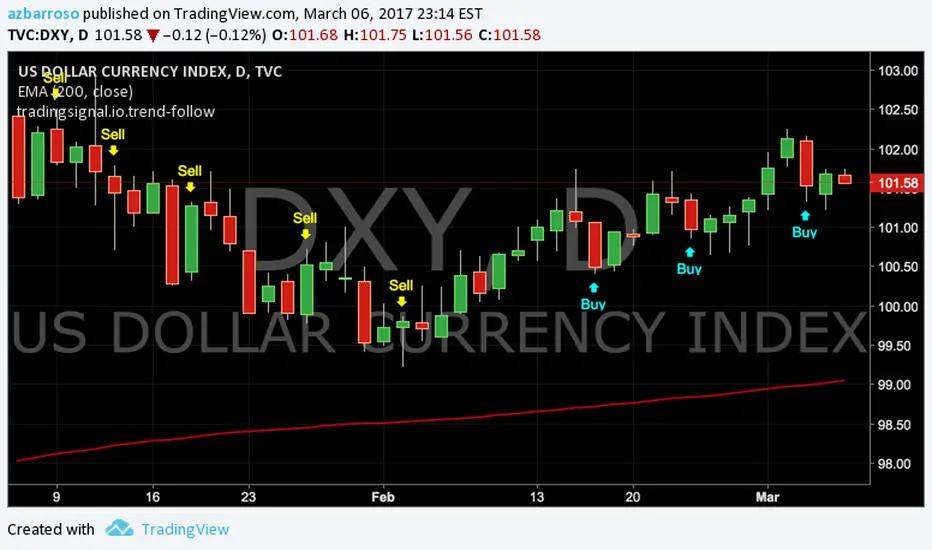
io-trend-follow (1.5)Trend Follow script to be used across all market instruments and timeframes.
You can display long only, short only or both signals.
version 1.5 -> Filter by EMA 200 option added
version 1.4 -> Alerts added
version 1.2 -> Only one signal per trend (default) or multiple entry signals per trend
version 1.1 -> White theme option added
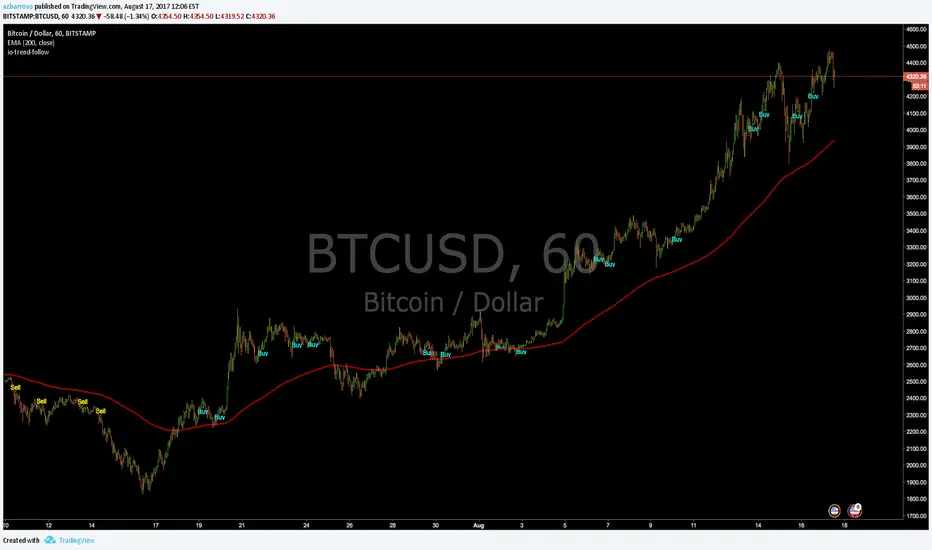
tradingsignal.io.trend-followTrend follow script to be used across all market instruments and timeframes. It will be available for testing and subscription soon.