DepthHouse Relative Momentum Range OscillatorDepthHouse Relative Momentum Range Oscillator uses several calculations between the relative momentum and range to help determine trend direction and strength.
Breakouts above the adjustable horizontal zone often serve as a bullish confirmation, while breakout below the horizontal zone often serve as a bearish confirmation.
Crosses of gold and yellow signal line represent trend consolidation and/or possible reversal zones.
How to get:
As you can see this is an invite only script. In the coming month this indicator, along with many others will become pay to use only. (website on my profile page)
However all my indicators will be FREE until May 1, 2018 . So please try them out!
To take advantage of this FREE trial :
1. Leave comment on this indicator post! Maybe even give me a follow :D
2. Check out and take advantage of all my other indicators!
I hope you all enjoy!
Notes:
Signals Beta:
Both functions give possible buy and sell signals shown by the circles in the middle. The strength of the signal is shown by the circle size. The larger the circle, the stronger the signal.
This feature is in beta testing is not advised to trade off of.
Altering the Multi-Factor will adjust the dotted signals at the bottom.
This is a heavily modified version of my DepthHouse Envelope Oscillator
Trends

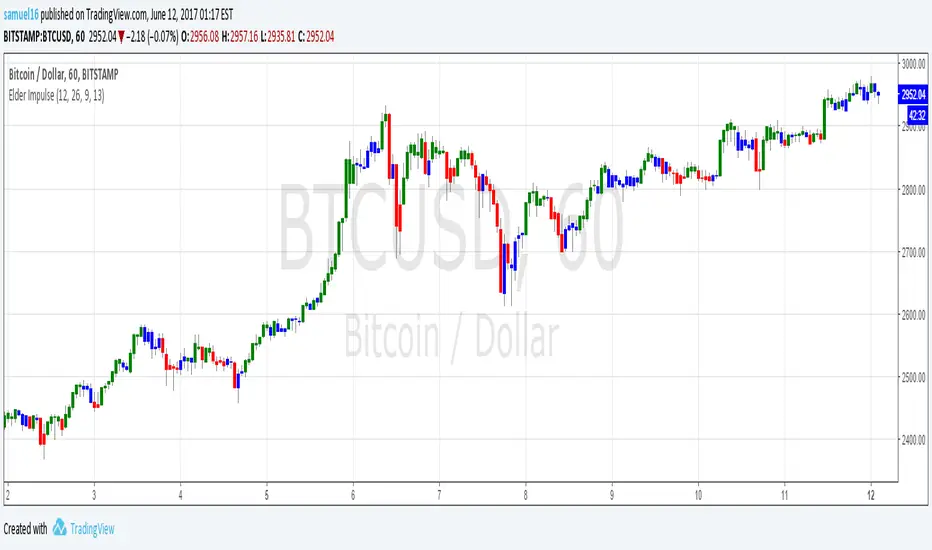
Elder Impulse SystemQuickly Identify Trends with the Elder Impulse Indicator.
Pretty much the same as , but written from scratch to be simpler to use and the source code easier to read (no offense, LazyBear)
For more info, see stockcharts.com
UltraTrends.V2This is version 2 of Ultratrends.
Like the last version:
Fuschia is pivot down, yellow is pivot up, up is confirmed up, down is confirmed down, green is uptrend, red is downtrend, gray is no trend.
"UP" Is a good indication that the market is going to go up. "DOWN" is a good indication that the market will go down. However, use your head. Think about support / resistance.
Additions:
- 200 EMA/SMA Average (Thick aqua line): Great for determining trend and acts as support / resistance.
- 50 SMA (thin yellow line): Use for 50/200 crosses to determine trend. Serves as weaker resistance.
- Dynamic Pivot points (by finn): Serve as support / resistance levels. Plotted as horizontal dots.
- Early move detection: demonstrated by either a green triangle below bar or red triangle above bar.
- "Hot Zones": volume based background highlighting the manifestation of bullish conditions. Default color is white, so if you use a lighter background, please change it to another color.
This indicator works best with 1337 Volume:
The only way to get this script is by joining Gambit Private Trading Room. There are currently ~ 90 experienced traders in the room at the time of this post that share the best ideas / setups. For more information, please fill out the form at: GambitCrypto.com
Enjoy

MM-Burj Khalifa IndicatorThis indicator uses several signals to visualize a "perfect candle" to enter a trade.
It colors the background to identify the zones of interest (multiple configurable high or low RSI zones). Underlying is a trendbar with the current MACD direction.
The indicator is using signals of:
--MACD
--RSI
--PVT
--ATR
--AD and DMI+/DMI-
When all 7 criterias are met it highlights the candle.
It also creates different colums with different height and width, so that you can see which signal is OK and which is maybe missing. When all signals are on GO you'll see a Burj-Khalifa-like figure. If not all signals are on GO you'see crippled versions.
To be clear:
it's not intended to detect trends or supertrends or reversals. It's purpose it's just to decide if this current candle is really going in the right direction.
The Burj-Khalifa indicator could help to confirm the entry point of an trade which was already planned.
