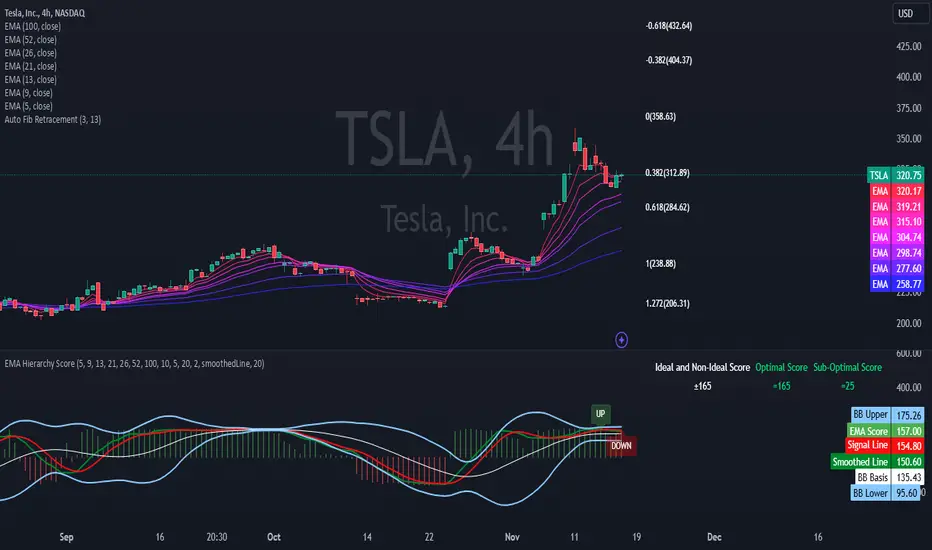
EMA Hierarchy Score V.1.0
EMA Hierarchy Score V.1.0
Purpose
The EMA Hierarchy Score indicator assesses the relative positioning of multiple Exponential Moving Averages (EMAs) for a financial asset. This tool provides insights into trend strength by calculating ideal and non-ideal configurations of EMAs, allowing for effective interpretation when used alongside standard EMA charts.
Variables and Inputs
The indicator organizes a set of EMAs and other metrics into a hierarchy for scoring:
* Primary Variables (A–J):
A: Close price
B: Open price
C: Previous close price
D to J: EMAs of configurable periods (5, 9, 13, 21, 26, 52, 100).
* User Inputs:
* Customizable periods for each EMA, allowing users to adjust the indicator’s sensitivity.
* Customizable period and standard deviation multiplier for Bollinger Bands, enabling further control over the indicator’s analysis.
Mathematical Method
The EMA Hierarchy Score calculates how closely the current EMA structure aligns with an “ideal” configuration through a structured scoring system:
1- Hierarchy Scoring:
* Ideal Order: Defined as A > B > C > D > E > F > G > H > I > J, representing a strong upward trend where each EMA progressively increases.
* Non-Ideal Order: Defined as J > I > H > G > F > E > D > C > B > A, indicating a weak or downward trend where each EMA progressively decreases.
* Optimal Order: Calculated based on achieving maximum alignment with the ideal configuration for each EMA across the chosen period.
* Sub-Optimal Order: The least-aligned structure across the same period.
2- Score Calculation:
* The indicator calculates a score by comparing all EMA pairs in values. For each comparison, a score increment of +1 (ideal) or -1 (non-ideal) is applied.
* The final score reflects the EMA configuration’s deviation from the ideal order:
- Positive Score: Indicates closer alignment with the ideal structure.
- Negative Score: Indicates deviation toward a non-ideal structure.
3- Smoothed and Signal Lines:
* A smoothed score is created using a Simple Moving Average (SMA) of the raw hierarchy score.
* A signal line (an SMA of the smoothed score) further aids in tracking directional shifts in the score.
4- Trend Labels and Bollinger Bands:
* Trend Labels: Display "UP" or "DOWN" based on the smoothed score’s relationship to the signal line.
* Bollinger Bands: Plotted around a selected source (smoothedLine, signalLine, or score) to analyze score volatility and deviations from the mean. The period and standard deviation multiplier for Bollinger Bands are user-configurable.
Result Definition
The Ideal and Non-Ideal Scores represent the upper and lower bounds of achievable configurations, ensuring the score does not exceed these values.
1- Ideal and Non-Ideal Result:
* Calculated based on how closely the current EMA configuration follows the “ideal” ascending or descending order.
* Ideal Score: Defined as +165, representing perfect alignment with the ideal configuration.
* Non-Ideal Score: Defined as -165, indicating full alignment with the descending, non-ideal structure.
* The score is bounded by these values and will not go above or below this range.
2- Optimal and Sub-Optimal Scores:
* Optimal Score: The highest score over the selected scoring period, calculated with the same period as the Bollinger Bands. Using consistent periods reinforces the reliability of the score by aligning with the period already used to gauge volatility.
* Sub-Optimal Score: The lowest score over the same period, capturing points of minimal alignment with the ideal order.
Interpretation and Analysis
1- Use with EMA Charts:
* This indicator is designed to be used alongside EMA charts, as its results provide insights into the relative order of EMAs and their alignment with trend strength.
* The EMA Hierarchy Score interprets the underlying EMA structure, offering additional context on whether current trends are aligned with optimal or non-optimal EMA configurations.
2- Ideal and Non-Ideal Analysis:
* A positive EMA Hierarchy Score indicates an orderly, ideal upward trend, suggesting stronger alignment with the ideal structure.
* A negative score signals a potential downward trend or deviation from the ideal structure.
3 - Trend Indicators and Bands:
* Trend Labels: The "UP" and "DOWN" labels offer real-time feedback on trend direction shifts, based on the smoothed score and signal line relationship.
* Bollinger Bands: Visualize the range of score fluctuations, helping to identify breakout or breakdown points.
4 - Optimal and Sub-Optimal Scores:
* Use the Optimal Score to understand peak trend alignment and Sub-Optimal Score to spot potential reversal or correction zones.
* A consistently high score over time indicates trend stability, while variations may suggest instability.
Quick Reference Table
The table displayed at the top right provides an at-a-glance view of key metrics:
* Ideal and Non-Ideal Score: Fixed at ±165 to represent the calculated ideal and non-ideal configuration.
* Optimal and Sub-Optimal Scores: Show maximum and minimum scores over the scoring period, color-coded green for positive and red for negative values.
This concise table helps users quickly assess indicator values, reducing the need to interpret multiple chart lines and making it easier to understand overall trend strength.
Disclaimer
The EMA Hierarchy Score V.1.0 is a technical analysis tool designed to assist in understanding the alignment and strength of trends as defined by EMA configurations. This indicator does not constitute investment advice, nor does it make specific recommendations for buying or selling assets. Users should consult with a financial advisor before making any trading decisions, as past performance or technical signals do not guarantee future results. The developers of this indicator disclaim all liability for potential financial losses arising from reliance on this tool. Users assume full responsibility for interpreting and applying the indicator’s outputs in their investment decisions.
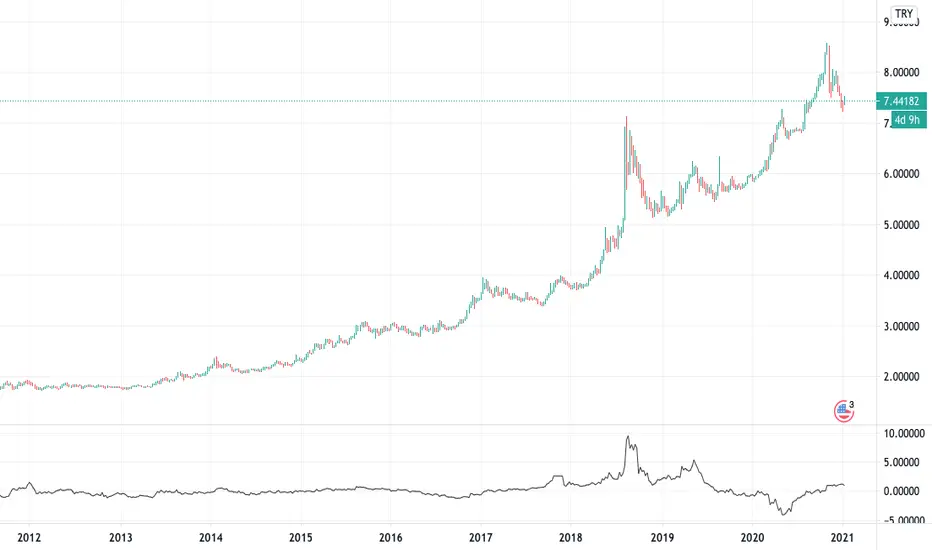
USDTRY
Currency Strength Index by zdmreCurrency strength expresses the value of currency. For economists, it is often calculated as purchasing power, while for financial traders, it can be described as an indicator, reflecting many factors related to the currency; for example, fundamental data, overall economic performance (stability) or interest rates.
The method used in this indicator is its strength against the US Dollar (xxxUSD)
Currencies:
EUR
GBP
AUD
NZD
JPY
CNY
CAD
Your Symbol (Optionally) defval: TRYUSD
You can also optionally add a symbol. However, this unit must be in the form of xxxUSD

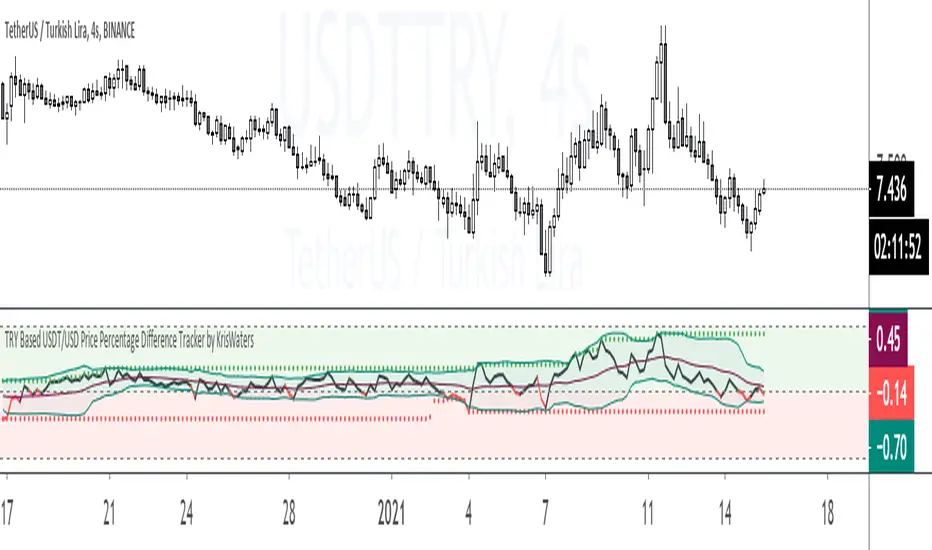
TRY Based USDT/USD Price Percentage Difference TrackerIndicator helps you that track the price percentage difference between USDT/TRY and USD/TRY market pairs.
Turkey Yield Curve SpreadYield spreads are used to see investors' perception of future risk and predict a recession. The spread is the value obtained by subtracting the near term bond from the distant one. This indicator plots this value historically. I used 3-year and 10-year Turkey treasury bond yields instead of 2-year and 10-year Turkey treasury bond yields due to lack of historical data on Tradingview.
Williams%R EMA CROSSESWilliams %R , also known as the Williams Percent Range, is a type of momentum indicator that moves between 0 and -100 and measures overbought and oversold levels. The Williams %R may be used to find entry and exit points in the market.
In this study, exponential moving averages are used in order to smooth out the false signals produced by Williams %R and to see more accurate signals.
In addition, it is aimed to see the divergences by using the moving averages of The Williams %R.
When the short exponential moving averages of Williams %R is above the longs, it may be a signal to think an uptrend will begin, and the long exponential moving averages of Williams %R is above the shorts, it may be a signal to think a downtrend will begin.
At the same time, a second check can be made for price movement with weighted moving averages.

VIDYA by Mehmet YildizliVIDYA by Mehmet Yildizli - Variable Index Dynamic Average
Our behaviours toward financial markets change every time of any date. On the other hand, we usually tend to analyze averages via constant period-of time. That is, our analyzing way is not consistant with a changing dynamics of financial markets.
Therefore, a new form of Moving Average comes trough into the scene: The Variables Index Dynamic Average-VIDYA.
VIDYA is a moving average that regulates itself according to the volatiliy of prices. When prices go up or fall down rapidly VIDYA approches to prices. When prices move less volatile, VIDYA tracks the prices from a distance.
We start calculating VIDYA with an approch of Exponential Moving Average. However, the difference between VIDYA and EMA(Exponential Moving Average) is the changes of constant coeffient of EMA, according to volatility. When new price comes, each time, the VIDYA calculates a new coefficient used to calculate the average. Then, each time a new price comes, a new period of time is calculated according to volatiliy.
In this moving average indicator, you can set two moving average period at the same time. Additionally, you can set two different step height for two moving averages. These step height coefficients is used to round the moving averages. Therefore, when prices cross up and down continously you can change these step heights in order to prevent unnecessary trades.

XU030 USD Purchasing Power ~ Sarp GokdagWhere & How-To Use This Indicator?
This indicator is respectively composed for BIST:XU030 .
In matter, the user decides to use this indicator other than BIST:XU030 , the output of the indicator could be shown wrong.
What is it about?
It shows the purchasing power of BIST:XU030 against United States Dollar.
Although BIST:XU030 have tested new high's repeatedly since 2013, BIST:XU030 's returns on USD have been weakening since then.

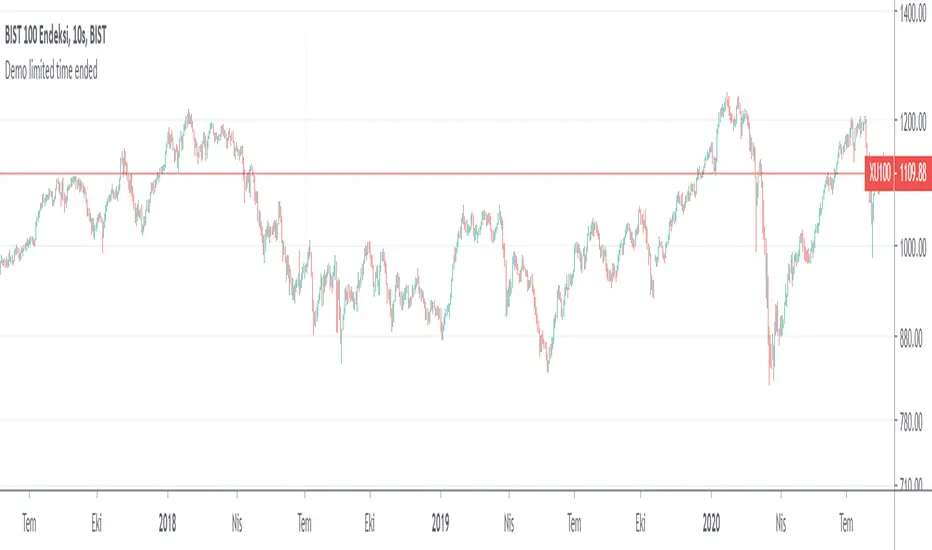
XU100 USD Purchasing Power ~ Sarp GokdagWhere & How-To Use This Indicator?
This indicator is respectively composed for BIST:XU100 .
In matter, the user decides to use this indicator other than BIST:XU100 , the output of the indicator could be shown wrong.
What is it about?
It shows the purchasing power of BIST:XU100 against United States Dollar.
Although BIST:XU100 have tested new high's repeatedly since 2013, BIST:XU100 's returns on USD have been weakening since then.

Borsaca StrategyThis indicator uses contrarian investment style. You can use Buy/Sell indicator and trade hibryd mentality. What do you say? Dont hear before what is mean?
Ok. Good Luck.