Double Vegas SuperTrend Enhanced - Strategy [presentTrading]
█ Introduction and How It Is Different
The "Double Vegas SuperTrend Enhanced" strategy is a sophisticated trading system that combines two Vegas SuperTrend Enhanced. Very Powerful!
Let's celebrate the joy of Children's Day on June 1st! Enjoyyy!
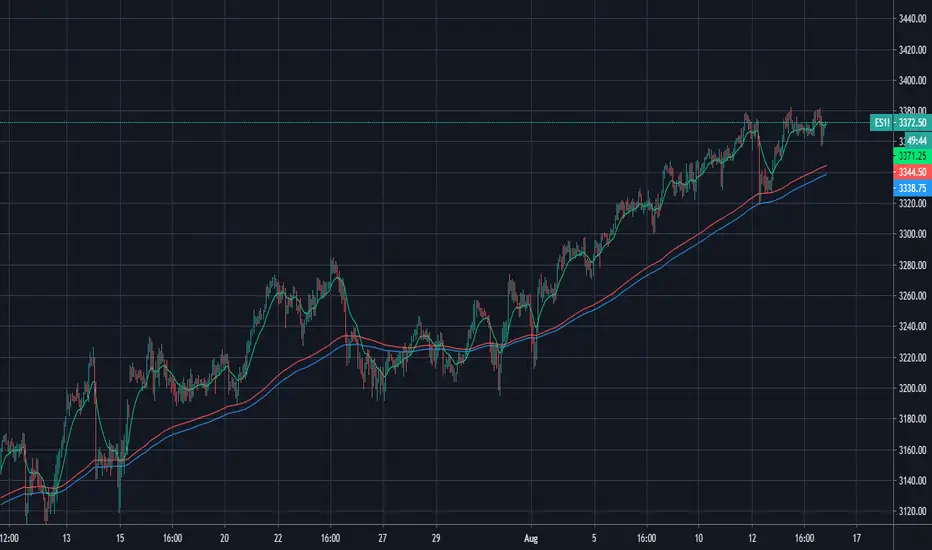
BTCUSD LS performance
The strategy aims to pinpoint market trends with greater accuracy and generate trades that align with the overall market direction.
This approach differentiates itself by integrating volatility adjustments and leveraging the Vegas Channel's width to refine the SuperTrend calculations, resulting in a dynamic and responsive trading system.
Additionally, the strategy incorporates customizable take-profit and stop-loss levels, providing traders with a robust framework for risk management.
-> check Vegas SuperTrend Enhanced - Strategy
█ Strategy, How It Works: Detailed Explanation
🔶 Vegas Channel and SuperTrend Calculations
The strategy initiates by calculating the Vegas Channel, which is derived from a simple moving average (SMA) and the standard deviation (STD) of the closing prices over a specified window length. This channel helps in measuring market volatility and forms the basis for adjusting the SuperTrend indicator.
Vegas Channel Calculation:
- vegasMovingAverage = SMA(close, vegasWindow)
- vegasChannelStdDev = STD(close, vegasWindow)
- vegasChannelUpper = vegasMovingAverage + vegasChannelStdDev
- vegasChannelLower = vegasMovingAverage - vegasChannelStdDev
SuperTrend Multiplier Adjustment:
- channelVolatilityWidth = vegasChannelUpper - vegasChannelLower
- adjustedMultiplier = superTrendMultiplierBase + volatilityAdjustmentFactor * (channelVolatilityWidth / vegasMovingAverage)
The adjusted multiplier enhances the SuperTrend's sensitivity to market volatility, making it more adaptable to changing market conditions.
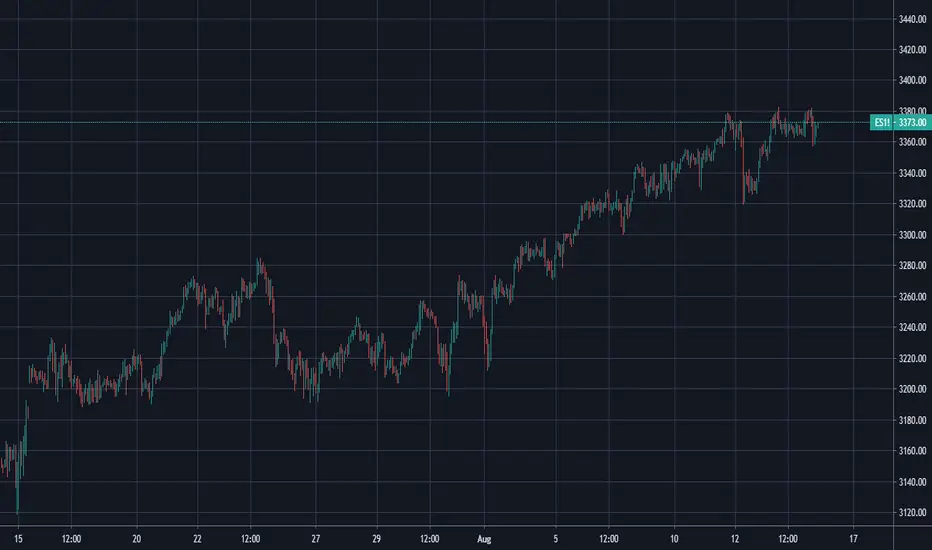
BTCUSD Local picture.
🔶 Average True Range (ATR) and SuperTrend Values
The ATR is computed over a specified period to measure market volatility. Using the ATR and the adjusted multiplier, the SuperTrend upper and lower levels are determined.
ATR Calculation:
- averageTrueRange = ATR(atrPeriod)
**SuperTrend Calculation:**
- superTrendUpper = hlc3 - (adjustedMultiplier * averageTrueRange)
- superTrendLower = hlc3 + (adjustedMultiplier * averageTrueRange)
The SuperTrend levels are continuously updated based on the previous values and the current market trend direction. The market trend is determined by comparing the closing prices with the SuperTrend levels.
Trend Direction:
- If close > superTrendLowerPrev, then marketTrend = 1 (bullish)
- If close < superTrendUpperPrev, then marketTrend = -1 (bearish)
🔶 Trade Entry and Exit Conditions
The strategy generates trade signals based on the alignment of both SuperTrends. Trades are executed only when both SuperTrends indicate the same market direction.
Entry Conditions:
- Long Position: Both SuperTrends must signal a bullish trend.
- Short Position: Both SuperTrends must signal a bearish trend.
Exit Conditions:
- Positions are exited if either SuperTrend reverses its trend direction.
- Additional conditions include holding periods and configurable take-profit and stop-loss levels.
█ Trade Direction
The strategy allows traders to specify the desired trade direction through a customizable input setting. Options include:
- Long: Only enter long positions.
- Short: Only enter short positions.
- Both: Enter both long and short positions based on the market conditions.
█ Usage
To utilize the "Double Vegas SuperTrend Enhanced" strategy, traders need to configure the input settings according to their trading preferences and market conditions. The strategy includes parameters for ATR periods, Vegas Channel window lengths, SuperTrend multipliers, volatility adjustment factors, and risk management settings such as hold days, take-profit, and stop-loss percentages.
█ Default Settings
The strategy comes with default settings that can be adjusted to fit individual trading styles:
- trade Direction: Both (allows trading in both long and short directions for maximum flexibility).
- ATR Periods: 10 for SuperTrend 1 and 5 for SuperTrend 2 (shorter ATR period results in more sensitivity to recent price movements).
- Vegas Window Lengths: 100 for SuperTrend 1 and 200 for SuperTrend 2 (longer window length results in smoother moving averages and less sensitivity to short-term volatility).
- SuperTrend Multipliers: 5 for SuperTrend 1 and 7 for SuperTrend 2 (higher multipliers lead to wider SuperTrend channels, reducing the frequency of trades).
- Volatility Adjustment Factors: 5 for SuperTrend 1 and 7 for SuperTrend 2 (higher adjustment factors increase the responsiveness to changes in market volatility).
- Hold Days: 5 (defines the minimum duration a position is held, ensuring trades are not exited prematurely).
- Take Profit: 30% (sets the target profit level to lock in gains).
- Stop Loss: 20% (sets the maximum acceptable loss level to mitigate risk).
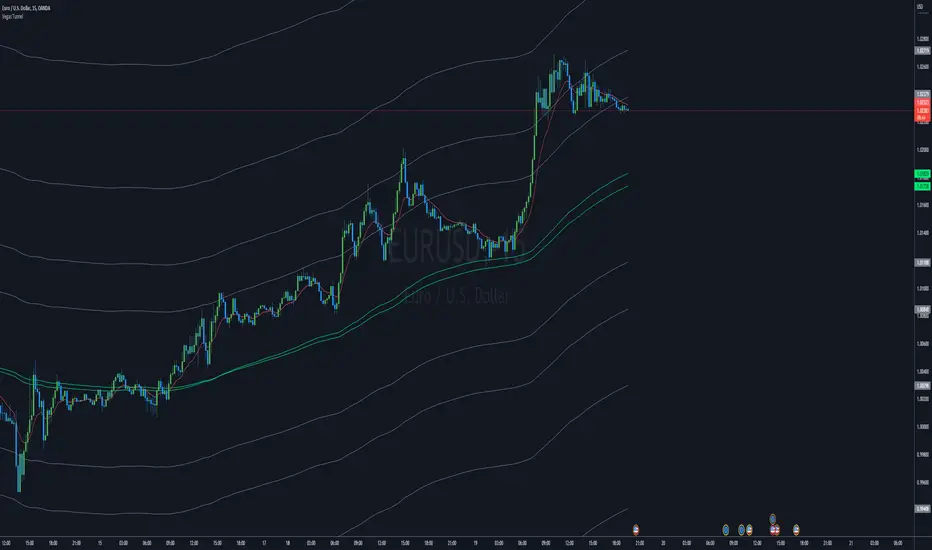
Vegas

Vegas TunnelThis indicator is based on the "Vegas Tunnel" system from FTMO, please check out their site here for some good documentation: ftmo.com
I give FTMO full credit for this indicator, all I did here was make it easy to throw it up on a chart.
Personally, I've had some success trading with this method. I encourage doing some back and forward testing to see if it is something that would fit your trading style.
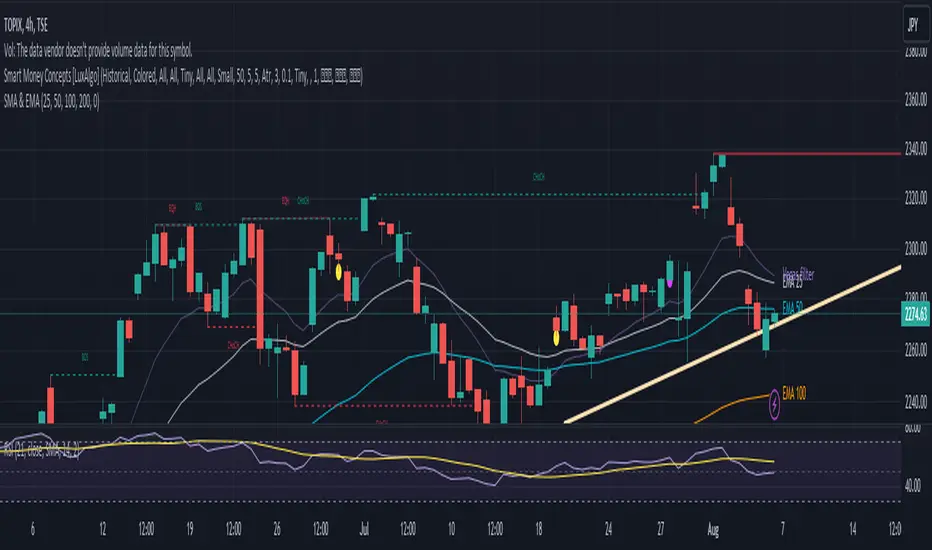
Vegas channelsThis indicator can plot vegas channel and EMA20. You can choose which time frame of the channels to display and also which channel to display, it can only show one channel and also two or three at the same time.

Customized Multi EMAPlot several EMA with only one script.
Default EMA: 20、50、100、200.
All of these are adjustable.
Also, Vegas tunnel and filter line can be presented or not according to your needs.
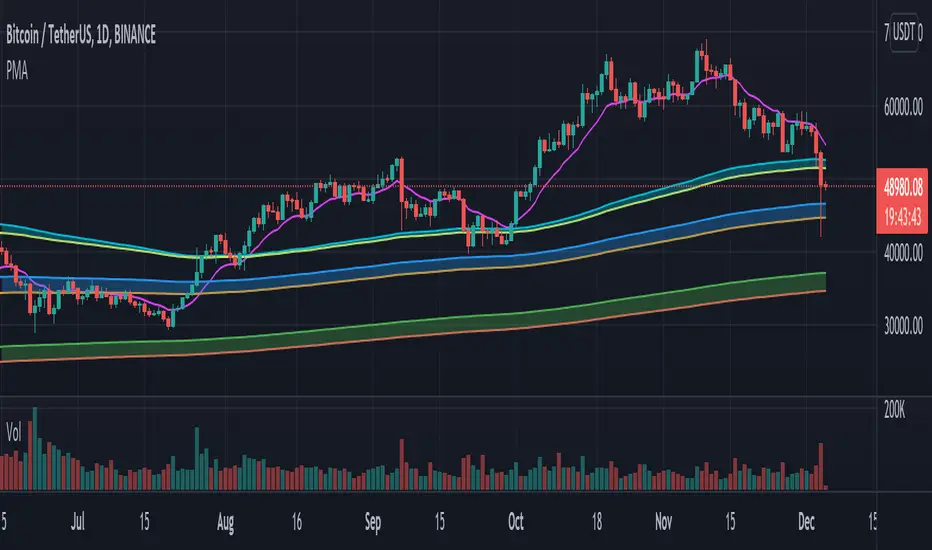
Vegas+200+Big Vol by RSU1. Vegas channel
The Vegas channel indicator is very effective as a short, medium and long-term trend observation indicator, and it has obvious support and resistance functions.
2. EMA200+MA200
Usually ema200 or ma200 is used as a watershed for fund institutions to evaluate the long-short trend of a stock trend.
3. Big volume box
Big volume is often used as a signal of a market trend turning,if it is greater than 4 times standard deviation it is marked as a Big volume in yellow box. There will be support and resistance at this price range.

Pulu's Moving AveragesPulu's Moving Averages
This script allows you to customize sets of moving averages. It is configured default as 3 Vegas tunnels + an MA12. You can re-configure it for any of your moving average studies. At the first release, it supports up to 7 moving averages, many parameters, and eight types of algorithms:
ALMA, Arnaud Legoux Moving Average
EMA, Exponential Moving Average
RMA, Adjusted exponential moving average (aka Wilder’s EMA)
SMA, Simple Moving Average
SWMA, Symmetrically-Weighted Moving Average
VWAP, Volume-Weighted Average Price
VWMA, Volume-Weighted Moving Average
WMA, Weighted Moving Average
If you are looking for only 3 moving averages, there is another script "Pulu's 3 Moving Averages".
Vegas Tunnel strategyApply Vegas Tunnel,
Use EMA144 169 as medium-term trend support
Also use EMA 576 676 and 4 multiples of 144 and 169 as long-term support and trend direction
Also increase EMA 36 43 as a short-term trend support
Suitable for stocks, indices, commodities
The applicable time scale can back-test the usability of the strategy by itself, and select the most applicable target
Introduction to current trading strategy:
According to the trend, the price will enter the market when it touches the support of each stage. When it touches the bollinger bands, it is Squeeze. Hold until it leaves the bollinger bands
But the trading strategy can be more optimized, see the code for details

Tunnel equalityHello all. This is a simply indicator to be used in conjunction with my Vegas tunnel script. The histogram indicates the change in the distance between the 2 moving averages that make up the Vegas tunnel.
When the histogram starts to fall or rise, it means that momentum is changing and can be an early warning signal to watch out for what Vegas describes as equality. Please research his material on line to learn more.
Enjoy!
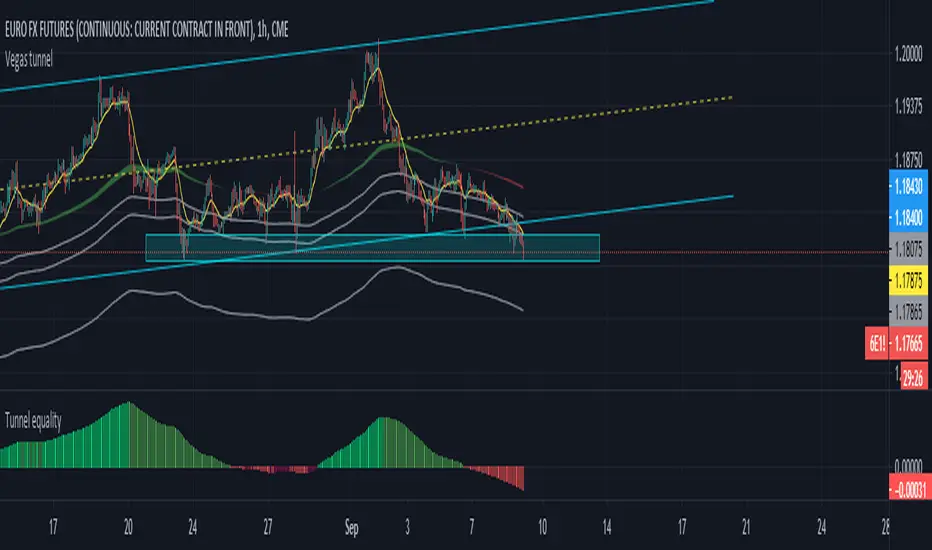
Vegas tunnelHi all,
This is the first step in putting together a more comprehensive suite of indicators and strategies based around the original Vegas tunnel method.
You will need to know what that is before trying to use this indicator. I would implore you to take the time to read the document. It's free to the universe and is a very valuable piece of work in my opinion.
Here is the link to the original documentation dl.fxf1.com
This indicator is set up to use the original levels as described by Vegas. Future releases will allow for more custom levels.
A note on the target waves. Vegas gives us the levels of 55, 89 and 233...all in FX pips. You will need to adjust that for your instrument and it is your personal preference. If you are using BTC , you might use $55, $89 etc, for ETH $5.50, $8.90 etc, for S+P 55, 89, 233 or for FX, the number might be 0.0055 etc
The indicator has been left blank so you can fill the target waves in yourself.
A note on the templates
The original template is simply as Vegas described it in his document, change it as you wish
The TD template comes from where I first was introduced to the concept. I can't mention the full source here, but some of you will know to what I am referring to. A massive thanks to TD for all the material they have provided the world.
The HH (Hero Hedge) template is just my way of looking at the wave. It's green when the faster MA is above the slower MA and red for the opposite. It doesn't really mean much, it's just a visual reference. Perhaps you can use it to filter signals if you so wish.
Finally, some of you may notice that I am an amateur coder at best. If you think you can improve or tidy up the code, then by all means, please reach out and collaborate with me.
I am trying to produce something to the benefit of all. I hope this can help you. If it does, then please pay it forward as I am trying to do.
Hero Hedge.
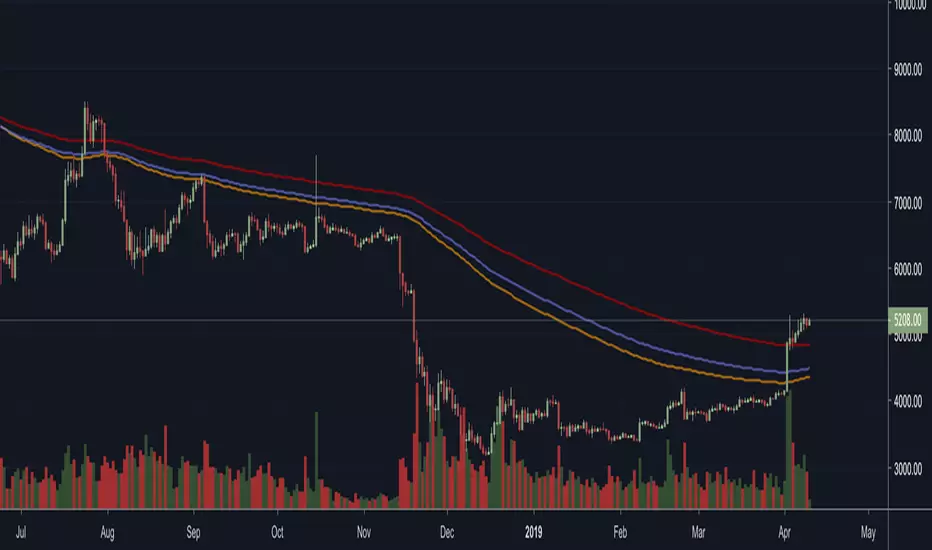
Vegas Double TunnelAdding another two EMA 288 338 to the classical Vegas Tunnel, which helps traders identify the relationship between major trend and moderate trend. When the space between two tunnel narrows down, it indicates the changing of the trend and potential reverse of the price. Double Tunnel offsets the limitations of Original Vegas Tunnel. Traders can corporate other moving averages with Double Tunnel. Good Luck!


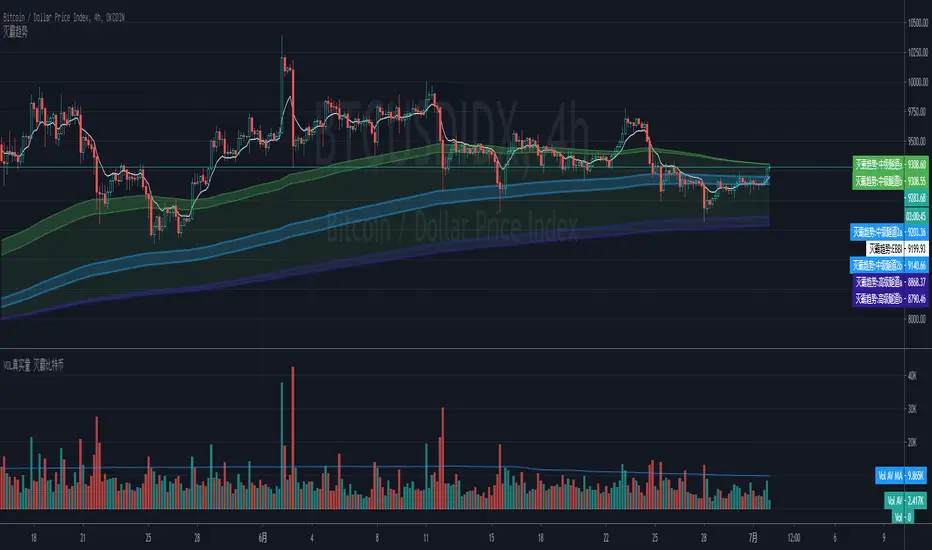
Bithanos Vegas Tunnel 灭霸比特币
1.VEGAS 隧道交易法,是经典的趋势交易方法,其中核心就是ema144 ema169,也就是我图中的绿色中级隧道,价格上穿 ema144-169形成的隧道,容易形成上涨趋势,价格下穿ema144-169形成的隧道,容易形成下跌趋势,但是为了过滤一些杂波信息,我们用EBBI指标去过滤杂波,EBBI上穿 ema144-169形成的隧道,容易形成更稳健的上涨趋势,EBBI下穿 ema144-169形成的隧道,容易形成更稳健的下跌趋势,在数字货币交易中,单纯看盘的话,我建议1h周期,4h周期都可以用来判断趋势。其他市场需要结合合适的周期;
2.额外增加了boll,多周期sma,供需要的朋友使用;
1. VEGAS tunnel trading method is a classic trend trading method. The core is ema144 ema169, which is the green middle tunnel in my picture. The price passes through up the tunnel formed by ema144-169, which is easy to form an upward trend. The price goes through down ema144-169 to form The tunnel is easy to form a downward trend, but in order to filter some clutter information, we use the EBBI indicator to filter clutter. The EBBI passing through up ema144-169 is easy to form a more stable upward trend, and EBBI goes through down ema144-169 Tunnel, it is easy to form a more stable downward trend. In cryptocurrency transactions, if you simply look at the disk, I suggest that the 1h cycle and the 4h cycle can be used to judge the trend. Other markets need to combine suitable cycles;
2.Add boll band,multi-timeframe sma for extra,I hope it can help you;
Vegas Wave - MSSimple Vegas Wave implementation, all 3 EMA's in one indicator for those of you with indicator limitations :D
Vegas Tunnel V1.0Step 1: Create a 1 hour chart on whatever currency pairs interest. I personally use MT4 platform on Oanda to follow my trades. Overlay 3 time periods: 169 EMA, 144 EMA and a 12 period EMA ( all 1 hour.) The 144 and 169 EMA’s create the tunnel. The 12 EMA is the filter and crossover indicator.
Step 2. Fibonacci numbers are very crucial to trading with the tunnel especially 55,89,144, 233, and 377.
Step 3. Wait for the market to come into the tunnel “area”. When it breaks above the upper tunnel boundary, you go long. When it breaks below the lower tunnel boundary you go short.
Step 4. Stops and reverses are placed on the other side of the tunnel.
Step 5. As the market trades in your direction, you take partial profits at the successive Fib numbers. The final portion of your position is left on until one of the following conditions occur: 1) market hits the last Fib number 377 pips from the EMA’s or 2) the market eventually comes back to the tunnel and violates the other side.
Vegas used the following moving averages, as filters:
5-period Simple Moving Average (SMA)
12-period Exponential Moving Average (EMA)
21-period Exponential Moving Average (EMA)

Fibonacci Algo - LongAutomatic Fibonacci retracement entry, stop loss and extension target level as apart of a customisable strategy.
Automatic plots of 23.6% 38.2%, 50%, 61.8%, 65%, 78.6% and -23.6, -61.8% and -100% levels.
Customisable Fib Length - Time period over which max and min pivots are chosen.
Customisable Offsetfib - Offsets the pivots and sell zone as your entry position
will be some time after the upper and lower pivots are set.
Vegas Wave - Automatic plot. Shows price relative to wave and EMA crossover - See my 'Vegas Wave' code for more of an explanation.
A strategy based off buying the 50-618 with a defined stop loss the other side of the 65 or 786 can easily be formulated.
This tool will automatically plot those points but a defined Risk Management strategy will always be needed.
The 236 and 382 region can also be plotted, allowing for lesser retracements coinciding with wave 4 pullbacks ( Elliott Wave Traders).
Works best in Bullish trends but will work on all timeframes (Bullish correction in an downtrend also possible).
Previous pivots shown but be careful to identify which of the several pivots you are using.
Start at a larger timeframe and move down. (Entries consistent on several timeframes are golden)
Pivots and retracements are dynamic. Be sure to note your entry and targets.
Works well when used in combination with an oscillator which highlights Divergence.
Also refer to my other 'Fibonacci' Codes for more context.

Vegas Wave - BronzeThe bronze edition of my code will be the most basic of a series of Vegas Wave codes which I will publish.
EMA 144, 169, 233
Vegas Tunnel - Highlights the price band between the 144 and 169 EMA.
Identifies support and resistance areas
Target price bounces and aid identifying EW counts.
Wave 2 retrace through the waves. Wave 4 bounce off Vegas Tunnel for example.
Provides confluence when used with fib targets and other indicators.
Identify EMA cross-overs and price crosses.
Easy to customise colours and shading for all time periods.
Multiple indicators in one (for those with TV limits).
Silver/Gold versions
I will include highlights/alerts for EMA/Price crossovers.
I hope its helpful and hopefully the first of many scripts to come.
Feel free to leave ideas and tips for future versions.

