ICT HTF Volume Candles (Based on HTF Candles by Fadi)# ICT HTF Volume Candles - Multi-Timeframe Volume Analysis
## Overview
This indicator provides multi-timeframe volume visualization designed to complement price action analysis. It displays volume data from up to 6 higher timeframes simultaneously in a separate panel, allowing traders to identify volume spikes, divergences, and institutional activity without switching between timeframes.
**Original Concept Credits:** This indicator builds upon the HTF Candles framework by Fadi, adapting it specifically for volume analysis with enhanced features including gap-filling for extended hours, multiple scaling methods, and advanced synchronization.
## What Makes This Script Original
### Key Innovations:
1. **Three Volume Scaling Methods:**
- **Per-HTF Auto Scale:** Each timeframe scales independently for detailed comparison
- **Global Auto Scale:** All timeframes use unified scale for relative volume comparison
- **Manual Scale:** User-defined maximum for consistent analysis across sessions
2. **Bullish/Bearish Volume Differentiation:**
- Volume bars colored based on price movement (close vs open)
- Separate styling for bullish (green) and bearish (red) volume periods
- Helps identify whether volume supports price direction
3. **Advanced Time Synchronization:**
- Custom daily candle open times (Midnight, 8:30 AM, 9:30 AM ET)
- Timezone-aware calculations for New York trading hours
- Real-time countdown timers for each timeframe
- **Gap-filling technology** for continuous display during extended hours and weekends
4. **Flexible Display Options:**
- Configurable spacing and positioning
- Label placement (top, bottom, or both)
- Day-of-week or time interval labels on candles
- Works reliably in backtesting and live trading
## How It Works
### Volume Calculation
The indicator uses `request.security()` with optimized parameters to fetch volume data from higher timeframes:
- **Volume Open/High/Low/Close (OHLC):** Tracks volume changes within each HTF candle
- **Color Logic:** Compares HTF close vs open prices to determine bullish/bearish classification
- **Alignment:** All volume bars share a common baseline for easy visual comparison
- **Gap Handling:** Uses `gaps=barmerge.gaps_off` to maintain continuity during non-trading hours
### Technical Implementation
```
1. Monitors HTF timeframe changes using request.security() with lookahead
2. Creates new VolumeCandle object when HTF bar opens
3. Updates current candle's volume H/L/C on each chart bar
4. Applies selected scaling method to normalize display height
5. Repositions all candles and labels on each bar update
6. Fills gaps automatically during extended hours for consistent display
```
### Scaling Methods Explained
**Method 1 - Auto Scale per HTF:**
Each timeframe displays volume relative to its own maximum. Best for identifying patterns within each individual timeframe.
**Method 2 - Global Auto Scale:**
All timeframes share the same scale based on the highest volume across all HTFs. Best for comparing relative volume strength between timeframes.
**Method 3 - Manual Scale:**
User sets maximum volume value. Best for maintaining consistent scale across different trading sessions or instruments.
## How to Use This Indicator
### Setup
1. Add indicator to your chart (it appears in a separate panel below price)
2. Configure up to 6 higher timeframes (default: 5m, 15m, 1H, 4H, 1D, 1W)
3. Set number of candles to display for each timeframe
4. Choose volume scaling method based on your analysis needs
5. Enable "Fix gaps in non-trading hours" for extended hours trading (enabled by default)
### Interpretation
**Volume Spikes:**
- Sudden increase in volume height indicates institutional activity or strong conviction
- Compare volume between timeframes to identify where the real money is moving
- Look for volume spikes that appear across multiple timeframes simultaneously
**Bullish vs Bearish Volume:**
- **Green volume bars:** Price closed higher (buying pressure)
- **Red volume bars:** Price closed lower (selling pressure)
- High green volume during uptrend = confirmation of strength
- High red volume during downtrend = confirmation of weakness
- High volume opposite to trend = potential reversal warning
**Multi-Timeframe Context:**
- **5m/15m:** Scalping and day trading activity
- **1H/4H:** Swing trading and intraday institutional flows
- **Daily/Weekly:** Major position building and long-term trends
**Divergences:**
- Price making new highs but volume declining = weakening trend
- Volume increasing while price consolidates = potential breakout brewing
- Price breaks level but volume doesn't confirm = likely false breakout
### Practical Examples
**Example 1 - Institutional Confirmation:**
Price breaks above resistance. Check volume across timeframes:
- 5m shows spike = retail interest
- 15m + 1H + 4H all show spikes = institutional confirmation
- **Trade confidence: HIGH**
**Example 2 - False Breakout Detection:**
Price breaks resistance with:
- High volume on 5m only
- Normal/low volume on 1H and 4H
- **Interpretation:** Likely retail trap, institutions not participating
- **Action:** Wait for pullback or avoid
**Example 3 - Accumulation Phase:**
Price ranges sideways but:
- Daily volume gradually increasing
- Weekly volume above average
- **Interpretation:** Smart money accumulating
- **Action:** Prepare for breakout in direction of volume
**Example 4 - Volume Divergence:**
Price makes new high:
- Current high has lower volume than previous high across all timeframes
- **Interpretation:** Weakening momentum
- **Action:** Consider profit-taking or reversal trade
## Configuration Parameters
### Timeframe Settings
- **HTF 1-6:** Select timeframes (must be higher than chart timeframe)
- **Max Display:** Number of candles to show per timeframe (1-50)
- **Limit to Next HTFs:** Display only first N enabled timeframes (1-6)
### Styling
- **Bull/Bear Colors:** Separate colors for body, border, and wick
- **Padding from current candles:** Distance offset from live price action
- **Space between candles:** Gap between individual volume bars
- **Space between Higher Timeframes:** Gap between different timeframe groups
- **Candle Width:** Thickness of volume bars (1-4, multiplied by 2)
### Volume Settings
- **Volume Scale Method:** Choose 1, 2, or 3
- 1 = Auto Scale per HTF (each TF independent)
- 2 = Global Auto Scale (all TF unified)
- 3 = Manual Scale (user-defined max)
- **Auto Scale Volume:** Enable/disable automatic scaling
- **Manual Scale Max Volume:** Set maximum when using Method 3
### Label Settings
- **HTF Label:** Show/hide timeframe names with color and size options
- **Label Positions:** Display at Top, Bottom, or Both
- **Label Alignment:** Align centered or Follow Candles
- **Remaining Time:** Show countdown timer until next HTF candle
- **Interval Value:** Display day-of-week or time on each candle
### Custom Daily Candle
- **Enable Custom Daily:** Override default daily candle timing
- **Open Time Options:**
- **Midnight:** Standard 00:00 ET daily open
- **8:30 AM:** Align with economic data releases
- **9:30 AM:** Align with NYSE market open
- Useful for specific trading strategies or market alignment
### Advanced Settings
- **Fix gaps in non-trading hours:** Maintains alignment during extended hours and weekends (recommended: ON)
- Prevents visual gaps during forex weekend closures
- Ensures consistent display during crypto 24/7 trading
- Improves backtesting reliability
## Best Practices
1. **Pair with Price Action:** Use alongside HTF price candles indicator for complete picture
2. **Start Simple:** Enable 2-3 timeframes initially (e.g., 15m, 1H, 4H), add more as needed
3. **Match Settings:** Use same candle width/spacing as companion price indicator for visual alignment
4. **Scale Appropriately:**
- Use **Global scale** (Method 2) when comparing timeframes
- Use **Per-HTF scale** (Method 1) for pattern analysis within each timeframe
- Use **Manual scale** (Method 3) for consistent day-to-day comparison
5. **Watch for Volume Clusters:** High volume appearing simultaneously across multiple HTFs signals significant market events
6. **Confirm Breakouts:** Always check if volume supports the price movement across higher timeframes
7. **Extended Hours:** Keep "Fix gaps" enabled for 24/7 markets (Forex, Crypto) and weekend analysis
## Technical Notes
- **Timezone:** All calculations use America/New_York timezone for consistency
- **Real-time Updates:** Volume and timers update on each tick during market hours
- **Performance:** Optimized with max_bars_back=5000 for extensive historical analysis
- **Compatibility:** Works on all instruments with volume data (Stocks, Forex, Crypto, Futures)
- **Gap Handling:** Uses `barmerge.gaps_off` to fill data gaps during non-trading periods
- **Backtesting:** Uses `lookahead=barmerge.lookahead_on` for stable historical data without repainting
- **Data Continuity:** Automatically handles market closures, weekends, and extended hours
## Updates & Improvements
**Version 2.0 (Current):**
- ✅ Fixed alignment issues during extended hours and weekends
- ✅ Eliminated repainting in backtesting
- ✅ Added gap-filling technology for continuous display
- ✅ Improved data synchronization across all timeframes
- ✅ Enhanced NA value handling for data integrity
- ✅ Added advanced settings group for user control
## Support
For questions, suggestions, or feedback, please comment on the publication or message the author.
---
**Disclaimer:** This indicator is for educational and informational purposes only. It does not constitute financial advice. Past performance is not indicative of future results. Always perform your own analysis and implement proper risk management before making trading decisions.
Volumeconfirmation

Impulse Range Compression & Expansion (IRCE)📌 Impulse Range Compression & Expansion (IRCE) – Visualizing Price Traps Before Breakouts
📖 Overview
The IRCE Indicator is a precision breakout detection tool designed to identify consolidation traps and price coil zones before expansion moves occur. Unlike traditional volatility indicators that rely solely on statistical thresholds (e.g., Bollinger Bands or ATR), IRCE focuses on behavioral price compression, detecting tight-range candle clusters and validating breakouts through body expansion and/or volume surges.
This makes it ideal for traders looking to:
• Catch breakouts from range traps
• Avoid choppy and premature signals
• Spot early-stage momentum moves based on clean price behavior
⸻
⚙️ How It Works
1. Impulse Range Compression Detection
• Measures the high-low range of each candle
• Compares it to a user-defined average range (default 7 bars)
• Flags candles where the range is significantly smaller (e.g., <60% of average)
• Groups these into tight clusters, indicating compression zones or potential “trap ranges”
2. Cluster Box Construction
• When a valid cluster (e.g., 3 or more tight candles) is detected, the indicator:
• Marks the high and low of the cluster
• Draws a shaded box over this “trap zone”
• This helps visually track where price has coiled before a breakout
3. Breakout Confirmation Logic
A breakout from the trap zone is only validated when:
• Price closes above the cluster high (bullish) or below the cluster low (bearish)
• One or both of the following confirm strength:
• Body Expansion: Current candle body is 120%+ of recent average
• Volume Expansion: Volume exceeds recent volume average
4. Optional Trend Filter
• An optional EMA filter (default: 50 EMA) ensures breakout signals align with trend direction
• Helps filter out countertrend noise in ranging markets
5. Signal Cooldown
• Prevents repeated signals by enforcing a cooldown period (e.g., 10 bars) between entries
⸻
🖥️ Visual Elements
• 📦 Yellow compression boxes represent tight price traps
• 🟢 Buy labels appear when price breaks above the trap with confirmation
• 🔴 Sell labels appear when price breaks below with confirmation
• All visuals are non-repainting and updated in real-time
🧠 How to Use
1. Wait for a yellow trap box to appear
2. Watch for a confirmed breakout from the trap zone
3. Take the trade in the direction of the breakout:
• Only if it satisfies body or volume confirmation
• And if trend alignment is enabled, it must match EMA direction
4. Place stops just outside the opposite end of the trap zone
5. Use risk/reward ratios or structure levels for exits
This logic works great on:
• Lower timeframes (scalping breakouts)
• Higher timeframes (detecting price coiling before major moves)
• Any market: Stocks, Crypto, FX, Commodities
⸻
🔒 Technical Notes
• ✅ No repainting
• ✅ No future-looking logic
• ✅ Suitable for both discretionary and systematic traders
• ✅ Built in Pine Script v6

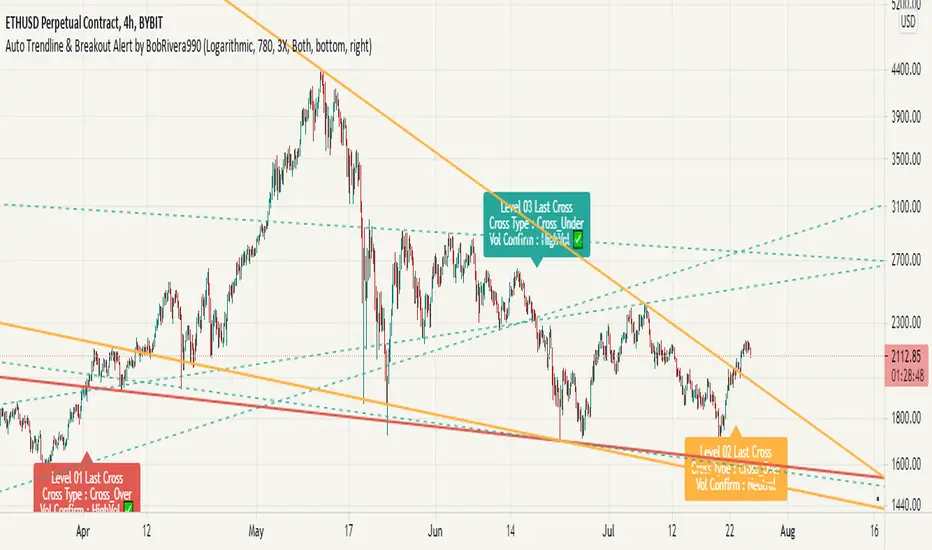
Auto Trendline & Breakout Alert(Linear / Log) Full-VersionContents
Overall Introduction
Does it repaint?
Features
Settings menu parameters
How to setup
Limits
Errors and Performance
Examples
Overall Introduction
This indicator is the best tool for breakout traders.
Drawing and evaluating the trend lines of multiple charts in different time frames is a very time-consuming and tedious task. In addition, being aware of breakouts in the shortest possible time requires constant monitoring.
With this tool, you can draw and classify trend lines in a fraction of a second and by placing an alert on any chart, you can receive notifications about breakouts, wherever you are.
The classification of trend lines is done based on the reaction of the price chart to the trend lines and the analysis of the trading volume.
This indicator is designed to reclassify trend lines with each reaction of the price chart. These lines are classified into 6 levels and these levels are distinguished by different colors. Thus, any touching or crossing of the price chart can make a difference.
Does it repaint?
Any tool that shows trend lines must repaint because trend lines are constantly changing. Some lines lose their strength and new ones are formed, so some lines should be removed and replaced with new lines and that means repainting.
The indicator should reflect the latest changes. So while repainting is a bad thing in a strategy, it is essential in this indicator.
This indicator is designed to reclassify trend lines with each reaction of the price chart. Thus, any touching or crossing of the price chart can make a difference.
Note that unlike alerts, breakout labels are not trading signals:
Breakout labels show the latest breakout for each level based on the lines that appear on the chart, so they may repaint or have delay.
But Alerts work differently, Alerts are triggered when one of the trend lines is broken and then the next candle is opened and has no any delay.
Features
This indicator is designed for use on both linear and logarithmic scales. It works linearly by default. If you are using a logarithmic chart, enter the settings menu and set the chart scale parameter to “Log”.
The indicator is equipped with the volume status tool to identify and avoid false breakouts. Note that you can't completely avoid false breakouts, but you can minimize risk and loss. I have already published volume status as a separate script.
Several filters are provided to customize alerts. You can limit alerts based on the level and strength of broken trend lines, volume status, and type of breakout (Cross-Over, Cross-Under, or both).
The last breakouts panel gives an overview of the current market situation. You can activate it in the settings menu. the figure below shows the panel:
Settings menu parameters
{Chart Scale …} =>
Set it according to the chart. If you are using a linear chart, select the "Linear" option or if you are using a logarithmic chart, select the "Log" option
{Max Operational Range Length ...} =>
This parameter specifies the number of candles processed by the indicator (By default, the last 1000 bars)
{Filter Out-Of-Range Lines} =>
The filter removes diverging or out-of-range lines and reduces the clutter of the chart
{Visible Trend Lines ...} =>
In this section you can specify which level of trend lines should be visible. Level 1 contains the strongest lines and level 6 contains the weakest.
{Alert Condition 01 _ Trendline Levels} =>
In this section, you can specify which level of trend lines will trigger an alert after the breakout. This section has been added to customize alerts.
{Alert Condition 02 _ Cross Type} =>
In this section, you can limit alerts based on the type of breakout (Cross-Over, Cross-Under or both). This section has been added to customize alerts.
{Alert Condition 03 _ Volume Status} =>
In this section, you can limit alerts by volume to avoid fake breakouts. This section has been added to customize alerts.
{Last Breakout Label} =>
In this section, you can enable or disable the last breakout labels.
{Panel} =>
In this section, you can enable or disable the last breakout panel or set its position on the chart.
How to setup
There are many parameters in the settings menu, but two are more important. One is “Chart Scale” and the other is the “Max Operational Range Length".
Set the “chart scale” parameter according to the chart, otherwise the trend lines drawn by the indicator do not match the price chart.
If you are using a linear chart, select the "Linear" option or if you are using a logarithmic chart, select the "Log" option.
Max Operational Range Length Limits the range of the price chart that is processed by the indicator.
By increasing this parameter:
The strength and durability of the trend lines increases.
The number of breakout signals decreases.
The importance of breakout signals increases.
The indicator processing load increases.
In the following figure, you can see the effects of increasing the “Max Operational Range Length" parameter:
Limits
Since this indicator makes extensive use of trading volume, it is necessary to use a chart with volume information.
But if the volume information is not provided by the vendor, indicator will continue to work based on the price chart only, and a warning message will be displayed below the chart to let you know.
Errors and Performance
The performance of this indicator depends on the “Max Operational Range Length” parameter in the settings menu because it performs calculations, within a range with the length of this parameter.
By increasing this parameter, the processing load increases. Sometimes you may encounter the following error: “Loop takes too long to execute (>200 ms)”
If you see this error, do one of the following:
Reduce the “Max Operational Range Length”.
Reset the indicator. To do this, double-click on the “Hide” button in front of the indicator name.
Examples
EURUSD (FX:EURUSD) – 1D // Scale: Logarithmic, Max Range Length = 1000, Filter: 2X
NASDAQ 100 (CME_MINI:NQ1!) - 1D // Scale: Logarithmic, Max Range Length = 700
GOLD (COMEX:GC1!) – 1D // Scale: Logarithmic, Max Range Length = 650, Filter: 2X
NATURAL GAS (NYMEX:NG1!) – 1D // Scale: Logarithmic, Max Range Length = 625, Filter: 4X
AMAZON (NASDAQ:AMZN) – 1D // Scale: Logarithmic, Max Range Length = 1750, Filter: 2X
APPLE INC (NASDAQ:AAPL) – 1D // Scale: Logarithmic, Max Range Length = 340, Filter: 4X
GBPUSD (FX:GBPUSD) – 1D // Scale: Logarithmic, Max Range Length = 1000, Filter: 3X
SILVER (COMEX:SI1!) – 1D // Scale: Logarithmic, Max Range Length = 550, Filter: 3X
BITCOIN (KUCOIN:BTCUSDT) – 4H // Scale: Logarithmic, Max Range Length = 1250, Filter: 3X
MICROSOFT (NASDAQ:MSFT) – 1D // Scale: Logarithmic, Max Range Length = 340, Filter: 4X
TOTAL (CRYPTOCAP:TOTAL) – 2H // Scale: Logarithmic, Max Range Length = 1075, Filter: 3X
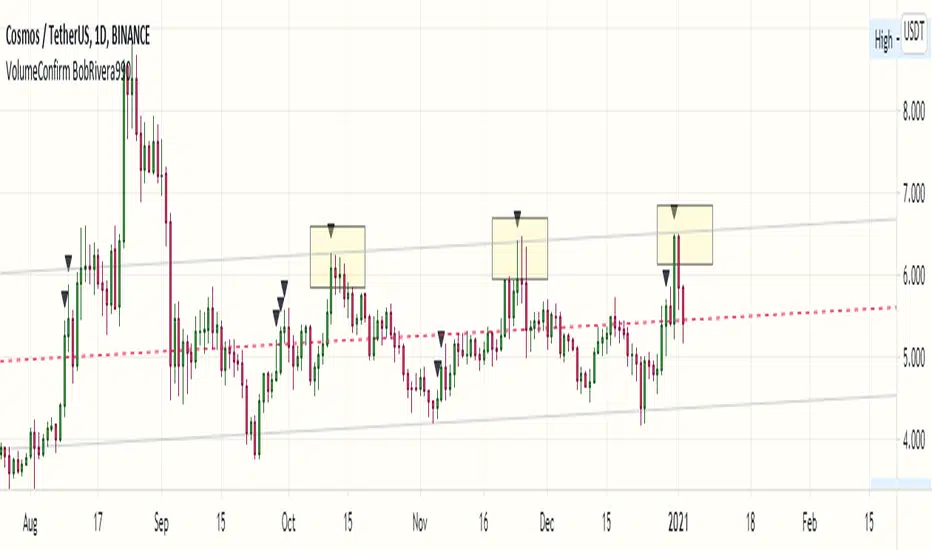
Volume Status by BobRivera990This indicator is a tool that shows a relative view of the trading volume and classifies the volume into 5 different levels and makes it easy to compare it in different periods.
It is also specifically designed for detecting failed (fake) breakouts.
How it works?
This tool uses something similar to Bollinger Bands , but with more bands.
I used two standard deviations (positive and negative) on either side of a simple moving average ( SMA ) of the trading volume .
I also used twice the standard deviation (negative and positive) on either side of the SMA to create more bands.
The classification is made as follows:
Usage:
This indicator is a tool to compare the volume , relatively and in different periods. It is also a good tool for detecting failed (fake) breakouts.
Fake Breakouts Occurs when a support or resistance is broken but the market does not accept and support these price changes. This lack of support will cause trading volume to decrease during or after the breakout.
So, if the indicator shows Low-Volume or Minor-Volume status at the time of the breakout or right after that, it may be a fake breakout.
The truth is you cannot avoid false breakouts completely as long as you trade breakouts but you can minimize the risk and the loss.
Thank you all for forming this unique community.
Parameters:
" Volume SMA Length " => The length of the simple moving average of the Volume

Volume Confirmation Signal by BobRivera990The purpose of this script is to determine the response of trading volume to price action
This is not an indicator but a set of four signals
1 - Bullish Strength Signal (Upward Green Triangle) :
If the resistance is broken at the same time is valid
this signal indicates the continuation of the bullish trend
the trading volume is relatively high.
If the bar is closed above the resistance level, It will probably turn into support.
2 - Bullish Reversal Signal (Upward Black Triangle) :
if the bar is closed above the support level is valid
this signal indicates trend reversal after a bearish candle
the trading volume is very high.
3 - Bearish Strength Signal (Downward Red Triangle) :
If the Support is broken at the same time is valid
this signal indicates the continuation of the bearish trend
the trading volume is relatively high.
If the bar is closed below the support level, It will probably turn into resistance.
4 - Bearish Reversal Signal (Downward Black Triangle) : if the bar is closed below the resistance level is valid
this signal indicates trend reversal after a bullish candle
the trading volume is very high.
DVI BandsA new idea of mine that I am presently experimenting on for my trades.
The DVI bands is based on my previously published DVI script:
The Directional Volume Index (DVI) is defined as follows:
DVI = VWMA (len1) - SMA (len2), where by default, len1==len2
The position of the DVI above/below the current price provides volume confirmation of the direction of the price trend.
The magnitude of the DVI above/below the current price provides the volume confirmation of the strength of the price trend.
The stdev band is derived from the DVI where:
The DVI piercing the Stdev boundary suggests a significant move in the corresponding direction.
Tightening of the DVI-Stdev bands can suggest the possible incoming of major move ahead.
The novel aspects and principles of this indicator and this source code are the property of © cybernetwork.

Directional Volume Index (DVI) {PREMIUM}This script is a complete analysis package based on the Directional Volume Index (DVI).
The Directional Volume Index (DVI) is defined as follows:
DVI = VWMA (len1) - SMA (len2), where by default, len1==len2
The sign of the DVI provides volume confirmation of the direction of the price trend.
The magnitude of the DVI provides the volume confirmation of the strength of the price trend.
The higher-order oscillator, ADO, derived from the DVI, aids with the prediction of probable next move.
---
Here, the main oscillator (main-OSC) is the RSI modulated by the DVI (default). The RSI mode can be disabled to revert to a normal DVI oscillator for the main-OSC.
When the main-OSC (thicker line) is > 0, it is green; and if it is < 0, it is red.
Accompanying the main-OSC is its purple Moving Average (MA) line (VWMA-mode is set as the default, but user can choose to switch to SMA-mode). The crossing of the main-oscillator into its MA-line signals a significant turn in the main-OSC, similar to how the cross between MAs are being used to signal a golden/death-cross (example: main-OSC crossing down its MA-line indicates a probable shift into the bearish phase).
The DVI can be re-scaled and whenever its value > 100, a background fill between the oscillator and the zeroline appear to indicates overbought condition; and < -100 indicates oversold condition. The user can tweak the scaling factor to optimize this for a given chart and timeframe.
A proprietary asymmetric differential oscillator (ADO) is also implemented, which is modulated by the main-OSC. When this (thinner line) secondary oscillator is > 0, it is yellow; and when it is < 0, it is lavender. The user can select the order of the differential (i.e. Order 1 = Momentum, Order 2 = Acceleration, Order 3 = Jerk, Order 4 = Snap, Order 5 = Crackle, Order 6 = Pop). This oscillator provides details of the more subtle underlying/hidden trends that is emerging or brewing, and may hint of an incoming move ahead of time. Divergence in the sign and slope of this secondary oscillator with respect to the main-OSC may provide a useful edge for trade setup.
A (thick transparent light blue) volume oscillator is also provided. An increase in volume trend provides confirmation of (or solidifies) the movements in the main-OSC over that period. A falling volume oscillator trend raises doubts on the main-OSC trend, and hints of the possibility of a counter-trend (also look at the secondary ADO oscillator for clues).
Two set of divergence and hidden divergence indicators have been added. They can be enabled/disabled, and users can link them to specific oscillators of their choosing.
The novel aspects and principles of this indicator and this source code are the property of © cybernetwork.

Directional Volume IndexA new idea of mine that I am presently experimenting on for my trades.
The Directional Volume Index (DVI) is defined as follows:
DVI = VWMA(len1) - SMA(len2), where by default, len1==len2
The sign of the DVI provides volume confirmation of the direction of the price trend.
The magnitude of the DVI provides the volume confirmation of the strength of the price trend.
The novel aspects and principles of this indicator and this source code are the property of © cybernetwork.
This indicator and script is free for the TV community to use.
