@subitrades AIO IndicatorAll In One Indicator by @subitrades
-Initial Balance
-Trading Sessions
-Monday High
-Monday Low
-VAH
-VAL
-POC
-Fibonacci
-VWAP
Vp

Volume Profile Visible Range (VPVR) with POC PriceThis script visualizes volume distribution for the bars currently visible on your chart, helping you identify key liquidity zones and high-traffic price levels.
Main Features:
・Dynamic Range: Recalculates automatically as you zoom or scroll.
・POC Price Label: Highlights the Point of Control (highest volume) with a clear price tag.
・Value Area (VA): Visually separates the most active trading zone (default 70%).
・Highly Flexible: Choose your preferred layout (Left or Right) and colors.
How to use:
1. Spot S/R Levels: Look for long bars (High Volume Nodes); these often act as strong support or resistance.
2. Monitor the POC: The Point of Control is a price magnet. Watch for reactions or retests at this level.
3. Low Volume Gaps: Price tends to move quickly through areas with very short volume bars.

Volume Profile + Pivot Levels [ChartPrime]⯁ OVERVIEW
Volume Profile + Pivot Levels combines a rolling volume profile with price pivots to surface the most meaningful levels in your selected lookback window. It builds a left-side profile from traded volume, highlights the session’s Point of Control (PoC) , and then filters pivot highs/lows so only those aligned with significant profile volume are promoted to chart levels. Each promoted level extends forward until price retests it—so your chart stays focused on levels that actually matter.
⯁ KEY FEATURES
Rolling Volume Profile (Period & Resolution)
Calculates a profile over the last Period bars (default 200). The profile is discretized into Volume Profile Resolution bins (default 50) between the highest high and lowest low inside the window. Each bin accumulates traded volume and is drawn as a smooth left-side polyline for compact, lightweight rendering.
HL = array.new()
// collect highs/lows over 'start' bars to define profile range
for i = 0 to start - 1
HL.push(high ), HL.push(low )
H = HL.max(), L = HL.min()
bin_size = (H - L) / bins
// accumulate per-bin volume
for i = 0 to bins - 1
for j = 0 to start - 1
if close >= (L + bin_sizei) - bin_size and close < (L + bin_size*(i+1)) + bin_size
Bins += volume
Delta-Aware Coloring
The script tracks up-minus-down volume across all period to compute a net Delta . The profile, PoC line, and PoC label adopt a teal tone when net positive, and maroon when net negative—an immediate read on buyer/seller dominance inside the window.
Point of Control (PoC) + Volume Label
Automatically marks the highest-volume bin as the PoC . A horizontal PoC line extends to the last bar, and a label shows the absolute volume at the PoC. Toggle visibility via PoC input.
Pivot Detection with Volume Filter
Identifies raw pivots using Length (default 10) on both sides of the bar. Each candidate pivot is then validated against the profile: only pivots that land within their bin and meet or exceed the Filter % threshold (percentage of PoC volume) are promoted to chart levels. This removes weak, low-participation pivots.
// pivot promotion when volume% >= pivotFilter
if abs(mid - p.value) <= bin_size and volPercent >= pivotFilter
// draw labeled pivot level
line.new(p.index - pivotLength, p.value, p.index + pivotLength, p.value, width = 2)
Forward-Extending, Self-Stopping Levels
Promoted pivot levels extend forward as dotted rays. As soon as price intersects a level (high/low straddles it), that level stops extending—so your chart doesn’t clutter with stale zones.
Concise Level Labels (Volume + %)
Each promoted pivot prints a compact label at the pivot bar with its bin’s absolute volume and percentage of PoC volume (ordering flips for highs vs. lows for quick read).
Lightweight Visuals
The volume profile is rendered as a smooth polyline rather than dozens of boxes, keeping charts responsive even at higher resolutions.
⯁ SETTINGS
Volume Profile → Period : Lookback window used to compute the profile (max 500).
Volume Profile → Resolution : Number of bins; higher = finer structure.
Volume Profile → PoC : Toggle PoC line and volume label.
Pivots → Display : Show/hide volume-validated pivot levels.
Pivots → Length : Pivot detection left/right bars.
Pivots → Filter % 0–100 : Minimum bin strength (as % of PoC) required to promote a pivot level.
⯁ USAGE
Read PoC direction/color for a quick net-flow bias within your window.
Prioritize promoted pivot levels —they’re backed by meaningful participation.
Watch for first retests of promoted levels; the line will stop extending once tested.
Adjust Period / Resolution to match your timeframe (scalps → higher resolution, shorter period; swings → lower resolution, longer period).
Tighten or loosen Filter % to control how selective the level promotion is.
⯁ WHY IT’S UNIQUE
Instead of plotting every pivot or every profile bar, this tool cross-checks pivots against the profile’s internal volume weighting . You only see levels where price structure and liquidity overlap—clean, data-driven levels that self-retire after interaction, so you can focus on what the market actually defends.

.srb suiteThe essential suite Indicator.
that are well integrated to ensure visibility of essential items for trading.
it is very cumbersome to put symbol in the Tradingview chart and combine essential individual indicators one by one.
Moreover even with such a combination, the chart is messy and visibility is not good.
This is because each indicator is not designed with the others in mind.
This suite was developed as a composite-solution to that situation, and will make you happy.
designed to work in the same pane with open-source indicator by default.
Recommended visual order ; Back = .srb suite, Front = .srb suite vol & info
individually turn on/off only what you need on the screen.
BTC-agg. Volume
4 BTC-spot & 4 BTC-PERP volume aggregated.
It might helps you don't miss out on important volume flows.
Weighted to spot trading volume when using PERP+spot volume .
If enabled, BTC-agg.Vol automatically applied when selecting BTC-pair.
--> This is used in calculations involving volumes, such as VWAP.
Moving Average
1 x JMA trend ribbon ; Accurately follow short-term trend changes.
3 x EMA ribbon ; zone , not the line.
MA extension line ; It provide high visibility to recognize the direction of the MA.
SPECIAL TOOLS
VWAP with Standard Deviation Bands
VWAP ruler
BB regular (Dev. 2.0, 2.5)
BB Extented (Dev. 2.5, 3.0, 3.5)
Fixed Range Volume Profile ; steamlined one, performace tuned & update.
SPECIAL TOOLS - Auto Fibonacci Retracement - New GUI
'built-in auto FBR ' has been re-born
It shows - retracement Max top/ min bottom ; for higher visibility
It shows - current retracement position ; for higher visibility
The display of the Fib position that exceeds the regular range is auto-determined according to the price.
tradingview | chart setting > Appearance > Top margin 0%, Bottom margin 0% for optimized screen usage
tradingview | chart setting > Appearance > Right margin 57
.srb suite vol & info --> Visual Order > Bring to Front
.srb suite vol & info --> Pin to scale > No scale (Full-screen)
Visual order ; Back = .srb suite, Front = .srb suite vol & info
1. Fib.Retracement core is from tradingview built-in FBR ---> upgrade new-type GUI, and performance tuned.
2. Fixed-range volume-profile core is from the open-source one ---> some update & perf.tuned.
---------------------------------------------------------------------------------------------------------------------------------------
if you have any questions freely contact to me by message on tradingview.
but please understand that responses may be quite late.
Special thanks to all of contributors of community.
The script may be freely distributed under the MIT license.

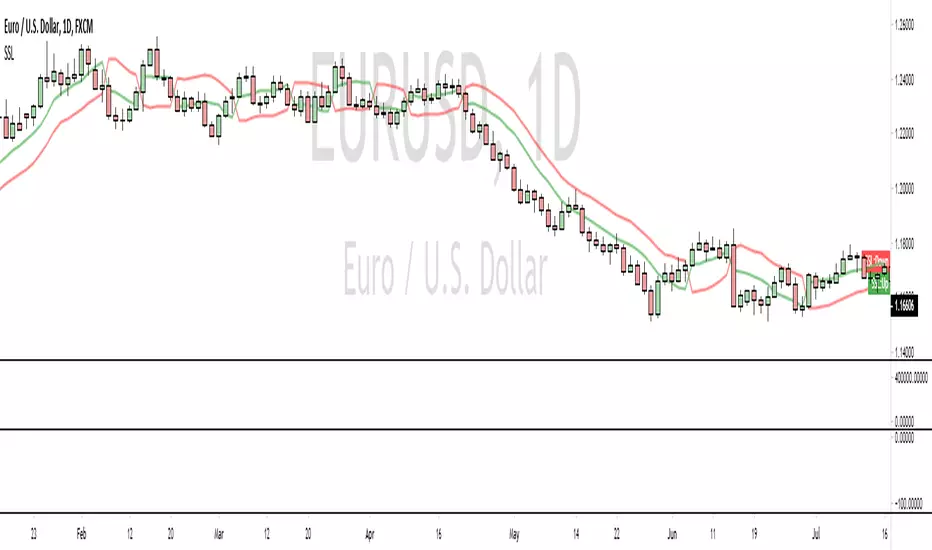
SSL [dasanc]The SSL is a fair entry condition and good exit indicator. It works best when combined with a trend indicator and multiple confirmations.
In essence, the SSL is a moving average crossover, which immediately down-grades it to a 2nd or 3rd level of confluence in my opinion.
It was recently featured in an episode of VP's "No Nonsense FX", which drove me to recreate the original MT4 indicator in PineScript.
I have two ideas on how to improve it -
Use a much faster moving average calculation method (check out my Ehlers scripts)
Use a longer period MA on lower timeframes
If you enjoy/use this script, drop me a follow and please note me in your code!
I'm *almost* always available for collabs and questions
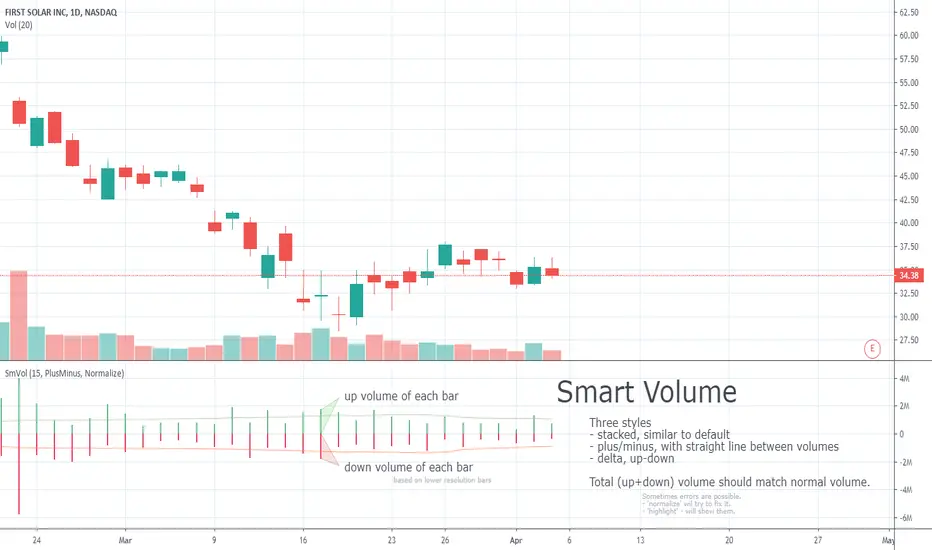
Smart VolumeOut of beta!
This script distinguishes up/down volume based on lower resolution.
It's important to set correct input "Detailed Resolution" — it affects detalization/loading speed. If equal to chart resolution, should match builtin "volume". The lower it is, the more detalized up/down border.