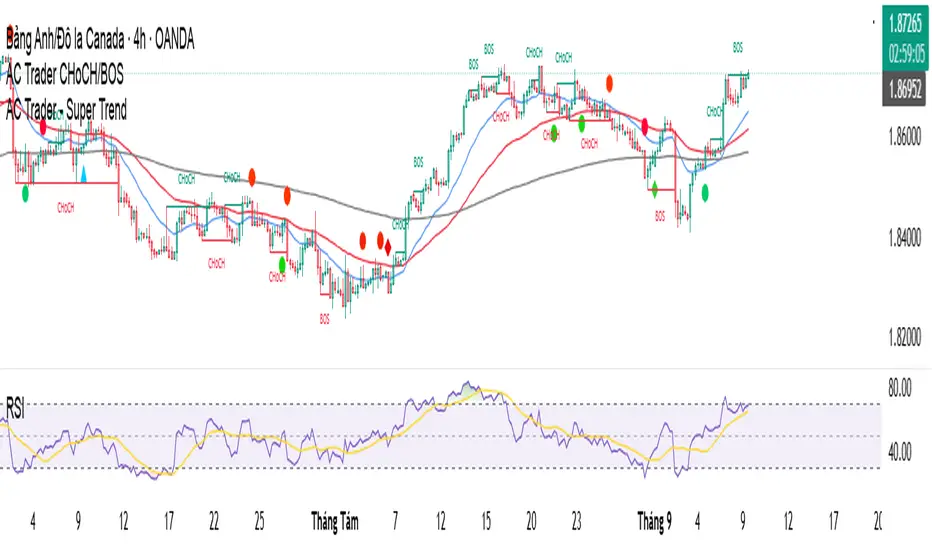
AC Trader - Super TrendThis is a candlestick pattern indicator (Marubozu, Engulfing, Pinbar) that cuts through the EMA lines (20/50/200). AE can change the EMA indicators as desired. For example, EMA 34/89/200. There is a general warning for candlestick patterns when cutting through the EMA.
Wave Analysis
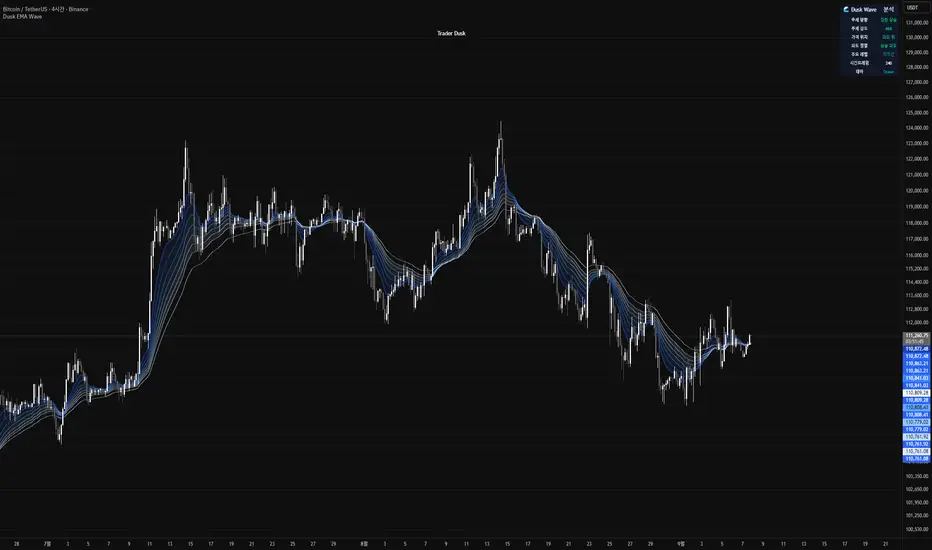
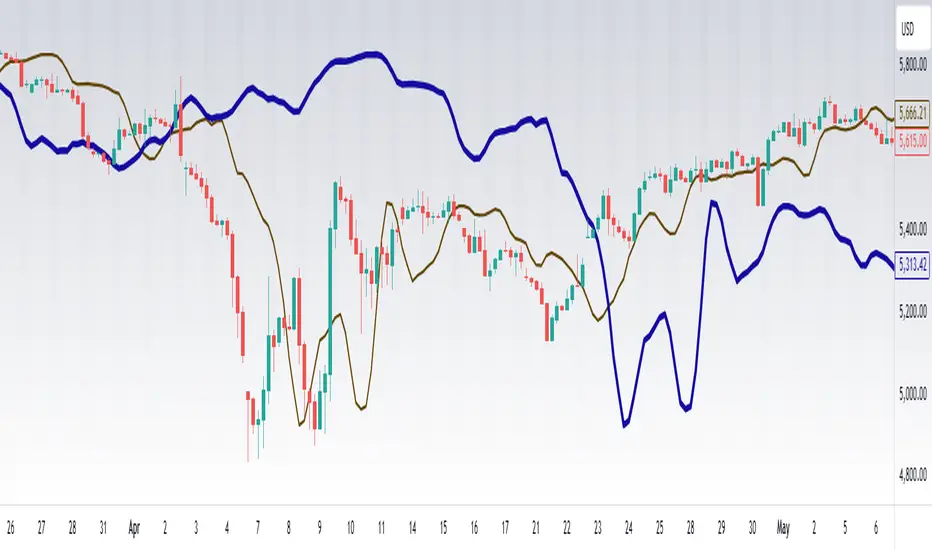
Dusk Wave🌊 Dusk Wave (시각적 분석 도구)
개요
기반 기술: 8단계 추세 파도 시각화
시간대: 모든 시간대 호환
신호: 신호 없음 (분석 전용)
용도: 추세 방향 및 강도 분석
Wave 테이블 설명
DUSK WAVE | TREND ANALYSIS
├─ Wave Alignment: 8개 파도 정렬 상태
├─ Trend Strength: 추세 강도 (Strong/Medium/Weak)
├─ Wave Direction: 파도 전체 방향 (Up/Down/Sideways)
├─ Fast Waves: 단기 파도 상태 (1-4번)
├─ Slow Waves: 장기 파도 상태 (5-8번)
├─ Convergence: 파도 수렴/발산 상태
└─ Trend Quality: 추세 품질 등급 (A/B/C/D)
Wave 해석 가이드
파란색 그라데이션: 8개 EMA 파도 표시
정렬 상태: 모든 파도가 같은 방향 = 강한 추세
파도 간격: 좁을수록 강한 추세, 넓을수록 약한 추세
색상 변화: 파도별 속도 차이 시각화
🌊 Dusk Wave (Visual Analysis Tool) - English Version
Overview
Core Technology: 8-Stage Trend Wave Visualization
Timeframe: Compatible with all timeframes
Signals: No signals (Analysis only)
Purpose: Trend direction and strength analysis
Wave Table Description
DUSK WAVE | TREND ANALYSIS
├─ Wave Alignment: 8 wave alignment status
├─ Trend Strength: Trend intensity (Strong/Medium/Weak)
├─ Wave Direction: Overall wave direction (Up/Down/Sideways)
├─ Fast Waves: Short-term wave status (Waves 1-4)
├─ Slow Waves: Long-term wave status (Waves 5-8)
├─ Convergence: Wave convergence/divergence state
└─ Trend Quality: Trend quality grade (A/B/C/D)
Wave Interpretation Guide
Blue Gradient: 8 EMA waves display
Alignment Status: All waves same direction = Strong trend
Wave Spacing: Closer = Stronger trend, Wider = Weaker trend
Color Changes: Visualizes speed differences between waves
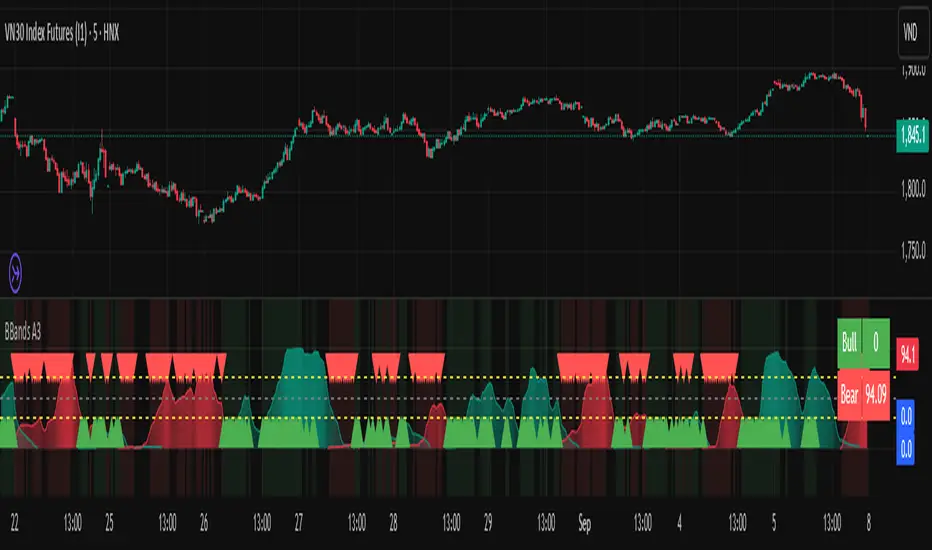
Bollinger Breakout A3 updateBollinger Breakout A3 update from LuxAlgo signal
You can try it with some another signal.
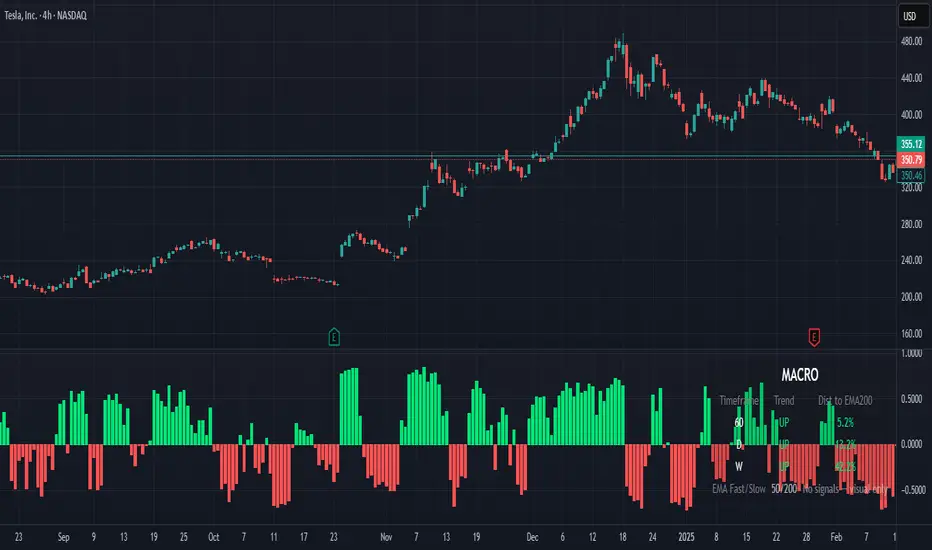
Macro Glass DashboardMacro Glass Dashboard (Free, off-chart)
What it is: A sleek panel that summarizes multi-timeframe trend health—no clutter on your candles.
What you see: 3 TFs (configurable) with fast/slow EMA alignment, distance from the long baseline, and a momentum heat strip.
When to use it: Swing planning, top-down scans, or as a second monitor overlay.
Why it’s free: A read-only dashboard to keep you aligned with higher-timeframe flow before you deploy capital.
Pro tip: Require at least 2 of 3 TFs showing “UP” before you consider long setups on your trading TF.
TrenVantage LITE TrenVantage LITE - Smart Trend Detector
"Professional ZigZag trend detection with real-time alerts and market structure analysis. Clean interface shows trend direction, price changes, and swing data."
TrenVantage LITE delivers professional-grade trend detection using advanced ZigZag analysis to identify market structure and trend changes in real-time. Built with a logic that goes beyond basic pivot detection, this free version provides essential trend analysis tools with a clean, intuitive interface designed for traders of all experience levels.
Key Features:
Advanced Trend Detection
Smart ZigZag Algorithm: Proprietary trend foundation model based on market structure principles
Customizable Sensitivity: Choose between Points or Percentage-based deviation settings
Real-Time Updates: Calculate on bar close or tick-by-tick for immediate trend changes
Flexible Analysis: 15-25 bar lookback range with 20-bar default setting
Visual Analysis Tools
Clean Trend Lines: Customizable color and width for optimal chart visibility
Professional Interface: Modern status box showing current trend and price metrics
Multiple Positioning: Place status box in any corner to match your chart layout
Market Structure: Clear visualization of swing highs and lows
Smart Alerts System
Trend Change Notifications: Instant alerts when market transitions between uptrend and downtrend
Reliable Detection: Confirmed trend changes based on significant price movements
Multiple Alert Options: Compatible with TradingView's alert system
How It Works
TrenVantage LITE uses a sophisticated ZigZag algorithm that goes beyond simple pivot detection. Our proprietary "trend-start model" identifies meaningful market structure changes by:
Analyzing Price Action: Uses high/low or close prices based on your preference
Filtering Noise: Customizable deviation thresholds eliminate false signals
Confirming Trends: Only signals trend changes after significant price movement
Tracking Structure: Maintains swing history for comprehensive analysis
Status Box Information
The integrated status box provides at-a-glance market information.
Current Trend Direction: Clear uptrend/downtrend identification with visual indicators
Live Price Data: Current price with session change and percentage movement
Swing Analysis: Number of detected swings with trend-only limitation indicator
Clean Design: Professional appearance that doesn't clutter your chart
Settings & Customization
ZigZag Parameters:
Deviation Type: Points (fixed price difference) or Percent (percentage change)
Deviation Value: Minimum price movement required to create new swing
Use High Low: Toggle between high/low prices vs close prices for analysis
Calculate Mode: Choose bar close confirmation or real-time tick updates
Lookback Range: Adjust historical analysis from 15-25 bars
Visual Controls
Trend Line Color: Customize line color to match your chart theme
Line Width: Adjust thickness from 1-4 pixels for optimal visibility
Status Box: Toggle display and choose corner positioning
Best Practices:
Timeframe Selection
Scalping (1-5min): Use 0.3-0.8 Points deviation with tick calculation
Day Trading (15-60min): Use 1-3 Points or 0.2-0.5% deviation
Swing Trading (4H-Daily): Use 0.5-1.5% deviation with bar close calculation
Getting Started
Add to Chart: Apply TrenVantage LITE to your preferred timeframe
Adjust Settings: Configure deviation and visual preferences
Set Alerts: Enable trend change notifications for your trading strategy
Analyze Trends: Use the status box and visual lines to identify market direction
Upgrade When Ready: Explore RETAIL version for Support/Resistance levels
Ready to Level Up? Upgrade to TrenVantage RETAIL
While TrenVantage LITE provides solid trend analysis, TrenVantage RETAIL transforms your trading with professional-grade market structure tools:
What You're Missing in LITE:
Support and Resistance level detection - automatically identifies key price levels where markets react
Price labels on levels - see exact values instantly without hovering or zooming
Enhanced status box - shows distance to nearest support/resistance for timing entries and exits
Up to 5 key levels - comprehensive coverage of important price zones
Level strength indicators - understand which levels are most likely to hold
Professional workflow - combines trend analysis with key level identification
TrenVantage RETAIL takes the solid trend foundation you see in LITE and adds the critical support/resistance analysis that serious traders rely on daily.
Disclaimer: Trading involves risk of loss. This indicator is for educational and analysis purposes. Past performance does not guarantee future results. Always use proper risk management and never risk more than you can afford to lose.

1H Candlestick vs EMA Crossover# Description — 1H Candlestick vs EMA Crossover (Pine Script)
This indicator is built in **TradingView Pine Script v5** and is designed to track the relationship between the **1‑hour candlestick close** and the **1‑hour Exponential Moving Average (EMA)**. It works on any chart timeframe but always pulls in **1H data** using `request. security`.
### Core Features
* **Customizable EMA length** (default = 200)
* **Plots the 1H EMA** as an orange line on your chart
* Optionally shows the **1H close** as a faint gray line for reference
* Detects and highlights when the **1H candle close crosses above or below the 1H EMA**
* **Arrows**: Green triangles appear below the bar when a bullish crossover happens (1H close > EMA); red triangles appear above the bar when a bearish crossover happens (1H close < EMA)
* **Alerts**: Built‑in `alert condition` statements let you create TradingView alerts whenever a crossover occurs
### How to Use
1. Adjust the EMA length if you want a faster or slower moving average.
2. Enable alerts: Right‑click the chart → Add Alert → choose this indicator and select either “crossed ABOVE EMA” or “crossed BELOW EMA.”
### Trading Applications
* **Trend Confirmation**: Use the 1H EMA as a higher‑timeframe filter while trading on lower timeframes.
* **Entry/Exit Signals**: Crossovers can mark potential entry points for trend continuation or reversals.
* **Scalping/Intraday**: Even on a 5m or 15m chart, you can overlay the 1H EMA to align your trades with the bigger trend.
This makes the indicator a simple yet powerful tool for aligning trades with higher‑timeframe momentum and avoiding false signals from lower‑timeframe noise.

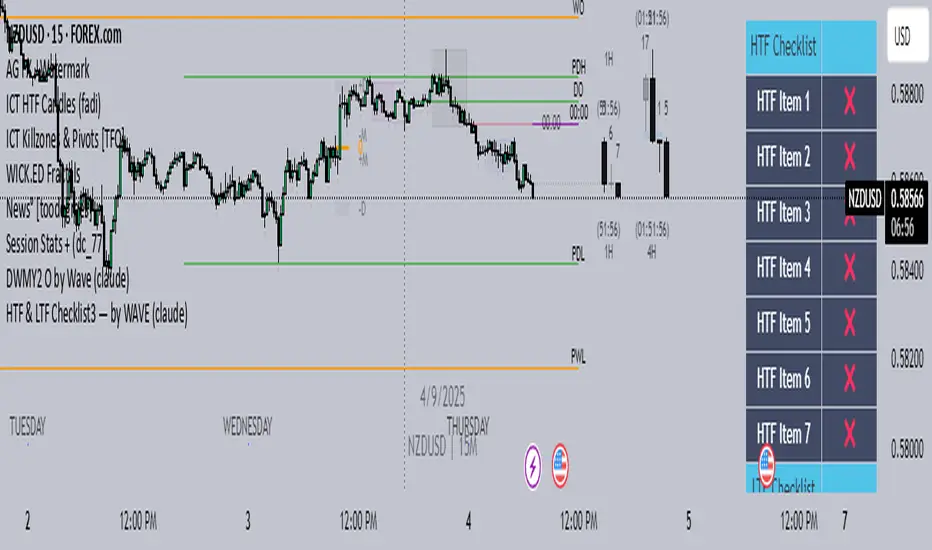
HTF & LTF Checklist3 — by WAVE (claude)HTF & LTF Checklist
-Transparency option
-Coloring option
-Remove / Add Confulences
Draw Trend LinesSometimes the simplest indicators help traders make better decisions. This indicator draws simple trend lines, the same lines you would draw manually.
To trade with an edge, traders need to interpret the recent price action, whether it's noisy or choppy, or it's trending. Trend Lines will help traders with that interpretation.
The lines drawn are:
1. lower tops
2. higher bottoms
Because trends are defined as higher lows, or lower highs.
When you see "Wedges", formed by prices chopping between top and bottom trend lines, that's noisy environment not to be traded. When you learn to "stop yourself", you already have an edge.
Often when you see a trend, it's still not too late. Trend will continue until it doesn't. But the caveat is a very steep trend is unlikely to continue, because buying volume is extremely unbalanced to cause the steep trend, and that volume will run out of energy. (Same on the sell side of course)
Trends can reverse, and when price action breaks the trend line, Breakout/Breakdown traders can take this as an entry signal.
Enjoy, and good trading!

Ai Golden Support and Resistance Adaptive Support & Resistance (ADR-scaled ABCD + Breakout/Retest Zones)
What it does
This indicator detects actionable support/resistance zones from swing structure and breakout events, then keeps each zone active until it’s invalidated by price. It adapts zone sensitivity using Average Daily Range (ADR) so the same rules scale across symbols and vol regimes.
Core Logic (high level)
Swing & ABCD pattern seed
Detects alternating pivots (high–low–high–low or low–high–low–high) using a user-selected lookback.
Validates basic AB–BC–CD proportions: BC must retrace a portion of AB; CD must extend BC within a set range.
From a valid sequence, sets a candidate level (top for bearish, bottom for bullish).
Breakout confirmation
A level becomes confirmed when price closes beyond it (crossover/crossunder).
On confirmation, the script draws a dotted reference line and records how many bars elapsed from the seed pivot to breakout. That count defines the lookback window used for local extremes.
Zone construction
Supply (bearish): builds a box around the most recent local range near the bearish seed;
Demand (bullish): builds a box around the most recent local range near the bullish seed.
Each zone’s height is derived from nearby extremes and the seed swing, so boxes reflect local structure rather than fixed pip widths.
Volatility normalization (ADR%)
ADR is computed from daily candles.
The Risk Profile input (“High/Medium/Low”) scales required move sizes using ADR%, and adjusts pivot sensitivity (fewer/more bars).
Higher risk → more sensitive (smaller ADR %, tighter pivot lookback).
Lower risk → stricter filters (larger ADR %, wider pivot lookback).
Explosive-move filter (streak logic)
Searches the seeded lookback for consecutive same-color candles (config via the risk profile).
Requires the cumulative % move of that streak to exceed an ADR-scaled threshold.
When found, the zone is tagged as originating from an “explosive” move (potentially higher reaction probability).
Zone persistence & invalidation
Zones persist and auto-extend to the right until invalidated.
Invalidation occurs when price closes through a rule-based threshold derived from the seed structure (stored per zone).
Once invalidated, the zone is marked inactive and stops updating.
Inputs & Controls
Risk Profile: High / Medium / Low (sets pivot lookback, streak length, and ADR% thresholds).
Labels & Visuals: Toggle labels and level lines; set line width.
Colors/Boxes: Supply (red), Demand (green); dotted breakout references.
No broker/session settings are required; the script adapts per symbol via ADR.
On-Chart Elements
Dotted breakout lines at confirmed levels (with measured bars-to-breakout).
Supply/Demand boxes that extend until invalidation.
Optional labels for clarity; minimal clutter by default.
How to Use
Context: Use higher-TF context for bias; apply zones on your trading TF.
Confluence: Combine zones with your own triggers (structure breaks, rejection wicks, momentum shifts).
Invalidation: If price closes beyond a zone’s invalidation threshold, treat that zone as inactive.
Sensitivity: If too many zones appear, switch to Medium/Low Risk (stricter ADR% & pivots); if too few, use High Risk.
Notes & Limitations
Logic is rule-based; there is no machine learning.
Daily ADR is computed from D timeframe, so intraday charts inherit daily volatility context.
Results vary by symbol and timeframe; validate settings per market.
This is an indicator (no orders or P/L).

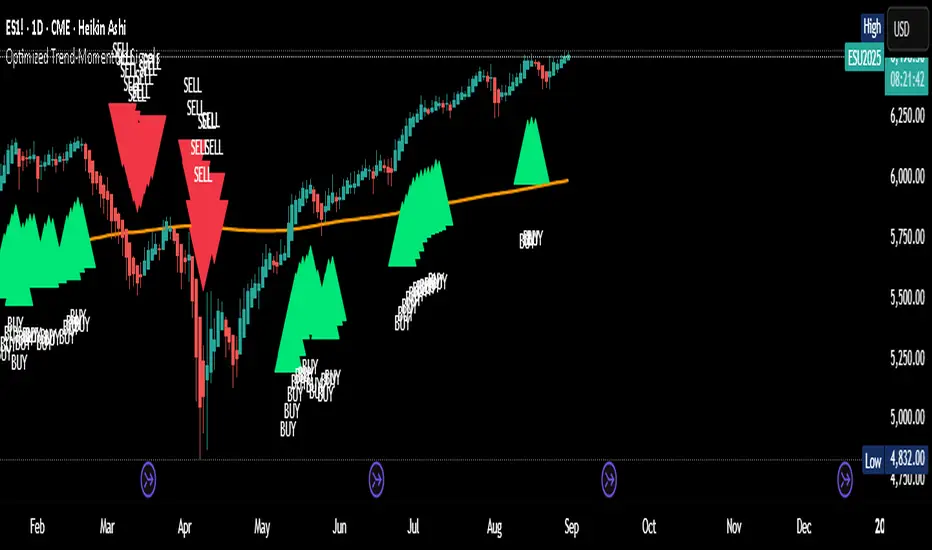
Optimized Trend-Momentum SignalsThis indicator combines trend, momentum, and volume-strength factors into a single buy/sell signal system. It integrates:
SMA 200 → Identifies the long-term trend (price above = bullish bias, below = bearish bias).
MACD (12,26,9) → Confirms momentum direction with line crossovers.
RSI (7) → Filters strength (above 50 = bullish, below 50 = bearish).
ROC (45) → Validates positive or negative rate of change.
Signal Logic:
Buy Signal → Price above SMA 200, MACD bullish, RSI > 50, and ROC > 0.
Sell Signal → Price below SMA 200, MACD bearish, RSI < 50, and ROC < 0.
Features:
Clear arrows for BUY and SELL signals.
Long-term SMA plotted for trend visualization.
Alerts built-in for real-time notifications.
This tool helps traders filter out noise and act only when all major confirmation factors align, reducing false signals and improving decision-making.
Elliott Wave [BigBeluga]🔵 OVERVIEW
Elliott Wave automatically finds and draws an Elliott-style 5-wave impulse and a dashed projection for a potential -(a)→(b)→(c) correction. It detects six sequential reversal points from rolling highs/lows — 1, 2, 3, 4, 5, (a) — validates their relative placement, and then renders the wave with labels and horizontal reference lines. If price invalidates the structure by closing back through the Wave-5 level inside a 100-bar window, the pattern is cleared (optionally kept as “broken”) while key dotted levels remain for context.
🔵 CONCEPTS
Reversal harvesting from extremes : The script scans highest/lowest values over a user-set Length and stores swing points with their bar indices.
Six-point validation : A pattern requires six pivots (1…5 and (a)). Their vertical/temporal order must satisfy Elliott-style constraints before drawing.
Impulse + projection : After confirming 1→5, the tool plots a curved polyline through the pivots and a dashed forward path from (a) toward (b) (midpoint of 5 and (a)) and back to (c).
Risk line (invalidator) : The Wave-5 price is tracked; a close back through it within 100 bars marks the structure as broken.
Minimal persistence : When broken, the wave drawing is removed to avoid noise, while dotted horizontals for waves 5 and 4 remain as reference.
🔵 FEATURES
Automatic pivot collection from rolling highs/lows (user-controlled Length ).
Wave labeling : Points 1–5 are printed; the last collected swing is marked b
. Projected i
& i
are shown with a dashed polyline.
Breaker line & cleanup : If price closes above Wave-5 (opposite for bears) within 100 bars, the pattern is removed; only dotted levels of 5 and 4 stay.
Styling controls :
Length (pivot sensitivity)
Text Size for labels (tiny/small/normal/large)
Wave color input
Show Broken toggle to keep invalidated patterns visible
Lightweight memory : Keeps a compact buffer of recent pivots/draws to stay responsive.
🔵 HOW TO USE
Set sensitivity : Increase Length on noisy charts for cleaner pivots; decrease to catch earlier/shorter structures.
Wait for confirmation : Once 1→5 is printed and (a) appears, use the Wave-5 line as your invalidation. A close back through it within ~100 bars removes the active wave (unless Show Broken is on).
Plan with the dashed path : The (a)→(b)→(c) projection offers a scenario for potential corrective movement and risk placement.
Work MTF : Identify cleaner waves on higher TFs; refine execution on lower TFs near the breaker or during the move toward (b).
Seek confluence : Align with structure (S/R), volume/Delta, or your trend filter to avoid counter-context trades.
🔵 CONCLUSION
Elliott Wave systematizes discretionary wave analysis: it detects and labels the 5-wave impulse, projects a plausible (a)-(b)-(c) path, and self-cleans on invalidation. With clear labels, dotted reference levels, and a practical breaker rule, it gives traders an objective framework for scenario planning, invalidation, and timing.

Oheiya MFI + MWThis is a combination of Money Flow Index and Momentum wave with refined values and logic.

CAT FLD SmoothWhat is an FLD?
The FLD stands for Future Line of Demarcation, introduced by J.M. Hurst in his Cyclic Analysis work.
It is constructed by shifting the price forward in time by half the length of a given cycle. For example, if you want to analyze a 40-bar cycle, you would plot price shifted forward by 20 bars. This creates a projected line that acts as a dynamic reference for where the cycle rhythm should align.
In practice, each cycle has its own FLD (20, 40, 80 bars, etc.), and when price interacts with those FLDs, it often reveals the underlying rhythm of market waves.
How Traders Use the FLD
1. Cycle Detection
When price crosses its FLD, it is often the signal that a cycle trough or peak has recently formed. This allows the trader to recognize where one wave ends and the next begins.
Upward cross → suggests a new upward cycle has started.
Downward cross → suggests a downward cycle is unfolding.
2. Projection of Price Targets
One of Hurst’s key insights is that after crossing an FLD, price often travels a distance roughly equal to the recent cycle’s amplitude. This makes the FLD a tool not only for timing but also for projecting targets.
Example:
If price rises through the 40-bar FLD after a cycle trough, the expected move is often the same height as the move off the last trough to the point of a break through the FLD.
3. Support and Resistance
FLDs can act like invisible levels of support and resistance, but unlike static horizontal levels, they are dynamic and cycle-based. Price often hesitates, bounces, or accelerates when touching its FLD.
4. Multi-Cycle Confluence
Markets rarely move in just one cycle length. By plotting multiple FLDs (for example, 20-bar, 40-bar, and 80-bar), traders can see where several FLDs line up. These confluences are particularly powerful—they highlight high-probability turning points.
Why FLDs Matter?
They help separate noise from structure by focusing on repeating time rhythms.
They provide early signals of where cycles invert.
They give price targets that are not arbitrary, but cycle-derived.
They can be combined with other tools (trendlines, oscillators, volume) for confirmation.
👉 With this indicator, you can visualize Hurst’s FLDs directly on your TradingView charts, making it easier to detect cycles, project targets, and anticipate turning points before they become obvious to everyone else.
CastAway Trader LLC, the publisher of this indicator is not registered as an investment adviser nor a broker/dealer with either the U. S. Securities & Exchange Commission or any state securities regulatory authority.
CastAway Trader LLC reserves the right to un-publish this indicator or change it without any written notice.
Past results are not indicative of future profits.
Better Pivot Points [LuminoAlgo]Overview
The Better Pivot Points indicator is an advanced trend analysis tool that combines Supertrend methodology with automated pivot point identification and zigzag visualization. This indicator helps traders identify significant price turning points and visualize market structure through dynamic pivot labeling and connecting lines.
How It Works
This indicator utilizes a Supertrend-based algorithm to detect meaningful pivot points in price action. Unlike traditional pivot point indicators that rely on fixed time periods, this tool dynamically identifies pivots based on trend changes, providing more relevant and timely signals.
The algorithm tracks trend changes using ATR-based Supertrend crossovers to determine when significant highs and lows have formed. When a trend reversal is detected, the indicator marks the pivot point and draws connecting lines to visualize price flow and market structure progression.
Key Features
• Dynamic Pivot Detection: Automatically identifies high and low pivot points using Supertrend crossovers
• Market Structure Labeling: Labels pivots as HH (Higher High), LH (Lower High), HL (Higher Low), or LL (Lower Low)
• Zigzag Visualization: Connects pivot points with customizable lines to clearly show price flow and market structure
• Color-Coded Analysis: Uses distinct colors to indicate bullish trends (green), bearish trends (red), and neutral conditions (yellow)
• Customizable Parameters: Adjustable ATR period, factor, line width, and line style
Input Settings
• ATR Length: Controls the sensitivity of the Supertrend calculation (default: 21)
• Factor: Multiplier for the ATR-based Supertrend bands (default: 2.0)
• Zigzag Line Width: Customize the thickness of connecting lines (1-4)
• Zigzag Line Style: Choose between Solid, Dashed, or Dotted line styles
What Makes This Original
This indicator combines several analytical concepts into a cohesive tool that differentiates it from standard pivot point indicators:
1. Uses Supertrend crossovers as the trigger for pivot detection rather than traditional high/low lookback periods
2. Automatically categorizes market structure using HH/LH/HL/LL labeling system based on pivot relationships
3. Provides real-time zigzag visualization with intelligent color coding that reflects trend direction
4. Integrates trend direction analysis with structural pivot identification in a single comprehensive tool
The underlying calculations use custom logic for tracking trend states, validating pivot points, and determining appropriate color coding based on market structure analysis.
How to Use
1. Trend Identification: Green lines indicate bullish market structure, red lines show bearish structure, yellow indicates transitional periods
2. Support/Resistance: Pivot points often act as future support and resistance levels for price action
3. Market Structure Analysis: HH and HL patterns suggest uptrends, while LH and LL patterns indicate downtrends
4. Entry/Exit Planning: Use pivot points and trend changes to plan potential trade entries and exits
Important Limitations and Warnings
• This indicator is a technical analysis tool and should not be used as the sole basis for trading decisions
• Pivot points are identified after price moves occur, meaning this indicator has inherent lag and cannot predict future pivots
• False signals can occur during ranging or choppy market conditions where trends are unclear
• Past performance of any indicator does not guarantee future results or trading success
• The indicator works best in clearly trending markets and may produce less reliable signals in sideways price action
• This tool requires interpretation and should be combined with other forms of analysis
• Always use proper risk management and position sizing strategies when trading
Why This Script Is Protected
This indicator uses proprietary algorithms for pivot detection timing, trend state management, and market structure analysis that represent original research and development. The specific logic for pivot validation, color-coding methodology, and structural relationship calculations contains unique approaches that differentiate it from standard pivot point indicators available in the public library.
Disclaimer
This indicator is for educational and analysis purposes only and does not constitute investment advice. Trading involves substantial risk and is not suitable for all investors. Past results are not indicative of future performance. The future is fundamentally unknowable and past results in no way guarantee future performance. Always conduct your own research and consider your risk tolerance before making any trading decisions.

EMA Range OscillatorEMA Range Oscillator (ERO) - User Guide
Overview
The EMA Range Oscillator (ERO) is a technical indicator that measures the distance between two Exponential Moving Averages (EMAs) and the distance between price and EMA. It normalizes these distances into a 0-100 range, helping traders identify trend strength, market momentum, and potential reversal points.
Components
Main Line
Green Line: EMA20 > EMA50 (Uptrend)
Red Line: EMA20 < EMA50 (Downtrend)
Histogram
White Histogram: Price distance from EMA20
Key Levels
Upper Level (80): High divergence zone
Middle Level (50): Neutral zone
Lower Level (20): Low divergence zone
Parameters
ParameterDefaultDescriptionFast EMA20Short-term EMA periodSlow EMA50Long-term EMA periodNormalization Period100Lookback period for scalingUpper80Upper threshold levelLower20Lower threshold level
How to Read the Indicator
High Values (Above 80)
Strong trend in progress
EMAs are widely separated
High momentum
Potential overbought/oversold conditions
Watch for possible trend exhaustion
Low Values (Below 20)
Consolidation phase
EMAs are close together
Low volatility
Potential breakout setup
Range-bound market conditions
Middle Zone (20-80)
Normal market conditions
Moderate trend strength
Balanced momentum
Look for directional clues from color changes

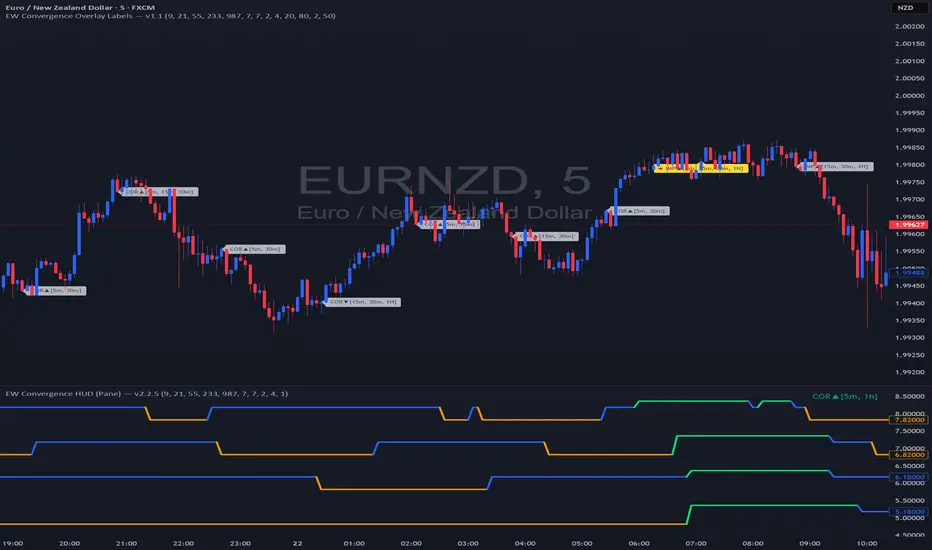
EW Convergence HUD (Pane) — v2.2.5📖 Description
The EW Convergence Suite is a dual-component Elliott-Wave inspired tool designed to help traders spot multi-timeframe convergence points — the places where waves across different timeframes terminate together and trend changes often ignite.
It contains two parts:
🔹 HUD (Pane)
Lives in the lower pane, one horizontal row per timeframe (1m → 1M).
Colors represent phase classification:
Lime = Impulse Up (+2)
Red = Impulse Down (−2)
Teal = Corrective Up (+1)
Orange = Corrective Down (−1)
Gray = Neutral/Unclear
Rows shift slightly up/down depending on impulse vs. corrective, so you can see transitions as diagonal “jumps.”
HUD ticker (top-right) shows current convergence state:
Example: IMP▲ = impulse up alignment on 3 TFs.
Example: ★ COR▼ = 4 TF corrective down alignment (special event).
🔹 Overlay Labels (on price chart)
Prints labels directly on the chart when convergence events meet your thresholds.
Shows which phases and which TFs are aligned at that moment.
Optional pivot confirmation:
Early mode → labels fire as soon as TFs align (onlyOnPivot=false).
Confirmed mode → labels fire only when convergence + a fresh pivot confirmation occur (onlyOnPivot=true + pivot lines on).
Can also draw multi-TF pivot lines to visually connect swing highs/lows across your chosen timeframes.
⚙️ Inputs & Customization
Timeframe Toggles → select which TFs to include in the convergence counts.
EMA Trend Stack (9/21/55/233/987 by default) → defines trend alignment for impulse vs. corrective classification.
Pivot left/right → sensitivity of swing highs/lows (2/2 = fast, 5/5 = smoother, 10/10+ = major swings).
MinN / SpecialN → thresholds for convergence events (regular vs. ★ special highlight).
Label Controls →
Only on pivot confirmations
Only on confirmed bars
Only when content changes
Minimum bar gap between labels
Wave Line Controls → toggle pivot-connecting lines per TF, with adjustable opacity and max lines stored.
🎯 How to Use
Scan the HUD for clusters of rows with the same color/phase. Flat plateaus across multiple TFs = strong alignment.
Wait for convergence counts (MinN or SpecialN) to be reached. HUD ticker will show IMP▲ or COR▼ with the TF list.
Watch the Overlay Labels on the price chart for where that convergence “hits” — optionally tied to fresh pivot confirmations.
Best practice:
Use lower TFs (1m/5m/15m) as entry triggers.
Use higher TFs (1h/4h/1D) as bias anchors.
Look for termination zones where both HUD alignment and Overlay labels agree.
🔑 Why it works
This indicator combines objective pivot detection with EMA-based trend structure to classify legs as impulsive or corrective. By watching multiple TFs simultaneously, it highlights the rare and powerful moments where waves across scales converge. These are often the cleanest points for entry, exit, or scaling.
Impulse convergence → continuation or breakout potential.
Corrective convergence → likely end of a pullback and resumption of higher-TF trend.
Pivot-gated mode → confirmation that the move is not just alignment, but a structural turn.
✅ Notes
This script does not attempt to count Elliott Waves strictly (1-2-3-4-5, A-B-C). Instead it provides a framework for convergence and context, letting you apply your own EW interpretation on top.
Works best when combined with your own risk management rules (stops, partials, capital buffer).
Default EMAs (9/21/55/233/987) and pivot lookbacks (3/3) are optimized for intraday trading; adjust for your style (scalp, swing, position).
⚡ Bottom line:
The EW Convergence Suite is like having a multi-timeframe radar + price-level marker that alerts you when Elliott-style phases across several TFs line up. It cuts through noise and helps you focus on the moments of real structural confluence.

Relative Weighted Rate of Change (WROC) vs Nifty 50Relative Weighted Rate of Change (WROC) vs Nifty 50

Trend Display Table (with Change Alerts)📌 Indicator: Trend Display Table (with Change Alerts)
This indicator helps identify trend direction based on a 15-minute 20 SMA compared against a 10 EMA applied to that SMA.
Trend Logic:
Bullish → 20 SMA crosses above 10 EMA (on SMA values)
Bearish → 20 SMA crosses below 10 EMA (on SMA values)
Neutral → No crossover (trend continues from previous state)
Display:
A compact trend table appears on the chart (top-right), showing the current trend with customizable colors, font size, and background.
Alerts:
Alerts are triggered only when the trend changes (from Bullish → Bearish or Bearish → Bullish).
This prevents repeated alerts on every bar.
✅ Useful for:
Confirming higher timeframe trend bias
Filtering trades in choppy markets
Getting notified instantly when the trend flips

Elliott Wave Universal PRO ImpulseElliott Wave Universal PRO Impulse
Elliott Wave Universal PRO Impulse is a powerful and versatile Pine Script indicator designed for traders who utilize Elliott Wave theory to analyze market trends and forecast price movements. This indicator automates the plotting of various impulse wave patterns, enabling users to visualize and analyze market structures with precision and ease.
Key Features
Multiple Impulse Patterns: Choose from a wide range of impulse wave patterns, including Classic Impulse, Leading and Ending Diagonals, Extended Waves, Truncated Waves, and more, catering to diverse market scenarios.
Customizable Ratios: Supports Standard, Minimal, and Maximal Fibonacci-based ratios for wave projections, allowing traders to adapt to different market conditions.
Interactive Inputs: Define key points (0 and A) by selecting time and price directly on the chart, ensuring accurate wave construction tailored to your analysis.
Visual Customization: Adjust line styles (Solid/Dotted) and colors for Standard, Minimal, and Maximal patterns to enhance chart clarity and align with your trading preferences.
Overlay Display: Plots wave patterns directly on the price chart with labeled points and color-coded lines, making it easy to interpret wave structures.
How It Works
Select an impulse pattern from the dropdown menu (e.g., "Classic Impulse (5-3-5)", "Extended 3rd Wave Impulse").
Set the starting point (0) and wave 1 endpoint (A) using time and price inputs.
The indicator calculates and plots the subsequent waves (2, 3, 4, and 5) based on Fibonacci ratios and the selected pattern.
Toggle Standard, Minimal, and Maximal projections to visualize potential wave targets with distinct styles and colors.
Use Cases
Trend Analysis: Identify and confirm impulse wave structures to anticipate market trends and reversals.
Trade Planning: Use projected wave targets to set entry, exit, and stop-loss levels.
Risk Management: Assess wave validity and potential failure points (e.g., Truncated or Failed Waves) to refine trading strategies.
Settings
Impulse Pattern: Select from over 30 predefined Elliott Wave patterns.
Build Points: Input time and price for points 0 and A to anchor the wave structure.
Display Options: Enable/disable Standard, Minimal, and Maximal projections.
Style Options: Customize line styles (Solid/Dotted) and colors for each projection type.
Notes
Ensure proper placement of points 0 and A to align with significant market highs/lows for accurate projections.
Best used in conjunction with other technical tools to confirm wave patterns and market signals.
Optimized for all timeframes and asset classes, including stocks, forex, crypto, and commodities.
Elevate your Elliott Wave analysis with Elliott Wave Universal PRO Impulse and gain a deeper understanding of market dynamics!
Complete catalog of Elliott impulse patterns:
Classic Impulse (5-3-5) - Sequential - Классический импульс с последовательной структурой.
Classic Impulse (5-3-5) - Template - Классический импульс с шаблонными пропорциями.
Extended 1st Wave Impulse - Импульс с удлиненной первой волной.
Extended 3rd Wave Impulse - Импульс с удлиненной третьей волной.
Extended 5th Wave Impulse - Импульс с удлиненной пятой волной.
Symmetrical Impulse - Симметричный импульс.
Leading Diagonal (5-3-5-3-5) - Ведущая диагональ с подволнами 5-3-5-3-5.
Leading Diagonal (3-3-3-3-3) - Ведущая диагональ с подволнами 3-3-3-3-3.
Ending Diagonal (3-3-3-3-3) - Завершающая диагональ с подволнами 3-3-3-3-3.
Expanding Diagonal (3-3-3-3-3) - Расширяющаяся диагональ.
Expanding Impulse - Расширяющийся импульс.
Truncated Impulse - Усеченный импульс.
Failed 5th Wave Impulse - Импульс с неудачной пятой волной.
Extended 1st and 3rd Waves Impulse - Импульс с удлиненными первой и третьей волнами.
Running Correction Wave 2 Impulse - Импульс с бегущей коррекцией во второй волне.
Running Correction Wave 4 Impulse - Импульс с бегущей коррекцией в четвертой волне.
Extended 1st and 5th Waves Impulse - Импульс с удлиненными первой и пятой волнами.
Extended 2nd Wave Impulse - Импульс с удлиненной второй волной.
Double Truncated 5th Wave Impulse - Импульс с дважды усеченной пятой волной.
Converging Diagonal - Сходящаяся диагональ.
Running Flat Wave 2 Impulse - Импульс с плоской бегущей коррекцией во второй волне.
Running Flat Wave 4 Impulse - Импульс с плоской бегущей коррекцией в четвертой волне.
Double Extended 1st and 3rd Waves Impulse - Импульс с двойным удлинением первой и третьей волн.
Double Extended 3rd and 5th Waves Impulse - Импульс с двойным удлинением третьей и пятой волн.
Leading Diagonal with Failed 5th Wave - Ведущая диагональ с неудачной пятой волной.
Complex Correction Wave 2 (Double Zigzag) Impulse - Импульс с комплексной коррекцией во второй волне (двойной зигзаг).
Complex Correction Wave 4 (Triangle) Impulse - Импульс с комплексной коррекцией в четвертой волне (треугольник).
Terminal Impulse - Терминальный импульс.
Extended 4th Wave Impulse - Импульс с удлиненной четвертой волной.
Diagonal with Overlap - Диагональ с перекрытием.
Nested Extension Wave 3 Impulse - Импульс с вложенным удлинением третьей волны.
Failed Wave 1 Impulse - Импульс с неудачной первой волной.
Double Running Correction Impulse - Импульс с двойной бегущей коррекцией.
Converging Impulse - Сходящийся импульс.
Expanding Leading Diagonal - Расширяющаяся ведущая диагональ.
Truncated Ending Diagonal - Усеченная завершающая диагональ.
Irregular Wave 2 Impulse - Импульс с нерегулярной второй волной.
Sharp Wave 4 Impulse - Импульс с резкой четвертой волной.
Diagonal Impulse Variant - Вариант диагонального импульса.
Extended Symmetrical Impulse - Удлиненный симметричный импульс.

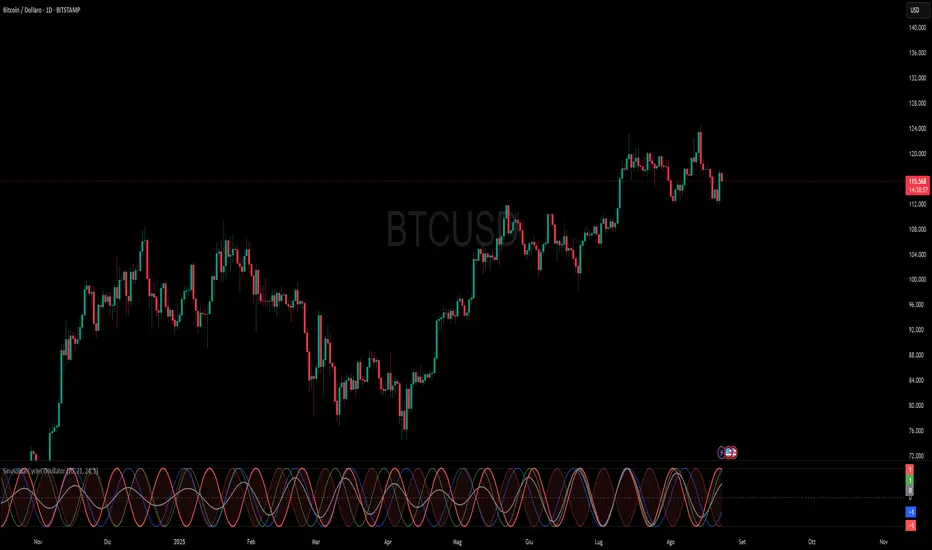
Sinusoidal Cycles OscillatorTitle: Sinusoidal Cycles Oscillator – Multi-Cycle Market Indicator
Description:
Discover market rhythm with the Sinusoidal Cycles Oscillator, a powerful tool for technical analysis and cyclical trading.
Three customizable cycles track short, medium, and long-term market oscillations.
Cycle 1 serves as the main reference wave with an optional mirror envelope.
Cycles 2 & 3 provide supporting harmonics for deeper insight.
Composite wave averages all cycles to reveal overall market phase.
Features:
Fully adjustable periods and amplitude.
Visualize tops, bottoms, and turning points at a glance.
Oscillator ranges from -1 to +1 with clear threshold guides.
Ideal for traders using cycle analysis, harmonic trading, or market timing.
Easy-to-read visual overlay and separate panel option.
Use it to:
Identify potential price reversals.
Compare market cycles across multiple timeframes.
Enhance timing and entry/exit decisions.
Day Decider- ArpitjainforexThis Setup Helps you identify if the Day is Trending Or Choppy. (Keeps you away from the Screen 20 days a month: As you are aware, there is a 1:4 Ratio between Trending Vs Choppy.
Learn more to use at its best potential
Contact www.arpitjainforex.com

Intellxis Premium InsightUnderstanding the Intellxis - Premium Insight Indicator
This guide provides a way to understand the output of the Premium Insight plugin for TradingView. Its core feature is the "Premium Status" column, which analyzes how an option's premium behaves relative to the underlying asset's price. Use the below guide to decode every status message and leverage this powerful plugin in your trading.
Call Option Statuses
Strong (Spot 🡅): The Call premium is increasing as the underlying asset price rises. This confirms a bullish trend and indicates the option is behaving as expected.
Down (Spot 🡇): The Call premium is decreasing as the underlying asset price falls. This is the normal, expected behavior for a call option in a downtrend.
Down (Spot ⟷): The Call premium is decreasing while the underlying asset price is flat. This erosion of value is due to the passage of time and is an expected behavior.
Weak (Spot 🡅): The Call premium is decreasing slightly even though the underlying asset price is rising. This is an anomaly and suggests weakness in the bullish move.
Flat (Spot 🡅): The Call premium is not changing despite a rise in the underlying asset price. This indicates the premium is not responding to a favorable move, which is a sign of weakness.
Strong (Spot 🡇): The Call premium is increasing even though the underlying asset price is falling. This is a highly counter-intuitive signal and could point to a sharp increase in implied volatility.
MELTDOWN (Spot 🡅): The Call premium is collapsing significantly while the underlying asset price is RISING. This contradicts normal option behavior and may signal an imminent reversal or volatility crush.
MELTDOWN (Spot ⟷): The Call premium is collapsing significantly while the underlying is flat. This suggests a massive drop in implied volatility or other strong selling pressure not related to price direction.
Down Significantly (Spot 🡇): The Call premium is dropping significantly as the underlying spot price is moving down.
Up (Spot ⟷): The Call premium is increasing while the underlying spot price is flat. This is likely due to a sudden increase in volatility.
Flat (Spot ⟷): Normal: The Call premium is flat and the underlying spot price is also flat.
Put Option Statuses
Strong (Spot 🡇): The Put premium is increasing as the underlying asset price falls. This confirms a bearish trend and indicates the option is behaving as expected.
Down (Spot 🡅): The Put premium is decreasing as the underlying asset price rises. This is the normal, expected behavior for a put option in an uptrend.
Down (Spot ⟷): The Put premium is decreasing while the underlying asset price is flat. This erosion of value is due to the passage of time and is an expected behavior.
Weak (Spot 🡇): The Put premium is dropping slightly even though the underlying asset price is falling. This is an anomaly and suggests weakness in the bearish move.
Flat (Spot 🡇): The Put premium is not changing despite a fall in the underlying asset price. This indicates the premium is not responding to a favorable move, which is a sign of weakness.
Strong (Spot 🡅): The Put premium is increasing even though the underlying asset price is rising. This is a highly counter-intuitive signal and could point to a sharp increase in implied volatility.
MELTDOWN (Spot 🡇): The Put premium is collapsing significantly while the underlying asset price is FALLING. This contradicts normal option behavior and may signal an imminent reversal or volatility crush.
MELTDOWN (Spot ⟷): The Put premium is collapsing significantly while the underlying is flat. This suggests a massive drop in implied volatility or other strong selling pressure not related to price direction.
Down Significantly (Spot 🡅): The Put premium is dropping significantly as the underlying spot price is moving up.
Up (Spot ⟷): The Put premium is increasing while the underlying spot price is flat. This is likely due to a sudden increase in volatility.
Flat (Spot ⟷): The Put premium is flat and the underlying spot price is also flat.
