[LJ] RSIM + ICT KillzonesIndicator Summary
This Pine Script indicator is a comprehensive, all-in-one toolkit designed for traders utilizing Inner Circle Trader (ICT) concepts. It visually maps out crucial time-based trading sessions, killzones, and key opening price levels directly on the chart. Alongside the time and price tools, it features a real-time "RSIM" (MTF RSI Monitor) dashboard to track market momentum across multiple timeframes, all while maintaining a lag-free chart through automated drawing cleanup.
Core Functionalities
ICT Killzones & Silver Bullets:
Visually demarcates specific high-probability trading windows—including the Asian, London, and New York (AM & PM) killzones, as well as the UK and US "Silver Bullet" times—using vertical lines and colored background highlights.
Key Opening Price Levels:
Automatically plots horizontal lines for significant opening prices, such as the New York Midnight Open (often used as true day open), CME Open, and NY AM/PM Opens. It also includes Higher Time Frame (HTF) levels for Weekly and Monthly opens.
Session High/Low Tracking:
Actively tracks and draws horizontal price levels for the High and Low of the current day, previous day, and individual Globex, Asian, London, and NY sessions.
Multi-Timeframe RSI Dashboard (RSIM):
An on-chart table that displays the current Relative Strength Index (RSI) values and a live countdown timer ("time to close") for the 5-minute, 15-minute, 1-hour, 4-hour, Daily, and Weekly timeframes.
Lunch "No-Trade-Zone":
Specifically highlights the New York Lunch period, visually warning traders of potential low-volume or erratic price action.
Automated Housekeeping:
A built-in memory management system that automatically deletes drawings (lines and labels) older than a user-defined number of days to prevent chart clutter and performance lag.
Built-in Debug Logger:
An optional on-chart logging table that tracks session triggers and script events, helping traders verify that times and levels are plotting correctly for their selected asset.
Weekdaylabel

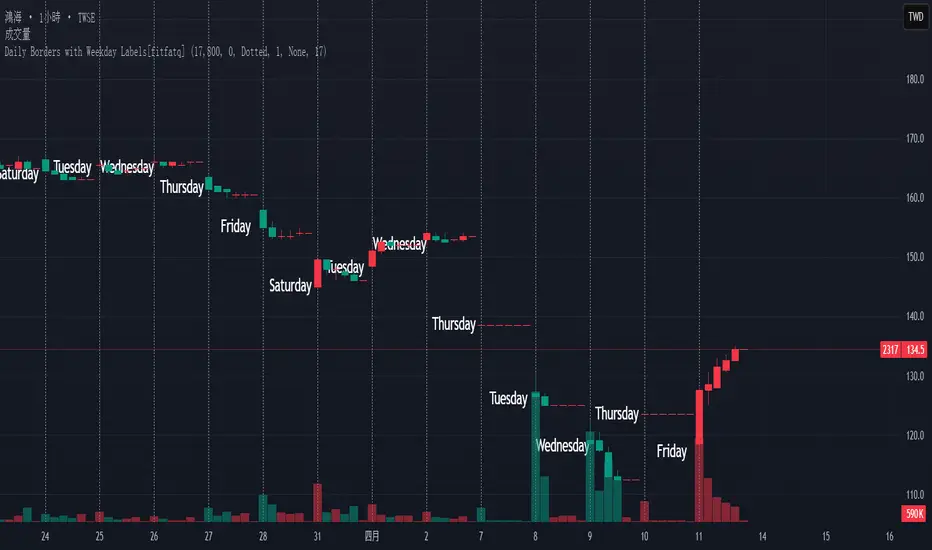
Daily Borders with Weekday Labels[fitfatq]Indicator Overview
This indicator displays daily vertical border lines and the previous day’s weekday label on intraday charts (i.e., charts with a timeframe lower than Daily). It draws a vertical line at the start of each new trading day and places a label displaying the previous day’s weekday (e.g., Monday) at the horizontal midpoint between the previous and the current day. Users can customize various visual aspects such as the separator line style and width, label style, text color, and text size. Additionally, the indicator offers an option to fix the label’s Y coordinate at a specified price level to prevent it from being overlapped by candlesticks.
Parameter Details
Use Fixed Weekday Label Y Coordinate
Type: Boolean
Default: false
Description: When enabled, the weekday label’s vertical position will be fixed at a specified price level (see next parameter). Otherwise, the label’s Y position is determined dynamically (typically based on the current bar’s low minus 3 ticks).
Fixed Weekday Label Y Coordinate (price)
Type: Float
Default: 130.0
Description:
This parameter sets the fixed price level at which the weekday label will be displayed if the "Use Fixed Weekday Label Y Coordinate" option is enabled. Please input a value that corresponds to your chart’s price scale (e.g., 130.50). Note: In charts with high price levels (for example, stocks trading at 3000 or above), it is recommended to set this value to 3000 or above. The higher the value, the closer the label will appear to the candlesticks.
Separator Line Style
Type: String (Options: "Solid", "Dotted", "Dashed")
Default: "Dotted"
Description: Specifies the style of the vertical separator line drawn at the start of each new day. "Solid" displays a continuous line, "Dotted" shows a dotted line, and "Dashed" provides a dashed line.
Separator Line Width
Type: Integer
Default: 1
Description: Determines the thickness of the separator line. A higher number results in a thicker line; the minimum value is 1.
Label Style
Type: String (Options: "None", "Label Up", "Label Down", "Label Left", "Label Right", "Label Center")
Default: "None"
Description: Sets the built-in style for the weekday label. "None" means no background or border (plain text only), while other options apply predefined visual effects.
Text Color
Type: Color
Default: Black
Description: Determines the text color of the weekday label.
Label Text Size
Type: String (Options: "Tiny", "Small", "Normal", "Large", "Huge")
Default: "Normal"
Description: Specifies the text size of the weekday label. Adjust according to preference to ensure the label is readable.
Usage Summary
How It Works:
The indicator detects the start of a new trading day using a change in the daily timeframe (via ta.change(time("D"))). When a new day begins, it draws a vertical separator line at the first bar of that day. If previous day data is available, the indicator calculates the horizontal midpoint between the start of the previous day and the current day and displays the previous day’s weekday label at that position. If the fixed Y coordinate option is enabled, the label is drawn at the specified price level; otherwise, it is positioned relative to the current bar’s low.
Customization:
Users can adjust all visual aspects, including the line style and width as well as the label style, text color, and text size. The fixed Y coordinate option allows the label’s vertical position to remain constant, which helps prevent overlapping with price bars.
Chart Requirement:
This indicator only operates on intraday charts (timeframes lower than Daily) and will not display on Daily or higher timeframe charts.
License
This indicator is released under the Mozilla Public License 2.0. Please credit the original author (fitfatq) when using or sharing this script.