Ehlers Directional Movement Hann Window Indicator [CC]The Directional Movement Hann Window Indicator was created by John Ehlers (Stocks and Commodities Dec 2021 pgs 17-18) and this is his updated version of the classic Directional Movement indicator created by J. Welles Wilder. Ehlers uses the Hann Window Filtering after using an exponential moving average to smooth the classic directional movement indicator. This helps significantly with the lag and lack of smoothing which are both issues with the classic indicator. I have included strong buy and sell signals in addition to the normal ones so strong signals are darker in color and normal signals are lighter in color. Buy when the line turns green and sell when it turns red.
Let me know if there are any other indicators you would like to see me publish!
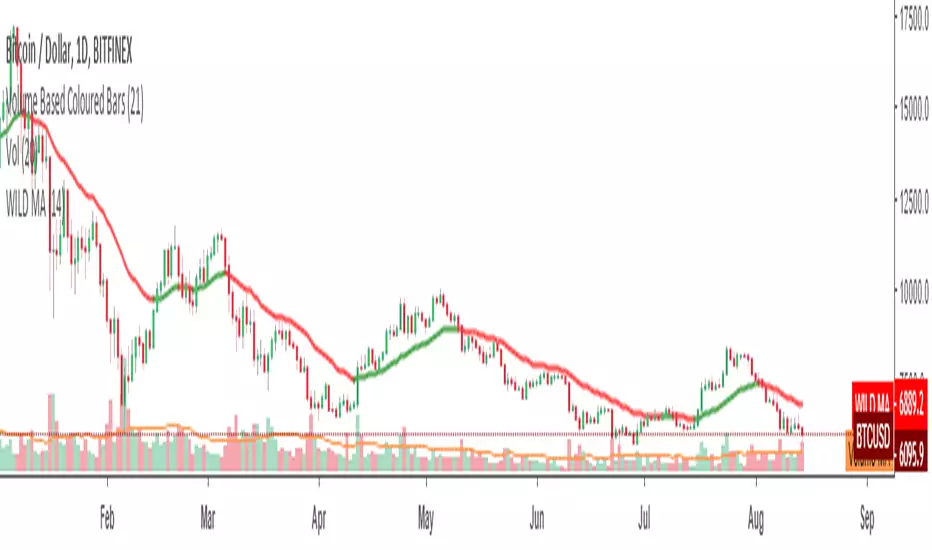
Wilder
Customisable Moving Averages x5This is a Moving Averages pack with 5 lines.
This indicator is different from others because with it you can select the MA type used in calculations for each line.
Available MA types are (currently):
SMA
EMA
WMA
VWMA
RMA
HMA
Also configurable (for each line) are data source (open, close, hlc3, etc) and period.
Support and Resistance-Heiken Ashi-Swing Index System-alertsThis is a breakout system that has pivot swing lines and a trailing stop built in. Many people try to use different ways to find out what a swing point is such as, zig zags, lookbacks, fractals, hand-drawn chart lines, or other subjective indicators. This looks at the heiken ashi price to objectively find the swing pivots. Many would agree that the color changes in the heiken ashi bars are signs of price reversals. This indicator tells where the significant swing points will be based on this concept. A lookback for a specific number of bars is then done to make sure the lowest low or the highest high is the actual swing point by looking at all possible combinations where it could be after finding the color change in the heiken ashi bar. After the swing points are found, the pivot lines can act as support and resistance levels, as trailing stops, as a confirmation of a breakout, or any other use that S/R lines might have. The colored zone filling is included along with the pivot top and bottom lines to show that the price has broken above/below the pivot lines and has remained above/below them. This trailing stop can be used as a final indication of an exit for trend following, breakout system, or any other system that it might benefit from by sometimes reacting before other trailing stop to give off a more reliable exit signal. It works similarly to other trailing stops such as ATR based ones and Supertrend, but instead of being used for an exit or stop, it is meant more for an entry or confirmation signal. A breakout of a price pattern or S/R levels can be confirmed when the colored red/green zone changes color. Other trailing stops or exit strategies can be combined to give off a better exit.
I made this indicator so that instead of using a trailing stop line to show the direction of the breakout or trend, a colored zone is used so that it doesn't get in the way of the upper and lower lines. It can be turned off in the settings if only the support and resistance lines are needed. Other than that, this indicator doesn't need any inputs whatsoever to find out where the swing pivots points might and are found objectively using heiken ashi. I also included several alerts to signal whenever the trend direction color zone changes, when the price breaks support or resistance, or when it breaks the previous support and resistance levels.

Welles Wilder MA [MX]The average of 34 periods I observe as a mobile S/R, but I usually observe it more when it is in strong trend, and the average of 72 and 89 as trend dictators, if the asset is above them = Bullish , below = Bearish , and the 144 average as the last moving S/R, and also as an S/R even stronger than all other MAs and when the asset loses that average, I see it as final confirmation of the other previous averages.
I give more importance to the average of 89 periods than to 72, because I see it as an extension to the average of 72, as if it were a trend range.
for those who prefer to observe the crossing of short and long averages as a way to see the trend, I also left this option, although I do not use
//////////////////////////////
A média de 34 periodos eu observo como um S/R móvel, mas eu costumo observar ela mais quando está em forte tendência, estando bem bearish ou jeffish, e a média de 72 e 89 como ditadoras de tendência, se o ativo está acima delas = Bullish , abaixo = Bearish , e a média de 144 como o último S/R móvel, e também como um S/R ainda mais forte que todas as outras MA's e quando o ativo perde essa média, eu vejo como confirmação final das outras médias anteriores.
Eu dou mais importância a média de 89 períodos do que a de 72, porque eu vejo ela como uma extensão a média de 72, como se fosse um range de tendência.
para quem prefere observar o cruzamento das médias curtas com as longas como forma de ver a tendência, eu deixei também essa opção, embora eu não use
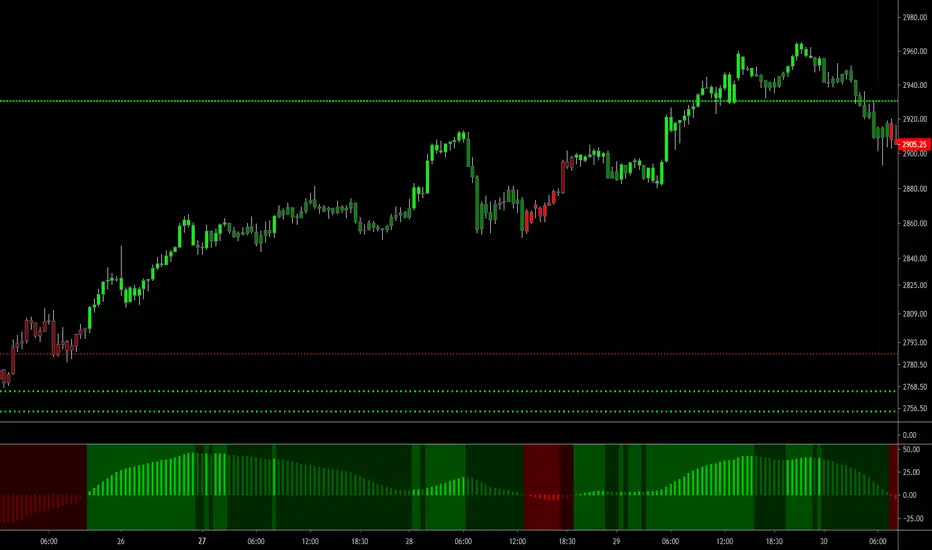
CBG Swing HighLow MAThis indicator will show the swing high and lows for the number of bars back. It's very easy to use and shows good support and resistance levels.
I then took it a step further and added a moving average with all the standard types in my indicators:
SMA
EMA
Weighted
Hull
Symmetrical
Volume Weighted
Wilder
Linear Regression
I then added Bollinger Bands to show the standard deviation from the midline.
Finally, I added a simple bar coloring scheme: green if above the upper BB, Red if below and orange if in the middle.
I am just testing this out so please use with caution. If anyone in the community wants to run some backtests, that would be great and we would all appreciate it.
Of course you can keep it all simple and turn off all the moving averages and bollinger bands.
Enjoy! :-)

CBG PaintBarsUses a linear regression of averages to paint bars.
Average types include SMA, EMA, Weighted, Hull, Symmetrical, Volume Weighted, Wilder, and Linear Regression.
CBG Keltner ChannelsKeltner Channel with the following Moving Average types: SMA, EMA, Weighted, Hull, Symmetrical, Volume Weighted, Wilder and Linear Regression. Plus 2 bands with full color shading.
The picture shows the Keltner channels with the Wilder MA, my favorite. See how easy it would have been to stay in the move down? Excellent indicator.

CBG MultiAverages ColorsThe latest version of my multiple moving averages. Now includes up to 14 moving averge lines plus a separate slow and fast moving average that can be assigned a different MA type.
In the screen shot is the fast/slow set to Hull with 15/50 periods. It is overlaid on top of my Key Numbers indicator.
7 moving averages in 1 indicator, including the Hull Moving Average .
SMA
EMA
Weighted
Hull
Symetrical
Volume Weighted
Wilder
Linear Regression
Lots of other features like background shading and paint bar colors.
RSI channel ob/os breakout [ChuckBanger]This is a breakout signal script based on reverse engineering of RSI. It shows a channel of overbought and oversold readings that the trader can sett in settings. When low crosses under lower line it shows bullish signal and when high is crossing upper line it shows a bearish signal. The script also has wilder's moving average as filter instead of high/low.
Good luck traders!

Palex 2.0Atualização do SETUP do saudoso Professor Alexandre Fernandes "Palex"
- Bandas de Bolliger (Standard) =
*Banda Superior = Média Móvel Simples (20 dias) + (2 x Desvio Padrão de 20 dias)
*Banda Inferior = Média Móvel Simples (20 dias) – (2 x Desvio Padrão de 20 dias)
- EMA 9 (Média Móvel Exponencial)
- SMA 21 (Média Móvel Simples)
- SMA 200 (Média Móvel Simples) Clássica MA 200 períodos
- SMA 400 (Média Móvel Simples)
- EMA 400 (Média Móvel Exponencial)
- WILD (Média Móvel Welles Wilder)
O mesmo usado pelo nosso grande Mestre PALEX!
Profitable RSI (Relative Strength Index)Introduction
As you know the Relative Strength Index (RSI) was originally developed by J. Welles Wilder and was described in his book "New Concepts in Technical Trading Systems" (1978). It is intended to measure the strength or weakness of an instrument for the specified period.
The most basic strategy is to use the crossovers as trade signals:
when RSI crosses above 30, go Long
when RSI crosses below 70, go Short
Exit when a crossover occurs in the opposite direction
What is this tool?
This tool is a performance scanner that uses a decision tree-based algorithm under the hood to find the most profitable settings for RSI. It analyzes the range of periods between 2 to 100 and backtests the RSI for each period using the strategy mentioned above across the entire history of an instrument. If the more profitable parameter was found, the indicator will switch its value to the found one immediately.
So, instead of manually selecting parameters just apply it to your chart and relax - the algorithm will do it for you.
The algorithm can work in two modes: Basic and Advanced "Early Switch" . The Early Switch algorithm makes some assumptions and activates a set of optimizations to find the better setting DURING the trades, not after they were closed.
The difference is illustrated on the screenshot below:
Additionally you can set up a backtest window through indicator's settings (the optimizers which were published before will get this feature soon).
Alerts
It has a special alert that notifies when a more profitable period was detected.
NOTE: It does not change what has already been plotted.
NOTE 2: This is not a strategy, but an algorithmic optimizer.
Day after day. Night after night.
I've been waiting to program again.
Day after day. Night by to night.
Trading is waiting inside your heart.

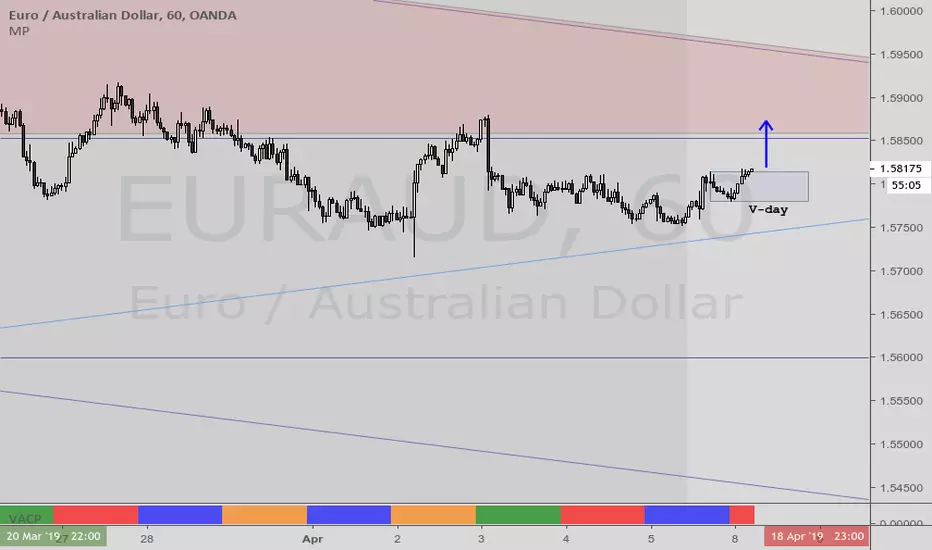
VACPWelles Wilder (delta phenomenon) a 4-day rotation indicator
PVAC is the acronym Alan uses for a four-day rotation cycle. The cycle itself is circularly continuous every days of the week, forever, including every holiday. Thus if, for instance, Monday was a P, Tuesday is V, Wednesday is A, Thursday is C. At this point the cycle repeats, with Friday being P, Saturday being V, Sunday being A, and the following Monday being C.
Having started, the cycle never changes. While each day tends to have the characteristics shown below, like all cycle tools, there are inversions, which will last a cycle or at times even more, and have reasonable odds of inverting regularly.
A trader who wants to incorporate a four-day rotation cycle into their work is encouraged to study for themselves whether this adds value.
Day: V-day Color: Red Characteristics: Closes well for bulls; Use your fleece bars Bar8 and Bar11; Bar8 open often a V-day return target; 'V' return comes early in day in bear moves, late in day in bullish moves
Day: A-day Color: Blue Characteristics: Closes poorly for bulls; Use your fleece bars 8 and 11; Generally 'A' shaped, but may have a kick-leg after 3pm
Day: C-day Color: Orange Characteristics: Consolidation day, aka 'consoly' day. It may not chop, but it may have an
accumulation or distribution quality to the action; Trade often and trade fast; Pattern traders fade 4HHs and 4LLs with backfill/pullbacks 3 bars later; Apexes and angulars tend to have less importance; Numerical traders trade after Bar8 open and use support one horizontal below, resistance one horizontal above; C-day opens often at the 25%; The afternoon action tends to be opposite to the morning action
Day: P-day Color: Green Characteristics: Often a trend day. Find the trend and enter it; Often opens at the 75%; Trade P-days against a quartile; Watch for price to be above/below the first apex: buy above or sell below ; Do not fade dead zone, minimal trading
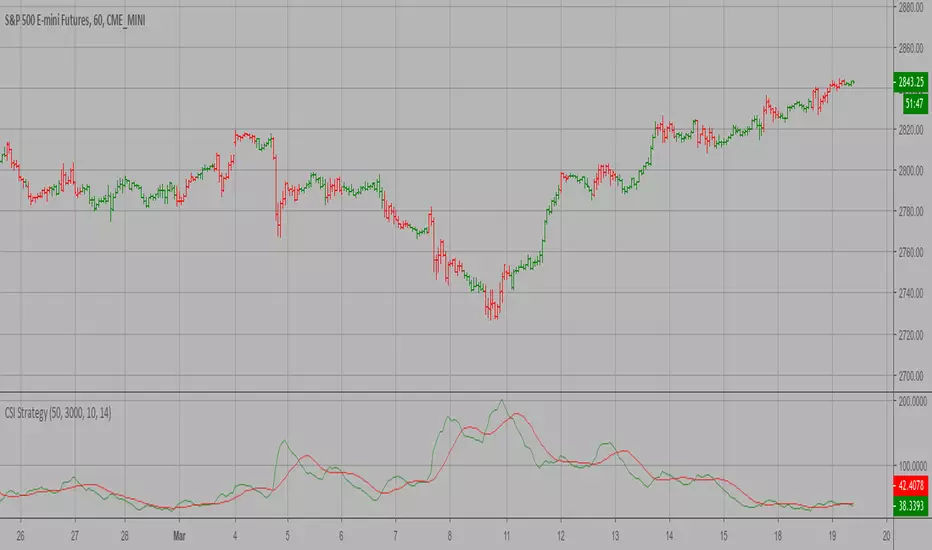
Commodity Selection Index Strategy The Commodity Selection Index ("CSI") is a momentum indicator. It was
developed by Welles Wilder and is presented in his book New Concepts in
Technical Trading Systems. The name of the index reflects its primary purpose.
That is, to help select commodities suitable for short-term trading.
A high CSI rating indicates that the commodity has strong trending and volatility
characteristics. The trending characteristics are brought out by the Directional
Movement factor in the calculation--the volatility characteristic by the Average
True Range factor.
Wilder's approach is to trade commodities with high CSI values (relative to other
commodities). Because these commodities are highly volatile, they have the potential
to make the "most money in the shortest period of time." High CSI values imply
trending characteristics which make it easier to trade the security.
The Commodity Selection Index is designed for short-term traders who can handle
the risks associated with highly volatile markets.
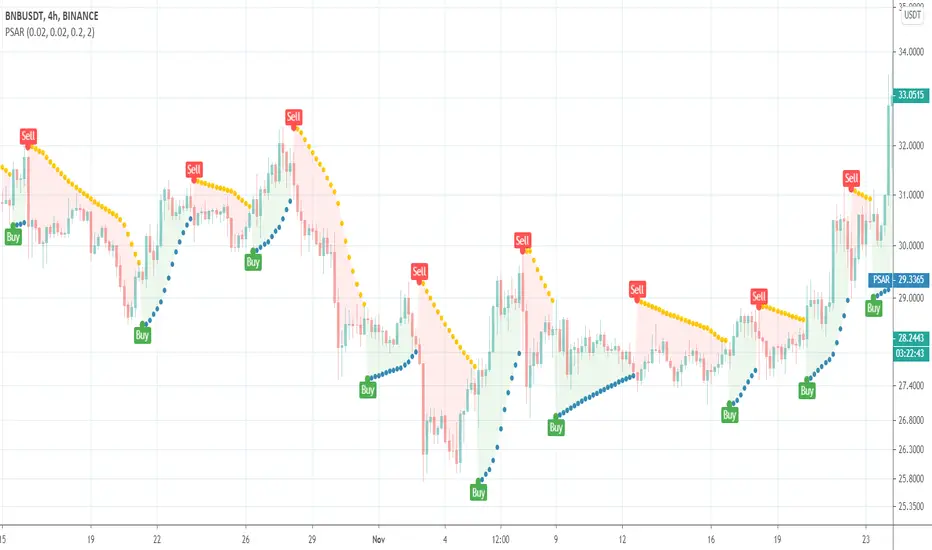
Parabolic SARThis is a redesign of the built-in Parabolic SAR indicator. I added a proper input system, an option to highlight initial points for both lines and an option to choose points width. So, customize it as you want.
Parabolic SAR was originally developed by J. Welles Wilder and described in his book "New Concepts in Technical Trading Systems" (1978). It is a trend-following indicator that can be used as a trailing stop loss.
To know which settings for PSAR are the most profitable on your instrument and timeframe you can use this tool
Profitable Parabolic SAR
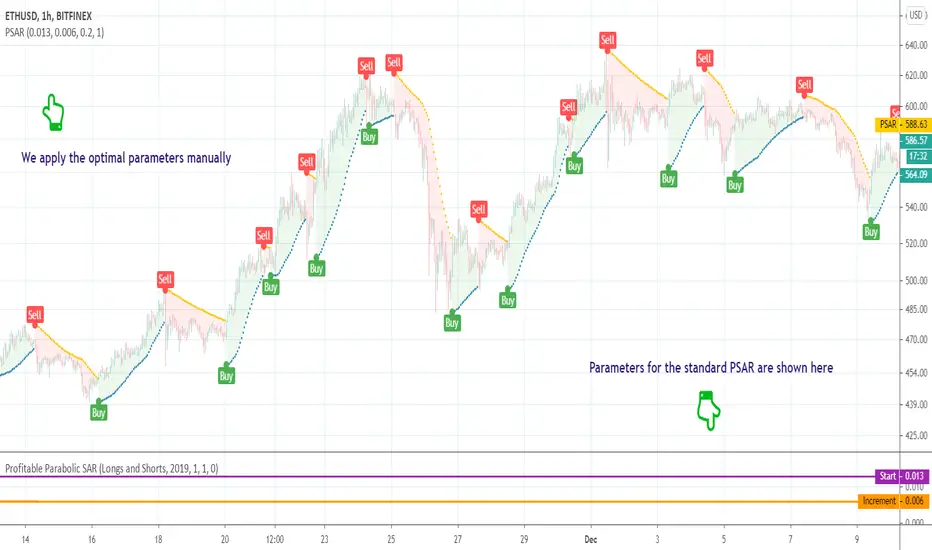
Profitable Parabolic SARHello friends,
This script is a powerful, non-repainting optimizer for the classic Parabolic Stop and Reverse (PSAR) — one of J. Welles Wilder's most respected trend-following systems. It automatically finds and applies the most profitable PSAR settings for each instrument and timeframe, eliminating the need for manual parameter tuning.
🛠 How It Works
The indicator evaluates over 500 combinations of PSAR parameters using a decision tree–based algorithm under the hood .
Each configuration is backtested across the instrument's full price history, and when a more profitable setup is identified, the indicator seamlessly switches to those values in real time — while maintaining the original PSAR logic.
The Maximum parameter remains fixed since its impact on overall profitability is minimal compared to Start and Increment.
This self-adjusting approach removes the guesswork of parameter optimization and keeps the PSAR dynamically tuned to changing market regimes.
💡 Integrated Versions Explained
This all-in-one tool merges 3 complementary indicators:
• Profitable PSAR — A parameter optimizer that runs in a separate window below your main chart. It doesn't generate buy/sell signals directly but analyzes your specific asset and timeframe to find optimal settings. These are displayed as two lines (purple and orange), with optional labels showing the actual parameter values. Once identified, you can apply these optimal values manually to the standard PSAR.
• Self-Adjusting PSAR — A real-time overlay version that looks and behaves like the standard PSAR but automatically adjusts its parameters on the fly. It requires no manual configuration and can be paired with the Profitable PSAR to monitor which settings are currently active.
• Compact Self-Adjusting PSAR — A minimalist oscillator version that reflects the same adaptive logic through simple binary outputs: -1 for Sell and 1 for Buy. This variant is ideal for filtering or signal integration into other systems.
Together, they form a unified adaptive system that gives users both automation and interpretability — the best of both worlds.
🔥 Key Features
Adaptive optimization powered by a decision tree–based algorithm
Real-time switching to more profitable parameter configurations
Direction filter (Longs | Shorts | Longs & Shorts)
Optional analysis start date for focused historical testing
Commission customization for realistic performance modeling
Visual highlighting of parameter changes
Optional buy/sell labels and compact trend signal display
If you'd like access or have any questions, feel free to reach out to me directly via DM.
👋 Good luck and happy trading!
Paid script
Relative Strength IndexEvery developer must create his own Relative Strength Index with midline and other features).
In addition to the midline, highlighting and levels customization I give you ability to play with non-standard sources like On Balance Volume.
If someone doesn't know what is this:
This indicator was originally developed by J. Welles Wilder and was described in his book "New Concepts in Technical Trading Systems" (1978). It is intended to measure the strength or weakness of an instrument for the specified period.
RSI is a momentum oscillator and can have a reading from 0 to 100. The values of 70 or above indicate that an instrument is becoming overbought or overvalued and may be primed for a trend reversal or corrective pullback in price. The values of 30 or below indicates an oversold or undervalued condition.
The other significant signals are divergences with price and middle line crossovers. RSI if one the most used indicators on the planet.
Enjoy and good luck!

RSI ATR ChannelDraws a channel based on ATR (Average True Range) and RSI. Detects band touches and colors the background appropriately.

Heracles Original Wilder's ADX and DI +/- by ZekisOriginal Wilder's ADX and DI +/- (calculated with the 1978's original formula from Wilder's MA and not with the simple moving average, like almost all ADXs)
I changed the aspect for a nice and easy view
Black/yellow dashed line - threshold
Light blue line = ADX
Blue background - ADX above threshold
Yellow background - ADX bellow threshold
Green line - DI +
Red line - DI -
Green DI+/- background and green triangles - uptrend
Red DI +/- background and red triangles - downtrend
Candlesticks are colored according to the pattern
Possibility to enable or disable trend filter (threshold)
Alerts are added for entries and exits or longs or shorts
Green triangle - long/enter
Red triangle - short/exit
Yellow contaminated area - no certain trend
Green candles - uptrend
Red candles - downtrend
Yellow candles - no certain trend
Enjoy!
@ Zekis

Oscillators EqualizerAn oscillator of the oscillators. This is one of my private indicators that implements a quantitative approach: it collects readings from internal oscillators and calculates scores for the selected metric.
Features
46 well-known oscillators
6 metrics ( Bands Breakouts , Overbought/Oversold , Above/Below Middle Line , Middle Line Crossovers , Above/Below Signal Line , Signal Line Crossovers )
Oscillators customization
Implemented oscillators
Relative Strength Index (by J. Welles Wilder)
Chande Momentum Oscillator (by Tushar S. Chande)
Intraday Momentum Index (by Tushar S. Chande)
Stochastic RSI (by Tushar S. Chande and Stanley Kroll)
Aroon Oscillator (by Tushar S. Chande)
R-Squared Index (by Tushar S. Chande and Stanley Kroll)
Forecast Oscillator (by Tushar S. Chande)
Relative Momentum Index (by Roger Altman)
Moving Average Convergence/Divergence (by Gerald Appel)
Connors RSI (by Larry Connors)
Rapid RSI (by Ian Copsey)
Relative Spread Strength (by Ian Copsey)
Vortex Indicator (by Etienne Botes and Douglas Siepman)
Random Walk Index (by Michael Poulos)
True Strength Index (by William Blau)
Stochastic Momentum Index (by William Blau)
Ergodic Oscillator (by William Blau)
Smoothed Rate Of Change (by Fred G. Schutzman)
TRIX (by Jack Hutson)
Pretty Good Oscillator (by Mark Johnson)
Choppiness Index (by Bill Dreiss)
Tick Line Momentum Oscillator (by Daniel E. Downing)
Price Momentum Oscillator
Relative Volatility Index (by Donald Dorsey)
Trend Trigger Factor (by M. H. Pee)
Trend Intensity Index (by M. H. Pee)
Trend Detection Index (by M. H. Pee)
Trend Continuation Factor (by M. H. Pee)
Relative Vigor Index (by John F. Ehlers)
Fisher Transform (by John F. Ehlers)
CG Oscillator (by John F. Ehlers)
Stochastic CG Oscillator (by John F. Ehlers)
Laguerre RSI (by John F. Ehlers)
Rocket RSI (by John F. Ehlers)
Recursive Median Oscillator (by John F. Ehlers)
Super Passband Filter (by John F. Ehlers)
Roofing Filter (by John F. Ehlers)
Ehlers Stochastic (by John F. Ehlers)
Fisherized Deviation-Scaled Oscillator (by John F. Ehlers)
Bollinger Bands %B (by John Bollinger)
Williams %R (by Larry Williams)
Ultimate Oscillator (by Larry Williams)
Money Flow Index (by Gene Quong and Avrum Soudack)
Commodity Channel Index (by Donald Lambert)
Ease of Movement (by Richard W. Arms)
Chaikin Money Flow (by Marc Chaikin)

Average Directional Movement Index Rating ADXR by KIVANÇ fr3762Average Directional Movement Rating quantifies momentum change in the ADX . It is calculated by adding two values of ADX (the current value and a value n periods back), then dividing by two. This additional smoothing makes the ADXR slightly less responsive than ADX . The interpretation is the same as the ADX ; the higher the value, the stronger the trend.
The ADXR , being a smoothed version of ADX , and can be used similarly to the ADX in the three rule system discussed on the ADX section..
The ADXR is a measure of the spread between the Directional Indicators ( +DI and -DI ). When the ADXR is declining, it's not advised to use a trend following system. However, a rising ADXR signals that the dominant trend is likely to continue. A rising ADXR , with both the ADXR and DI+ above the D- indicates a strengthening bullish market. The scan syntax needed to represent this condition would be...
ADXR > DIMINUS AND DIPLUS > DIMINUS AND ADXR > ADXR .1
A rising ADXR , with both the ADXR and DI- above DI+ indicates a strengthening bearish trend . The scan syntax needed to represent this condition would be...
ADXR > DIPLUS AND DIMINUS > DIPLUS AND ADXR > ADXR .1
If the ADXR has been below both DI+ and DI- but has begun to rise a new market trend is emerging. The scan syntax needed to represent this condition would be...
ADXR < DIPLUS AND ADXR < DIMINUS AND ADXR > ADXR .1
IMPORTANT NOTICE: USERS CAN ADD ADX DI+ and DI- indicators by checking the box in the settings of the indicator.
Developed by J.Welles Wilder
ÖNEMLİ BİLGİ: KULLANICILAR ADX , DI- ve DI+ indikatörlerini de ayarlar bölümündeki kutucukları işaretleyerek sayfaya ekleyebilirler.

Wilder's RSIThe Wilder's RSI provides signals that tell investors to buy when the security or currency is oversold and to sell when it is overbought.
Best Setup -> 5M, 15M Charts used Level 20 (oversold) & 80 (overbought) , RSI Length at 20 and EMA Of RSI Length at 9
EnJoy ;)

WILDER'S Moving Average by fr3762 KIVANCThe Wilder’s Moving Average indicator (Wilder’s Smoothed Moving Average ) was developed by Welles Wilder and introduced in his 1978 book, “New Concepts in Technical Trading Systems.” Mr. Wilder did not use the standard EMA formula; instead, the following formula is used: EMA = Input * K + EMA * (1-K), where K = 2 / (N+1). Then to find the Wilder’s Moving Average, the following calculation is performed: Input * K + EMA * (1-K), where K =1/N.
Type to use
Moving averages are commonly used to identify trends and reversals as well as identifying support and resistance levels. Moving averages such the WMA and EMA , which are more sensitive to recent prices (experience less lag with price) will turn before an SMA . They are therefore more suitable for dynamic trades, which are reactive to short term price movements. Moving averages such as the SMA move more slowly providing valuable information on the long dominant trend. They can however be prone to giving late signals causing the trader to miss significant parts of the price movement.
Trade Signals
Moving Average Crossovers: Moving average crossovers is a term applied when more than one moving average is used to generate a trade signal where traders will act when the shorter term moving average crosses the longer term moving average. A bullish crossover occurs when the shorter term moving average crosses above the longer term moving average (golden cross). A bearish crossover occurs where the shorter term moving average crosses below the longer term moving average (dead cross).
Price crossovers: A Price crossover is a term applied when a signal is generated where the price crosses a moving average. Bullish signals are given when the price moves above the moving average, bearish signals are given when the price moves below the moving average. Crossover trades are more likely to enjoy success when the moving average slopes are in the direction of the trade.
Support and Resistance: Moving averages can also act as a support level in an uptrend and resistance levels in a downtrend. If the average is widely followed orders in favour of the trend often cluster around the average. As markets are often driven by emotion and many players trade counter to the trend expect overshoots, to this extent the average should be used to identify support and resistance zones rather than exact levels.
from: mahifx.com
Developed by WELLES WILDER