Volume–Phase Analyzer ProVolume–Phase Analyzer Pro – Trend & Institutional Volume Phases
This indicator analyzes how volume behaves relative to price movement to detect whether the market is in Accumulation, Markup, Distribution, or Markdown — the same phases institutions track in professional trading.
Unlike regular volume/MA mashups, this tool combines:
• Institutional volume classification (HighVol Up/Down, LowVol, Confused Vol)
• Price–volume efficiency and wick dominance
• Multi-Timeframe directional filters
• Volatility compression signals using Bollinger Width
• Volume mapped directly into the price chart as candles
• Smart signal engine with cooldown (prevents repeated signal spam)
This helps reveal w hen Smart Money is accumulating, pushing trends, unloading positions, or flushing liquidity.
────────────────────────────────────
How It Works
1️⃣ Volume Strength vs Average Volume
Identifies whether a move is backed by genuine buying/selling power.
2️⃣ Wick & Body Analysis
Confirms whether volume produced meaningful directional pressure — not just noise.
3️⃣ Trend Alignment
Fast EMA vs Slow EMA ensures signals align with active trend.
4️⃣ Higher-Timeframe Confirmation
Confirms if current movement agrees with a larger directional bias.
5️⃣ Compression Detection
When price volatility contracts while high-volume bars appear → phase shift often ahead.
────────────────────────────────────
Signals
BUY → Confirmed bullish demand with trend backing
SELL → Confirmed bearish supply taking control
TRAP → Likely stop-hunt or absorption — often before reversal
Signals only appear when multiple institutional conditions align.
A cooldown prevents repetitive signals like BUY-BUY-BUY.
────────────────────────────────────
Background shading helps visually locate these phases.
Markup phase:
• Meaning: Buyers are in control and the market is trending up
• Background color: Light green
Markdown phase:
• Meaning: Sellers are in control and the market is trending down
• Background color: Light red
Accumulation phase:
• Meaning: Smart Money quietly buying near the bottom before an uptrend
• Background color: Teal (blue-green)
Distribution phase:
• Meaning: Smart Money quietly selling near the top before a downtrend
• Background color: Light orange/yellow
Consolidation phase:
• Meaning: Sideways movement with low conviction
• Background color: Very light grey
Transition phase:
• Meaning: Market has not picked a direction yet
• Background color: No shading (clear background)
⸻
Quick Usage Notes
• Best trades are Buy signals during Markup and Sell signals during Markdown
• Accumulation and Distribution often come before reversals
• Consolidation is a low-quality trading zone
────────────────────────────────────
How to Trade It
• Take BUY signals during Markup
• Take SELL signals during Markdown
• Expect reversals near Trap signals, especially when phase is changing
• Avoid over-trading Consolidation zones
• Volume candles below price reveal when momentum is increasing or fading
Best applied on 5m–1H for intraday and swing confirmation.
────────────────────────────────────
Why This Indicator Is Unique
• It uses p rice-volume efficiency , not standard lagging signals
• It detects S mart Money intent , not retail reactions
• It avoids spam signals using an internal cooldown logic
• It gives context, not just entries — via live market-phase analysis
This makes it a multi-purpose tool for trend trading, breakout trading, and reversal anticipation.
────────────────────────────────────
Alerts Included
• Buy/Sell/Trap Signals
• Phase Change Alerts
────────────────────────────────────
This is a free tool and meant for educational use only.
Always use proper risk management.
────────────────────────────────────
X-volume

Daily & Average Dollar VolumeCalculates the daily and average (20D) $ volume.
Fully customizable appearence and can be placed in any corner.

Turnover (Volume * HLC/3)Let's get the elephant out of the room. Everyone knows volume is the key to validate price movement, but you can't compare two volume candles of the same stock when the price is 3 times different you need to account for that. So here it is, Turnover chart, to replace volume entirely, because why would you look at volume when you can look at turnover instead?

RT-Split VolumeSplit Volume is a volume analytics tool that separates estimated buy and sell volume for each bar, highlights abnormal activity, and makes it easier to see when larger participants may be stepping in or out of the market.
Split Volume Introduction
Traditional volume tools only show you the data for the candle that "won". This leaves traders in the dark about the balance between buying and selling behind each bar. Often a candle close is a photo finish between bulls and bears, and other times it is hardly a battle at all.
The Split Volume Indicator looks at both sides of the flow and identifies which volume candles have been flagged as anomalies compared with the surrounding volume bars. It is designed to provide additional context around where and how volume is flowing, rather than only showing total volume per candle.
Traditional Volume vs Split Volume
While volume is one of the most important signals a trader can watch, traditional volume indicators only show a single bar for each candle. Only looking at one side of the story puts the trader at a disadvantage. Sometimes the battle between the bears and the bulls is a photo finish, and sometimes it is hardly a battle at all.
In the comparison chart below, the middle pane shows TradingView's built in Volume indicator, while the lower pane shows Split Volume, so you can compare a single bar view with the split buy and sell view side by side.
Split Volume estimates buy and sell pressure separately and plots them on different halves of the panel. This gives a clearer picture of what is actually happening in the underlying order flow, not just which side closed the bar.
How Split Volume Works
The Split Volume Indicator uses an algorithm to estimate the buy and sell volume for each candle. All of the estimated buy volume is placed on the upper half of the indicator, while all of the estimated sell volume is placed on the lower half of the indicator.
As the bulls and bears trade back and forth on each candle, the algorithm also calculates a baseline average of the volume being traded over a rolling window. This dynamic baseline is shown by the gray Ghost Line.
When either the buy side or the sell side volume spikes well above that Ghost Line, the corresponding bars are flagged as abnormal. These abnormal spikes are color coded so they stand out against normal background activity.
Volume Candle Types
Green volume candles - Normal buying volume above the midline.
Blue volume candles - Abnormal buying volume above the Ghost Line.
Red volume candles - Normal selling volume below the midline.
Yellow volume candles - Abnormal selling volume below the Ghost Line.
Volume Impulses
One key pattern to watch with Split Volume is volume impulses: short bursts of concentrated activity that stand out from the Ghost Line baseline. These can be easy to miss with standard volume bars but become very obvious when normal and abnormal buy and sell flows are separated.
Settings
Volume in USD toggle On/Off - Switch between volume being displayed in USD or in the number of units (stocks or tokens) being traded. This change is reflected on the Y axis of the indicator.
Volume smoother - Changes the smoothness setting of the Ghost Line. Higher values make the baseline slower and smoother, and lower values make it more responsive to recent changes in activity.
Volume displacement shifter - Adjusts the vertical height of the Ghost Line. This lets traders control where they want abnormal blue and yellow volume candles to start triggering.
What Makes This Tool Different
Separates estimated buy and sell volume into their own zones instead of showing a single undifferentiated volume bar.
Uses a dynamic Ghost Line baseline so spikes are judged relative to recent activity, not a fixed threshold.
Highlights abnormal volume with clear color coding, making it easier to see when activity is concentrated on one side of the tape.
Emphasizes volume impulses and clusters that can precede or accompany larger moves, rather than only tracking total daily or session volume.
This indicator is intended to provide additional context around order flow and volume behavior. It is not a standalone signal generator and should always be used together with your own analysis, risk management and trading plan. Historical volume patterns do not guarantee future results.
🐋 Tight lines and happy trading!

1x RVOL Bull/Bear Painter v2Relative volume candle indicator registers bull and bear relative volume, at a threshold of 1 or greater. This can be modified to your liking. Use this to enter a strong trend on any time frame.

Dobrusky Pressure CoreWhat it does & who it’s for
Dobrusky Pressure Core is a volume by time replacement for traders who care about which side actually controls each bar. Instead of just plotting total volume, it splits each bar into estimated buy vs sell pressure and overlays a custom, session-aware volume baseline. It’s built for discretionary traders who want more nuanced volume context for entries, breakouts, and pullbacks.
Core ideas
Buy/sell pressure split: Each bar’s volume is broken into estimated buying and selling pressure.
Dominant side highlighting: The dominant side (buy or sell) is always displayed starting from the bottom of the bar, so you can quickly see who “owned” that bar.
Median-based baseline: Uses the median of the last N bars (50 by default) to build a robust volume baseline that’s less sensitive to one-off spikes.
Session-aware behavior: Baseline is calculated from Regular Trading Hours (RTH) by default, with an option to include Extended Hours (ETH) and a control to force Regular data on higher timeframes.
Volume regimes: Three multipliers (1x, 1.5x, 2x by default) show normal, high, and extreme volume regions.
Flexible display: Baseline can be shown as lines or as columns behind the volume, with full color customization.
How the pressure logic works
For each bar, the script:
Adjusts the range for gaps relative to the prior close so the “true” traded range is more consistent.
Computes buy pressure as a proportion of the adjusted range from low to close.
Defines sell pressure as: total volume minus buy pressure.
Marks the bar as buy-dominant if buy pressure ≥ sell pressure, otherwise sell-dominant, and colors the dominant side from the bottom to at least the midpoint using the selected buy/sell colors.
In practice, this turns basic volume columns into bars where the internal split and dominant side are clearly visible, helping you judge whether aggressive buyers or sellers truly controlled the bar instead of just looking at the price action.
Volume baseline & session logic
The script builds a session-aware baseline from recent volume:
Baseline length: A rolling window (default 50 bars) is used to compute a median volume value instead of a simple moving average.
RTH-only by default: By default, the baseline is built from Regular Trading Hours bars only. During extended hours, the baseline effectively “freezes” at the last RTH-derived value unless you choose to include extended session data.
Extended mode: If you select Extended mode, the script builds separate rolling baselines for RTH and ETH trading, using the appropriate one depending on the current session.
Force Regular Above Timeframe: On timeframes equal to or higher than your chosen threshold, the baseline automatically uses Regular session data, even if Extended is selected.
Multipliers: Three adjustable multipliers (1x, 1.5x, 2x by default) create normal, high, and extreme volume bands for quick identification.
This lets you choose whether you want a pure RTH reference or a baseline that adapts to extended-session activity.
Example ways to use it
1. Replace standard volume bars
Add Dobrusky Pressure Core to your volume pane and hide the default volume if you prefer a clean look.
Use the colors and split to see at a glance whether buyers or sellers were dominant on each bar.
2. Pressure confirmation for entries
For longs (example concept; adapt to your own rules):
Require that the entry bar’s buy pressure is greater than the previous bar’s sell pressure , or
If the entry and prior bar are both buy-dominant, require that the entry bar has more buy pressure than the prior bar.
This helps avoid taking a long when buying pressure is clearly fading relative to what sellers recently showed. A mirrored idea can be used for short setups with sell pressure.
3. Context from baseline multipliers
Use ~1x baseline as “normal” volume.
Watch for bars at or above 1.5x baseline when you want to see increased participation.
Treat 2x baseline and above as “extreme” volume zones that may mark climactic or especially important bars.
In practice, the baseline and multipliers are best used as context and filters, not as rigid rules.
Settings overview
Display
- Show Volume Baseline: toggle the baseline and its levels on or off.
- Baseline Display: choose between Line or Bars for the baseline visualization.
Baseline Calculation
- Length: lookback for the median baseline (default 50, configurable).
- Baseline Session Data: choose Regular or Extended to control which session data feeds the baseline.
Session Controls
- Regular Session (Local to TZ): define your RTH window (e.g., 0930-1600).
- Session Time Zone: choose the time zone used for that window.
- Force Regular Above Timeframe: on higher timeframes, force the baseline to use Regular session data only.
Baseline Levels
- Show Level x Multiplier 1/2/3: toggle each volume regime level.
- Multiplier 1/2/3: define what you consider normal, high, and extreme volume (defaults: 1.0, 1.5, 2.0).
Colors
- Buy Volume / Sell Volume: choose colors for buy and sell pressure.
- Baseline Bars (Base / x2 / x3): colors when the baseline is drawn as columns.
- Baseline Line (Base / x2 / x3): colors when the baseline is drawn as lines.
Limitations & best practices
This is a decision-support and visualization tool, not a buy/sell signal generator.
Best suited to markets where volume data is meaningful (e.g., index futures, liquid equities, liquid crypto).
The usefulness of any volume-based metric depends on the underlying data feed and instrument structure.
Always combine pressure and baseline context with your own strategy, risk management, and testing.
Originality
Most volume tools either show total volume only or compare it to a simple moving average. Dobrusky Pressure Core combines:
An intrabar buy/sell pressure split based on a gap-adjusted price range.
A median-based, configurable baseline built from session-specific data.
Session-aware behavior that keeps the baseline focused on Regular hours by default, with the option to incorporate Extended hours and force Regular data on higher timeframes.
The goal is to give traders a richer, session-aware view of participation and pressure that standard volume bars and simple SMA overlays don’t provide, while keeping everything transparent and open-source so users can review and adapt the logic.

High Quality Setup Detector (Ultimate Edition)High Quality Setup Detector (Ultimate Edition)
A complete, rules-based detector for identifying elite high-probability trading setups based on volatility contraction, trend alignment, volume behavior, RS strength, and classic breakout conditions.
This script consolidates multiple proven technical concepts into one unified scoring system — giving traders a fast, objective way to evaluate the overall quality of any chart.
🔍 What This Tool Does
The indicator evaluates 16–18 technical conditions (depending on whether RS is enabled) and assigns each chart a Total Quality Score.
You instantly see:
✔ ADR volatility quality
✔ Big move + constructive pullback
✔ Higher lows (constructive structure)
✔ Trend alignment (20/50/150/200)
✔ Dollar volume strength
✔ Volatility contraction (ATR ratio)
✔ Volume dry-up before breakout
✔ RSI health
✔ Pocket pivot
✔ Extension from the 50-day
✔ Near pivot high
✔ Optional: Sector RS + Ticker RS
The result appears in a clean, color-coded table displayed on-chart.
🎯 Scoring System
Every condition is worth 1 point.
Based on your total score:
🔥 Best Setup — high probability
🟡 Good Setup — decent but not top-tier
🔴 Weak — avoid
This helps keep you disciplined and objective, even during choppy markets.
📊 RS Rating System (Optional)
Enable RS to compute:
Sector RS strength using mapped sector ETFs
Ticker RS strength using a percentile-based multi-quarter performance model
Both follow a full 1–99 rating scale.
🧩 Customizable Display
Adjustable text size (Tiny → Huge)
Clean 3-column diagnostics table
Organized into logical categories (Trend, Volume, Volatility, RS, etc.)
💡 Ideal For
Growth traders
Breakout traders
VCP / volatility contraction pattern traders
Swing traders who want rule-based confirmation
Anyone who wants structured, systematic chart evaluation
Delta Volume RSI1. Introduction
The Delta Volume RSI (Relative Strength Index based on Volume Delta) indicator provides a unique perspective on market momentum by analyzing the average gains and losses of the volume delta —the difference between buying and selling volume—over a specified period. Unlike traditional RSI, which focuses on price changes, this indicator evaluates shifts in market participation intensity, helping traders detect periods of accumulation and distribution through volume action.
2. Key Features
- Volume-Based Calculation: Computes RSI using the average gains and losses of delta volume rather than price changes, offering insights into buying/selling pressure.
- Dynamic Color Coding: Paints the indicator line green when above the 50 level, and red when below, enabling quick visual identification of momentum shifts around neutrality.
- Reference Levels: Clearly displays overbought (70), neutral (50), and oversold (30) lines for context on volume-driven market extremes.
- Customizable Period: Users can set the period for RSI calculation to fit their trading style and timeframe preferences.
3. How to Use
1. Interpret Colors: The indicator line turns green when volume delta momentum is bullish (above 50) and red when bearish (below 50). Overbought and oversold zones (above 70 or below 30) may highlight exhaustion in volume-driven pushes.
2. Adjustment: Modify the RSI period in the settings to tailor responsiveness.
3. Reference Line: Use the dashed gray line at 50 as a core threshold for detecting transitions between buyer and seller dominance.
How It Differs From Standard RSI
The standard RSI uses changes in closing price to calculate market momentum. In contrast, this indicator calculates RSI using the average gains and losses of the delta volume , capturing underlying shifts in buying and selling activity—even when price is flat. This makes the Delta Volume RSI especially useful for identifying divergence between volume flow and price movement, potentially signaling strong accumulation/distribution or market reversals not visible on price-based RSI alone.

Candle Volume CoreIA VolCore — Candle Volume Core
Indicator Overview
IA VolCore is an intra‑candle volume analysis tool that shows where the core traded volume is concentrated inside each candle.
It visualizes how buyers and sellers interacted within the bar and highlights key levels and zones where the highest activity takes place.
How Calculations Work
The indicator uses the lowest available timeframe data to calculate volume distribution inside each candle.
If you have a Premium or higher subscription, VolCore uses second‑based data for the most accurate results. Older candles (where second‑data is no longer available due to platform limits) are calculated using minute data. The indicator can therefore be used on any timeframe from 1 minute and higher.
If you do not have Premium, the indicator uses minute‑based data only, so it is recommended to use it from the daily timeframe and above.
Example of Calculation
If the chart timeframe is 1 hour and the lowest available timeframe is 1‑second data, the indicator loads 3600 1‑second candles. Each 1‑second candle has a known volume, which is evenly distributed across its own price range.
The 1‑hour candle is then divided into a number of price ranges based on the Candle Volume Resolution parameter. The volumes of all 3600 1-second candles are then aggregated into the corresponding price ranges of the hourly candle.
The final result is a detailed intra‑candle volume map for the entire hour — calculated using the most precise data available.
Custom Timeframe Parameter
If Use Custom Timeframe is enabled and a timeframe is selected, all calculations will be performed strictly using this specified timeframe.
For example: if the chart is on 1D, the user has 1‑second data available, but Custom TF is set to 1 minute, then the volume distribution inside each daily candle will be calculated using 1‑minute candles.
Key Features
Candle Volume Resolution — defines how many price ranges each candle is divided into (3–50,000). All calculations in the indicator are based on this resolution.
Max Volume Level — displays the price level inside the candle where the maximum volume occurred.
% of Volume (1, 2, 3) — defines percentages of the candle's total volume (e.g., 33%, 66%, 50%). For each percentage, VolCore finds the minimum price range containing that share of volume. You can view the corresponding volume values for these shares in histogram form via the Show: Vol % 1–3 parameters. The actual intra-candle zones are displayed using the Show area option.
Volume % for Density — sets the volume percentage used to calculate Vol Density, which reflects how concentrated the volume is inside the selected price range.
Display Parameters (Show)
Show: Vol % 1–3 — shows histograms of volume share zones based on the selected "% of Volume" parameters (with color logic applied).
Show: Max Volume Value — displays the maximum internal volume value for each candle as a histogram (with color logic applied).
Show: Volume — displays the candle's total volume (with color logic applied).
Show: Vol Density — shows the density of volume distribution inside the candle for the selected volume percentage (with color logic applied).
Example Use Cases (not a complete list)
IA VolCore shows where liquidity forms inside each candle, how volume is distributed, and how concentrated trading activity is.
Detecting False Breakouts
If a breakout candle shows increased volume, and after the breakout the core volume forms beyond the level, but the price moves back — VolCore provides a strong signal of a false breakout.
Examples:
Identifying Support & Resistance Zones
If Max Volume Level repeatedly forms in the same internal range over multiple candles, this indicates a hidden support or resistance level.
Example:
Who This Indicator Is For
For traders using volume‑based and contextual market analysis, and for IA (Initiative Analysis) ecosystem users who want a deeper understanding of intra‑candle structure.
Histogram Color Logic
IA VolCore uses three color shades to highlight volume behavior relative to previous candles:
light shade — normal volume, no significant change,
medium shade — volume exceeds both previous candles,
dark shade — volume exceeds the sum of the previous two candles.
This helps quickly spot growing activity and potential shifts in market pressure.
Style Settings
Line styles, histogram styles, and colors can be customized in the indicator’s Style tab.
Delta Manipulation FootprintIntroduction
The Delta Manipulation Footprint indicator highlights significant shifts in volume delta between consecutive candles, helping traders visually identify potential market manipulation or strong buying/selling pressure. By analyzing the difference in buy and sell volume (delta) and its changes over time, this indicator reveals aggressive market behavior often associated with big players.
Key Features
- Calculates the absolute difference of volume delta between candles, maintaining the direction of change.
- Uses a customizable moving average and threshold multiplier to filter meaningful volume shifts.
- Colors candles green when delta difference is notably increasing, and red when decreasing, for clear visual signals.
- Fully overlays the main price chart, painting candles directly for intuitive interpretation.
How to Use
Apply this indicator to your price chart to instantly visualize periods of significant volume delta shifts. Look for green candles signaling rising buying pressure and red candles showing increasing selling pressure. Adjust the moving average length and threshold multiplier inputs to tune sensitivity to your trading style or particular market behavior. Use in conjunction with other price action and volume indicators to confirm signals and improve trade timing.
This tool is ideal for traders aiming to spot footprint-like manipulations in volume delta, aiding in the detection of institutional activity and potential market turning points.

Effort HeatmapThe Effort Heatmap visualizes where meaningful, same-direction volume occurred inside an imbalance during strong directional movement.
Instead of analyzing total bar volume or traditional volume-at-price distributions, this tool reconstructs a simplified internal volume profile using lower-timeframe data.
When a Fair Value Gap forms during a high-volume displacement, the script highlights the portions of the imbalance candle where directional effort was concentrated and projects those regions forward as a heatmap.
The purpose of this indicator is not to predict price or represent institutional activity, but to offer a visual way to study how the market delivered volume inside a move that created an imbalance.
How It Works
1. Lower-Timeframe Volume Extraction
The indicator retrieves open, close, and volume data from a selected lower timeframe.
Only sub-candles that move in the same direction as the previous bar are considered, ensuring the heatmap reflects directional effort—not mixed volume.
2. Candle Body Binning
The FVG candle is divided into multiple horizontal bins.
Each lower-timeframe sub-candle contributes volume proportionally to the bins it overlaps, creating a vertical volume distribution for that bar.
3. Imbalance (FVG) Detection
A simple 3-bar displacement logic detects bullish or bearish imbalances.
An optional Z-Score filter ensures the heatmap only forms when volume is relatively elevated compared to recent history.
4. Heatmap Projection
When a qualifying imbalance occurs:
• The FVG bar’s volume distribution is normalized
• Only areas with relatively elevated volume are displayed
• Colored heatmap boxes are created and extend forward
• These boxes remain until price trades into or through them
This allows traders to observe how price interacts with past zones of concentrated directional effort.
What Makes It Different
Most volume tools focus on fixed session profiles, market-wide volume-at-price calculations, or bar-level volume totals.
The Effort Heatmap instead reconstructs a per-bar vertical volume distribution using lower-timeframe price action and displays it only when displacement occurs.
Rather than treating the candle as a single block of volume, the indicator highlights where inside the candle body volume was delivered while moving in the displacement direction.
This creates a unique visualization of directional effort that conventional profiles, OB/FVG indicators, and classic oscillators do not show.
How to Use It
1. Apply to any timeframe: The indicator works on all chart timeframes, but gains more detail when higher timeframes are used in combination with lower-timeframe volume data.
2. Identify displacement moments: When a bullish or bearish FVG forms with a high volume Z-Score, the heatmap will appear.
3. Observe the heatmap structure:
Each horizontal band represents the relative concentration of same-direction volume inside the previous candle.
4. Watch how price interacts with these zones:
Heatmap areas extend until price touches or trades through them, at which point they stop extending and are finalized.
5. Combine with your own analysis:
These areas can be used to study...
...how past directional volume clusters influence current movement
...structural reactions to zones of prior effort
...which parts of a displacement candle were most active
The indicator is a visual study tool, not a signal generator.
Settings
• Volume Source Timeframe
Chooses the lower timeframe used to reconstruct internal volume. Smaller timeframes give more detail; larger timeframes give smoother profiles.
• Z-Score Lookback
Controls how many bars are used to measure relative volume. Larger values make the volume filter stricter.
• Z-Score Threshold
Minimum relative-volume strength required to draw a heatmap. Higher values show only high-effort moves.
• Volume Filter (%)
Removes weaker bins based on how much volume they contain compared to the strongest one. Higher percentages = fewer but more meaningful zones.
• Bullish / Bearish Colors
Sets the base color for heatmap boxes depending on direction.

Volume Peak Box📄 English Description
Overview
The Volume Peak Box indicator highlights periods of unusually high volume by identifying volume spikes using Bollinger Bands on volume and drawing a price-range box around each spike window. This provides traders with a clear visual representation of supply/demand imbalances, absorption zones, and breakout/false-break areas.
All calculations come from one unified concept: detecting statistically significant volume peaks on a locked timeframe and mapping them onto the chart.
Concept & Logic
1. Locked Timeframe Volume Analysis
Instead of using the current chart timeframe, this script allows users to lock volume analysis to any timeframe (e.g., 60m, 4H, 1D).
The script retrieves from the chosen timeframe:
Volume
High price
Low price
This allows volume structure from higher timeframes to be used while trading lower timeframes.
2. Bollinger Bands on Volume
Volume volatility is analyzed using a standard Bollinger Band model:
Basis = SMA(volume, BB length)
Upper Band = Basis + (mult × standard deviation)
When:
Volume > Upper Band
→ This bar is classified as a Volume Peak.
This approach makes the peak detection statistically meaningful, instead of simply comparing raw volume to previous bars.
3. Peak Session Detection (Continuous Peaks Form One Box)
The script tracks continuous volume peaks:
When a peak starts → begin a session
While peaks continue → extend the session
When peaks end → session closes and a box is created
For each peak session, the script records:
Start bar index
End bar index
Highest high within the session
Lowest low within the session
These values determine the box boundaries.
This allows the indicator to group related peaks into a single price zone, instead of drawing a box for every bar.
4. Drawing the Volume Peak Box
When a session ends, the script draws:
A filled box covering the full price range
From startBar → endBar
Using user-defined:
Box fill color
Border color
Each box visually marks a region where strong participation entered the market, often signaling:
Breakout validation
Absorption zones
Supply/demand imbalance
High-activity trading decisions
How to Use
Use the boxes to identify high-volume reaction zones.
When price revisits a box:
Expect strong reactions (bounce, rejection, or absorption).
When price breaks out from a box:
Can signal continuation with momentum.
Lower-timeframe entry signals become more reliable when aligned with high-timeframe volume boxes.
Recommended to lock the TF to:
60m for intraday
4H or 1D for swing trading
Why This Script Is Original
It uses Bollinger Bands on volume, not price — a less common volatility-based method for detecting volume anomalies.
It groups continuous peaks into unified zones instead of treating each spike separately.
The ability to lock the volume analysis to a higher timeframe allows multi-timeframe volume interpretation without cluttering the chart.
Boxes give traders a clean and intuitive view of volume-based “decision zones”.
🇹🇭 Thai Description — คำอธิบายภาษาไทย
ภาพรวม
อินดิเคเตอร์ Volume Peak Box ใช้การตรวจจับ “Volume Peak” โดยใช้ Bollinger Band บน Volume แล้วสร้าง “กล่องช่วงราคา” ครอบช่วงที่มี Volume สูงผิดปกติ ทำให้เห็นบริเวณที่มีแรงซื้อขายเข้ามาอย่างชัดเจน เช่น จุด Breakout, จุด Absorption, หรือเขต Supply/Demand
แนวคิดและหลักการทำงาน
1. วิเคราะห์ Volume จาก Timeframe ที่ล็อกไว้
คุณสามารถเลือก TF ที่ต้องการให้ Volume ถูกนำมาคำนวณ เช่น 60 นาที, 4 ชั่วโมง, 1 วัน
แม้คุณจะเปิดกราฟ TF เล็ก เช่น 5m แต่กล่องยังอิง volume จาก TF ที่เลือกไว้ ทำให้ได้ “โซน Volume ใหญ่” ที่แม่นยำขึ้น
2. Bollinger Band บน Volume
ใช้ SMA + ส่วนเบี่ยงเบนมาตรฐานของ Volume เพื่อหา “จุดที่ Volume สูงกว่าปกติอย่างมีนัยสำคัญ”
เงื่อนไข Peak:
Volume > Upper Bollinger Band
นี่เป็นวิธีที่ดีกว่า “เทียบกับแท่งก่อนหน้า” เพราะคิดจากสถิติของทั้งช่วง
3. รวม Peak ต่อเนื่องเป็นกล่องเดียว
ถ้า Volume Peak เกิดต่อเนื่องหลายแท่ง:
จะถูกจับรวมเป็น Peak session เดียว
ใช้ High สูงสุด และ Low ต่ำสุดของทั้ง session
เมื่อ Peak จบ → วาดกล่องช่วงราคา
เหมาะกับการหาจุดที่ตลาดมีแรงเข้าซื้อ/ขายหนักในช่วงเวลาเดียวกัน
4. วาดกล่อง Volume Peak
กล่องจะครอบ:
ช่วงแท่งเริ่มต้น → แท่งสุดท้ายของ Peak
ความสูงของกล่อง = ช่วงราคาที่มี Volume สูงผิดปกติ
กล่องสามารถใช้เป็น:
โซน Breakout/Breakdown
โซน Supply/Demand
เขตที่ราคามักมี reaction
วิธีใช้งาน
ใช้กล่องเป็น “เขตการตัดสินใจ” (Decision Zone)
ราคาแตะซ้ำมักเกิดการกลับตัวหรือความผันผวนสูง
การทะลุกล่องบ่อยครั้งนำไปสู่ขาเทรนด์ใหญ่
เหมาะกับการใช้ร่วมกับ Price Action และโครงสร้างราคา
จุดเด่น / ความเป็น Original
ใช้ Bollinger Band บน Volume (น้อยอินดี้ทำ)
รวม Peak ต่อเนื่องเป็น session เดียว
วิเคราะห์ Volume ข้าม TF ได้ โดยไม่ต้องเปลี่ยน TF บนกราฟ
ได้ “โซน Volume สำคัญ” แบบชัดเจน อ่านง่าย ไม่รกจอ

Adaptive Window Volume ProfileThe indicator builds a rolling volume profile over a chosen time window (1, 3, 12 months or lower), finds POC, VAH/VAL, RH/RL, HVN/LVN, and then overlays volume-driven bar colors (climax, initiative, absorption) filtered by a 30-day RVWAP trend, so you can see where big volume traded and who is winning there right now.
Example Use Case:
How to use it on 4H with 3-month and 12-month rolling profiles:
On a 4H chart, you run two copies of the indicator, both in Rolling Lookback mode, both using the Full (Overlap) engine:
Instance A – 12-month rolling profile (macro map):
-Rolling Unit: Months
-Rolling Length: 12
This gives you the 1-year composite:
-12M RH / RL → outer range of where almost all yearly volume traded (macro high/low “rails”).
-12M VAH / VAL → yearly value area: where the market has been comfortable doing business over the last year.
-12M POC → the single most traded price of the last 12 months (macro gravity).
-12M HVNs/LVNs → long-term shelves (acceptance) and gaps (knife-edges).
Use this instance to answer:
Where are we in the last year’s distribution, and are we approaching macro extremes or living in fair value?
-Combine it with the 30-day RVWAP regime the script computes:
-Above RVWAP and RVWAP rising → macro bull tilt.
-Below RVWAP and RVWAP falling → macro bear tilt.
For example:
-Price near 12M RL with RVWAP bull → potential deep-discount accumulation zone.
-Price near 12M RH with RVWAP bear → potential exhaustion / distribution zone.
Instance B – 3-month rolling profile (tactical map)
-Rolling Unit: Months
-Rolling Length: 3
This builds a 3-month composite on top of your 4H chart:
-3M RH / RL → extremes of the current quarter’s trading.
-3M VAH / VAL → current “fair value box” for the last 90-ish days.
-3M POC → where recent volume concentrates most heavily.
-3M HVNs/LVNs → fresh shelves and gaps inside the bigger yearly structure.
You use this instance for actual trade locations and management:
-Pullbacks into 3M VAL / RL that still sit inside the 12M value and in a bull RVWAP regime → high-probability dip-buy zones; you then look for bull initiative/absorption bar colors to confirm entry.
-Rallies into 3M VAH / RH that line up near 12M VAH / RH in a bear RVWAP regime → good areas to look for shorts, especially when you see bear climax/initiative bars there.
-3M LVNs that coincide with 12M LVNs or VA edges act as sharp decision points: acceptance through often means expansion; rejection often means reversal.
How it all fits together
On your 4H chart, with both instances active:
-12M profile = macro context and big terrain (where the yearly battlefield is).
-3M profile = tactical zones (where to actually trade inside that terrain).
-Bar colors (climax / initiative / absorption) filtered by 30-day RVWAP = timing + confirmation at those levels, favoring the side that has trend and effort behind it.
So the indicator, used this way, becomes:
-one instance to tell you where the big war is being fought (12M)
-one instance to tell you where the current campaign inside that war is concentrated (3M)
-bar colors to tell you whether the team you want to back is actually showing up with size when price hits those levels.

Cumulative Delta Difference HistogramINTRODUCTION:
This "Cumulative Delta Difference Histogram" is a volume-based indicator that calculates the difference (delta) between aggressive buying volume and selling volume for each candle and then builds a cumulative momentum histogram with the following behavior:
Momentum Tracking: The indicator accumulates the delta values when the delta is positive and increasing, producing green bars whose height visually represents growing buying pressure momentum.
Negative Momentum Detection: When the delta becomes negative or starts to decline, the histogram bars turn red and the accumulation decreases, effectively showing increasing selling pressure momentum.
Directional Reset: On each change from positive to negative delta momentum or vice versa, the accumulator resets to zero, providing a clear and sharp visualization of shifts without persistence from previous trends.
Zero Reference Line: A horizontal zero line serves as a visual baseline to distinguish positive from negative momentum easily.
HOW TO USE:
To trade effectively using the "Cumulative Delta Difference Histogram," you compare the price action chart with the indicator to confirm momentum and detect potential reversals or continuations. Here's how to do it in practice:
Confirming Trends:
When the price is rising, look for the histogram bars to be green and increasing, indicating strong and growing buying pressure supporting the uptrend. If price rises but the histogram shows diminishing green bars or shifts to red, it could signal weakening momentum and a potential reversal.
Identifying Divergences:
Compare price highs/lows with histogram peaks. If price makes a new high but the histogram fails to make a corresponding new high (bearish divergence), it warns of a possible trend reversal. Conversely, if price makes a new low but histogram shows higher lows (bullish divergence), it signals potential bullish reversal.
Volume Confirmation:
The histogram reflects real-time volume aggression behind price moves. Confirmation of price breakouts or breakdowns by corresponding strong histogram colors and bar height increases adds reliability to signals.
By aligning price patterns and levels with the cumulative delta histogram's signals, traders gain a deeper understanding of market strength and better timing for trades.
This combined approach improves the accuracy of entries and exits beyond relying on price alone, especially in markets sensitive to order flow and volume dynamics.
Use this indicator with a default volume or with my other indicator "Agression Histogram" for a better reading.

Volume Pressure and PercentVPP Volume Pressure and Percentage Indicator with a Volume Trendline that indicates which side is driving the flow.
Features:
1. Buy/Sell Pressure Bars (Core Volume Split)
The indicator separates each candle’s volume into buy volume (green) above the zero line and sell volume (red) below it. This gives you a real-time visualization of which side is more aggressive within the current bar. Instead of waiting for prices to move or candles to close, you can instantly see whether buyers or sellers are stepping in.
2. Dynamic Total Volume (Invisible Histogram + Status Line Color)
The total volume of each bar is tracked behind the scenes and displayed in the pinned status line using a dynamic color—green when buyers dominate, red when sellers dominate. The histogram for total volume is invisible to keep the chart clean, but the total volume figure stays visible and changes color based on who is in control. This gives you instant confirmation of whether institutional-sized volume supports the direction shown by the buy/sell pressure, which is especially valuable when evaluating the risk or conviction behind a potential entry.
3. Percentage Mode (% of Bar Volume)
When toggled on, the indicator converts each bar into percent buy vs percent sell, normalizing all flow to a 0–100% scale. This mode is incredibly useful when comparing pressure across different times of day, gaps, or varying volume conditions—such as early morning spikes versus lunchtime chop. By removing absolute volume from the equation, you gain a clean look at the actual imbalance between buyers and sellers.
4. 70% Pressure Band (Imbalance Threshold Zone)
In percentage mode, the indicator displays a subtle 70% band (a light gray zone) above and below the zero line, showing where buy or sell pressure reaches extreme dominance (≥70%). When a bar’s buy or sell percentage enters this zone, it highlights moments of exhaustion, acceleration, or potential reversal. The band acts like a real-time overbought/oversold gauge specifically for volume imbalance, not price.
5. Trend Line (Net Pressure Trend / Reversal Detector)
The trend line smooths out the net volume pressure (buy volume minus sell volume or its percentage equivalent) and shows the overall direction of order flow. When the line slopes upward, buyers are gaining control; when it slopes downward, sellers are taking over. This trend line acts as a real-time momentum indicator based directly on flow rather than price. Because it reacts quickly to intrabar shifts in buy/sell pressure, it often turns before price does—giving you a measurable timing edge.
6. Auto-Selecting Trend Source (Volume Net, Percent Net, or CVD)
The indicator lets you choose how the trend line is calculated: Volume Net (buy minus sell volume), Percent Net (normalized imbalance), or CVD (Cumulative Volume Delta) for long-term flow bias. The default “Auto” mode automatically switches between Volume Net and Percent Net depending on which view you’re using. This flexibility allows the trend line to remain meaningful whether you’re analyzing raw volume or normalized percentage data.
7. Pinned (Status Line) Totals in K/M/B Format
Regardless of whether you’re in volume or percentage mode, the indicator always displays Total Volume, Buy Volume, and Sell Volume in the status line using abbreviated K, M, B formatting. These values update in real time and are color-coded: green for bullish dominance, red for bearish. This gives you a concise snapshot of order flow strength on every bar.
---------------------
How To Use:
Support Level Zones
• Watch for Buy bars increasing + Trend line flipping up right at or slightly below support.
• This often signals absorption — market makers filling large buy orders before reversal.
• Confirmation: Price reclaims VWAP ... enter calls / longs.
Resistance Level Zones
• Watch for Sell bars increasing + Trend line flattening/turning down near resistance.
• This signals distribution or stop runs.
• Confirmation: Price rejects VWAP ... enter puts / shorts.
Breakout Traps
• Sometimes you’ll see price break a level, but the flow doesn’t confirm (buy volume doesn’t expand).
• That’s a false breakout — fade it with options opposite the move.

POC Lines (Daily / Weekly / Monthly)This indicator plots the Point of Control (POC) on your chart for three key timeframes — daily, weekly, and monthly. The POC is the price level at which the highest trading volume occurred during a given period, highlighting where market participants were most active.
How to Trade Using the Daily / Weekly / Monthly POC Indicator
Identify Market Bias
Use the monthly POC as a major structural reference. If price is above the monthly POC, bias may be bullish; below it may signal caution or potential bearish bias.
Use the weekly POC for intermediate trend context. Price respecting the weekly POC can enhance confidence in direction.
Use the daily POC for fine-tuning entries, exits or intraday structure.
Use POC as Support/Resistance Zones
When price approaches a POC from above, the level can act as support — look for bullish reversal signals.
When price approaches a POC from below, it can act as resistance — look for bearish rejection setups.
If price breaks through a POC convincingly (with strong volume or momentum), then the level may flip: the broken POC becomes a new reference zone for opposite side trades.
Timeframe Confluence = Higher Probability
A trade setup is stronger when the daily, weekly, and monthly POCs align or cluster near the same price zone. This confluence raises the chance that price will react.
Conversely, avoid setups where the POCs are widely scattered across timeframes — these have less structural weight.
Entry, Stop & Target Strategy
Entry: Enter once price touches a significant POC level and shows confirmation (e.g., candlestick reversal, volume spike, or confluence with other level).
Stop-Loss: Place stop just beyond the POC level (for support trades, slightly below; for resistance trades, slightly above).
Target: Use the next major POC or price structure level (previous high/low, value area edges) as your initial target. If price moves through the POC, target a breakout to the next structural zone.
Be patient — price may test a POC level multiple times or ignore it entirely before reacting.
Use the POC indicator as a guiding framework, not a guarantee. Combine with other tools (trend direction, price action, volume, market context) to refine your execution.

Trading Range Aggression Histogram
This indicator is a histogram that accumulates the net volume of aggressive buying and selling per candle, representing the dominant market pressure within defined time-frame.
The indicator works by continuously summing volumes as long as the aggression remains in the same direction, resetting and reversing the accumulation when the pressure changes sides.
This creates visual waves that facilitate the perception of phases dominated by buyers and sellers over time. The tool is useful to identify moments of strength, weakness, and potential reversals in a dynamic market, especially in short-term trading.

Price-Volume Correlation Strength (PVC)Overview
The Price-Volume Correlation Strength (PVC) indicator is a behavioral-analysis tool that quantifies the relationship between price movement and volume participation to distinguish t rue directional moves from false momentum or exhaustion traps .
It combines dynamic price–volume correlation logic, signal clustering, liquidity-sweep detection, and multi-day reference levels into a single, data-driven framework that adapts across all markets and timeframes.
⸻
1️⃣ Core Logic — Price vs Volume Correlation
At the heart of PVC is the belief that price without volume confirmation is deception .
The script evaluates whether volume supports or contradicts price direction using a rolling volume average and short-term price delta:
Price Direction Volume Behavior
↑ Price + ↑ Volume True Bull Move ✅ — Healthy rally with strong participation
↑ Price + ↓ Volume False Bull Move ⚠️ — Buyer exhaustion or fake breakout
↓ Price + ↑ Volume True Bear Move ✅ — Active selling pressure
↓ Price + ↓ Volume False Bear Move ⚠️ — Short covering / weak decline
Candles are automatically color-coded so that traders can instantly identify whether the current move is being supported (lime/red) or rejected (gray) by the underlying volume dynamics.
2️⃣ Signal Module — Trend Confirmation & Reversal
PVC tracks sequences of consecutive “true” bars to generate BUY or SELL signals once momentum aligns with sustained volume confirmation.
A built-in signal-strength filter (user-adjustable) ensures that only moves with multi-bar confirmation are considered.
Signals are non-repainting: once triggered, they persist until an opposite direction is confirmed.
3️⃣ Liquidity Sweep Engine
Markets often manipulate recent highs/lows to trigger stops before true reversals begin.
The Liquidity Sweep Engine detects these events by comparing current highs/lows to prior extremes and validating them with above-average volume bursts .
• Bullish Sweep (Blue dot below bar): liquidity taken below prior lows, buyers absorb volume → potential reversal up.
• Bearish Sweep (Blue dot above bar): liquidity taken above prior highs, sellers absorb volume → potential reversal down.
This module helps traders recognize Smart Money traps and stop-hunt zones that precede major turning points.
4️⃣ Adaptive Dashboard
A compact, on-chart dashboard summarizes the market state in real time:
• Price Direction — UP / DOWN / FLAT
• Volume Trend — RISING / FALLING
• Move Validity — True / False Move
• Signal Status — Active Buy / Sell / Mixed
• Recent Sweeps — Bull / Bear / Both / None
Border and grid colors are user-configurable for visual clarity.
⸻
5️⃣ Multi-Day OHLC & VWAP Suite
To complement the intraday correlation engine, PVC integrates a Multi-Day OHLC module that automatically projects up to 10 previous-day levels (High, Low, Close, and VWAP).
These act as natural liquidity magnets and reaction zones where price often pauses or reverses.
Users can customize:
• Line colors for each level type
• Universal or per-type line thickness
• Number of days to display (1–10)
This turns the indicator into a complete context map—linking current price–volume behavior with historical reference levels.
⸻
6️⃣ Alerts & Practical Use
Built-in alerts trigger on:
• True Bull Move / True Bear Move (momentum confirmation)
• Buy / Sell Signals (multi-bar strength filter)
• Bullish / Bearish Liquidity Sweep (stop-hunt detection)
Best use cases
• Identify whether a breakout is real or fading before entering.
• Confirm reversals with simultaneous volume confirmation + liquidity flush.
• Combine with VWAP or structure tools to align with institutional footprints.
⸻
7️⃣ Why PVC is Original
While most volume indicators only show totals or ratios, PVC focuses on behavioral correlation—the timing and agreement between price change and participation.
By merging price–volume validation, trap detection, and multi-day liquidity mapping inside one unified system, PVC provides a contextual narrative of market strength that no single classic indicator offers.
⸻
How to Use
1. Apply on any timeframe or instrument.
2. Observe candle colors for confirmation or divergence.
3. Watch the dashboard: when both Price UP + Volume Rising + True Move + Buy Active, the move has strong backing.
4. If “False Move” or “Liquidity Sweep” appears, expect a possible reversal.
5. Align entries with daily VWAP/High/Low zones for confluence.
⸻
⚠️ Disclaimer
This script is for educational and analytical purposes.
It does not constitute financial advice or a guaranteed signal system.
Always confirm with your broader trading strategy and risk management.
⸻

Volume HeatMap Divergence [BigBeluga]🔵 OVERVIEW
The Volume HeatMap Divergence is a smart volume visualization tool that overlays normalized volume data directly on the chart. Using a color heatmap from aqua to red, it transforms raw volume into an intuitive scale — highlighting areas of weak to intense market participation. Additionally, it detects volume-based divergences from price to signal potential reversals or exhaustion zones. Combined with clear visual labeling, this tool empowers traders with actionable volume insights.
🔵 CONCEPTS
Normalized Volume Heatmap : Volume is normalized to a 0–100% scale and visually represented as candles below the chart.
float vol = volume / ta.percentile_nearest_rank(volume, 1000, 100) * 100
Bar Coloring : Price candles are dynamically colored based on volume intensity.
Volume Divergence Logic :
Bullish Divergence : Price forms a lower low, but volume forms a higher low.
Bearish Divergence : Price forms a higher high, but volume forms a lower high.
Dynamic Detection Range : Customizable range ensures divergence signals are meaningful and not random.
Volume Labels : Additional info on divergence bars shows both the actual volume and its normalized % score.
🔵 FEATURES
Volume Heatmap Plot : Normalized volume values colored using a smooth gradient from aqua (low) to red (high).
Price Bar Coloring : Candlesticks on the main chart adopt the same heatmap color based on volume.
Divergence Detection :
Bullish divergence with label and low marker
Bearish divergence with label and high marker
Dual Divergence Labels :
On the volume plot : Direction (Bull/Bear), raw volume, and normalized %
On the price chart : Shape labels showing "Bull" or "Bear" at local highs/lows
Custom Inputs :
Divergence range (min & max), pivot detection distance (left/right)
Toggle to show/hide divergence labels, volume, and % text
Clear Bull/Bear Coloring : Fully customizable label and line colors for both bullish and bearish signals.
🔵 HOW TO USE
Use the indicator as an overlay to monitor real-time volume strength using the heatmap color.
Watch for divergence markers:
Bullish divergence: Candle shows higher volume while price makes a new low
Bearish divergence: Candle shows lower volume while price makes a new high
Use the volume info labels to verify the context of divergence:
Actual volume at divergence candle
Normalized % of that volume compared to past 1000 bars
Adjust pivot sensitivity using "Pivot Left" and "Pivot Right" to tune signal frequency and lag with a right pivot length.
Use divergence zones as early warnings for potential reversals or trend shifts.
Disable or customize labels in settings depending on your charting preferences.
🔵 CONCLUSION
Volume HeatMap Divergence merges heatmap-style volume visualization with intelligent divergence detection — giving traders a clean yet powerful edge. By revealing hidden disconnections between price and participation, it helps users spot exhaustion moves or hidden accumulation zones before the market reacts. Whether you’re a scalper, swing trader, or intraday strategist, this tool offers real-time clarity on who’s in control behind the candles.

Force DashboardScalping Dashboard - Complete User Guide
Overview
This scalping system consists of two complementary TradingView indicators designed for intraday trading with no overnight holds:
Force Dashboard - Single-row table showing real-time market bias and entry signals
Large Order Detection - Visual diamonds showing institutional order flow
Together, they provide a complete at-a-glance view of market conditions optimized for quick entries and exits.
Recommended Timeframes
Primary Scalping Timeframes
1-minute chart: Ultra-fast scalps (30 seconds - 3 minutes hold time)
2-minute chart: Quick scalps (2-5 minutes hold time)
5-minute chart: Standard scalps (5-15 minutes hold time)
Best Practices
Use 1-2 minute for highly liquid instruments (ES, NQ, major forex pairs)
Use 5-minute for less liquid markets or if you prefer fewer signals
Never hold past the last hour of trading to avoid overnight risk
Set hard stop times (e.g., exit all positions by 3:45 PM EST)
Dashboard Components Explained
Core Indicators (Circles ●)
MACD (5/13/5)
Green ● = Bullish momentum (MACD histogram positive)
Red ● = Bearish momentum (MACD histogram negative)
Gray ● = No clear momentum
Use: Confirms trend direction and momentum shifts
EMA (9/20/50)
Green ● = Price > EMA9 > EMA20 (uptrend)
Red ● = Price < EMA9 < EMA20 (downtrend)
Gray ● = Choppy/sideways
Use: Identifies the immediate micro-trend
Stoch (5-period Stochastic)
Green ● = Oversold (<20) - potential reversal up
Red ● = Overbought (>80) - potential reversal down
Gray ● = Neutral zone (20-80)
Use: Spots reversal opportunities at extremes
RSI (7-period)
Green ● = Oversold (<30)
Red ● = Overbought (>70)
Gray ● = Neutral
Use: Confirms overbought/oversold conditions
CVD (Cumulative Volume Delta)
Green ● = CVD above its moving average (buying pressure)
Red ● = CVD below its moving average (selling pressure)
Gray ● = Neutral
Use: Shows overall buying vs selling pressure
ΔCVD (Delta CVD - Rate of Change)
Green ● = CVD accelerating upward (buying acceleration)
Red ● = CVD accelerating downward (selling acceleration)
Gray ● = No acceleration
Use: Detects momentum shifts in order flow
Imbal (Order Flow Imbalance)
Green ● = Buy pressure >2x sell pressure
Red ● = Sell pressure >2x buy pressure
Gray ● = Balanced
Use: Identifies extreme one-sided order flow
Vol (Volume Strength)
Green ● = Volume >1.5x average (strong interest)
Red ● = Volume <0.7x average (low interest)
Gray ● = Normal volume
Yellow background = Volume surge (>2x average) - BIG MOVE ALERT
Use: Confirms conviction behind price moves
Tape (Tape Speed)
Green ● = Fast order flow (>1.3x normal)
Red ● = Slow order flow (<0.7x normal)
Gray ● = Normal speed
Yellow background = Very fast tape (>1.5x) - RAPID EXECUTION ALERT
Use: Measures urgency and speed of orders
Key Levels
Support (Supp)
Shows the nearest high-volume support level below current price
Bright Green background = Price is AT support (within 0.3%) - BOUNCE ZONE
Green background = Price above support (healthy)
Red background = Price below support (broken support, now resistance)
Resistance (Res)
Shows the nearest high-volume resistance level above current price
Bright Orange background = Price is AT resistance (within 0.3%) - REJECTION ZONE
Red background = Price below resistance (facing overhead supply)
Green background = Price above resistance (breakout)
These levels update automatically every 3 bars based on volume profile
Entry Signal Components
Score
Displays format: "6L" (6 long indicators) or "4S" (4 short indicators)
Bright Green = 6-7 indicators aligned for long
Light Green = 5 indicators aligned for long
Yellow = 4 indicators aligned (weaker setup)
Gray = No alignment
Red/Orange colors = Same scale for short setups
Score of 5+ indicates high-probability setup
SCALP (Main Entry Signal)
BRIGHT GREEN "LONG" = High-quality long scalp (Score 5+)
Green "LONG" = Decent long scalp (Score 4)
BRIGHT ORANGE "SHORT" = High-quality short scalp (Score 5+)
Red "SHORT" = Decent short scalp (Score 4)
Gray "WAIT" = No clear setup - STAY OUT
Entry Strategies
Strategy 1: High-Probability Scalps (Conservative)
When to Enter:
SCALP column shows BRIGHT GREEN "LONG" or BRIGHT ORANGE "SHORT"
Score is 5 or higher
Vol or Tape has yellow background (volume surge)
Example Long Setup:
SCALP = BRIGHT GREEN "LONG"
Score = 6L
Vol = Yellow background
Price AT Support (bright green Supp cell)
EMA, MACD, CVD, ΔCVD, Imbal all green
Entry: Enter immediately on next candle
Target: 0.5-1% move or resistance level
Stop: Below support or -0.3%
Hold Time: 2-10 minutes
Strategy 2: Momentum Scalps (Aggressive)
When to Enter:
Tape has yellow background (fast tape)
Vol has yellow background (volume surge)
ΔCVD is green (for longs) or red (for shorts)
Imbal shows strong imbalance in your direction
Score is 4+
Example Short Setup:
Tape & Vol = Yellow backgrounds
ΔCVD = Red, Imbal = Red
Price AT Resistance (bright orange)
Score = 5S
Entry: Enter immediately
Target: Quick 0.3-0.7% move
Stop: Tight -0.2%
Hold Time: 1-5 minutes
Strategy 3: Reversal Scalps (Mean Reversion)
When to Enter:
Stoch shows oversold (green) or overbought (red)
RSI confirms the extreme
Price is AT Support (for longs) or AT Resistance (for shorts)
ΔCVD and Imbal start reversing direction
Score is 4+
Example Long Setup:
Stoch = Green (oversold)
RSI = Green (oversold)
Supp = Bright green (at support)
ΔCVD turns green
Imbal turns green
Score = 4L or 5L
Entry: Wait for confirmation candle
Target: Move back to EMA9 or mid-range
Stop: Below the low
Hold Time: 3-8 minutes
Large Order Detection Usage
Diamond Signals
Green diamonds below bar = Large buy orders (institutional buying)
Red diamonds above bar = Large sell orders (institutional selling)
Size matters: Larger diamonds = larger order flow
How to Use with Dashboard
Confirmation Entries
Dashboard shows "LONG" signal
Green diamond appears
Enter immediately - institutions are buying
Divergence Alerts (CAUTION)
Dashboard shows "LONG" signal
RED diamond appears (institutions selling)
DO NOT ENTER - conflicting order flow
Cluster Patterns
Multiple green diamonds in row = Strong accumulation, stay long
Multiple red diamonds in row = Strong distribution, stay short
Alternating colors = Chop, avoid trading
Risk Management Rules
Position Sizing
Risk 0.5-1% of account per scalp
Maximum 3 concurrent positions
Reduce size after 2 consecutive losses
Stop Loss Guidelines
Tight stops: 0.2-0.3% for 1-2 min charts
Standard stops: 0.3-0.5% for 5 min charts
Always use stop loss - no exceptions
Place stops below support (longs) or above resistance (shorts)
Take Profit Targets
Target 1: 0.3-0.5% (take 50% off)
Target 2: 0.7-1% (take remaining 50%)
Move stop to breakeven after Target 1 hit
Trail stop if Score remains high
Time-Based Exits
Exit immediately if:
SCALP changes from LONG/SHORT to WAIT
Score drops below 3
Large diamond appears in opposite direction
Maximum hold time: 15 minutes (even if profitable)
Hard exit time: 30 minutes before market close
Trading Sessions
Best Times to Scalp
High-Liquidity Sessions
9:30-11:00 AM EST (Market open, highest volume)
2:00-3:30 PM EST (Afternoon session, good moves)
Avoid
11:30 AM-1:30 PM EST (Lunch, low volume)
Last 30 minutes (unpredictable, don't initiate new trades)
News releases (wait 5 minutes for volatility to settle)
Common Patterns & Setups
The Perfect Storm (Highest Probability)
Score = 6L or 7L
SCALP = BRIGHT GREEN
Vol + Tape = Yellow backgrounds
Green diamond appears
Price AT Support
Win rate: ~70-80%
The Fade Setup (Counter-Trend)
Price hits resistance (bright orange)
Stoch + RSI overbought (red)
Red diamond appears
CVD starts turning red
SCALP shows "SHORT"
Win rate: ~60-70%
The Breakout Continuation
Price breaks resistance (Res turns green)
EMA, MACD green
Vol surge (yellow)
Multiple green diamonds
SCALP = "LONG"
Win rate: ~65-75%
Warning Signs - DO NOT TRADE
Red Flags
❌ SCALP shows "WAIT"
❌ Score below 3
❌ Vol and Tape both gray (no volume)
❌ Conflicting signals (dashboard says LONG but red diamonds appearing)
❌ Alternating green/red circles (choppy market)
❌ Support and Resistance very close together (tight range)
Market Conditions to Avoid
Low volume periods
Major news releases (first 5 minutes after)
First 2 minutes after market open
Wide spreads
Consecutive losing trades (take a break after 2 losses)
Quick Reference Checklist
Before Taking ANY Trade:
☑ SCALP shows LONG or SHORT (not WAIT)
☑ Score is 4 or higher
☑ Vol or Tape shows activity
☑ No conflicting diamond signals
☑ Stop loss level identified
☑ Target profit level identified
☑ Not in restricted time periods
After Entering:
☑ Set stop loss immediately
☑ Set profit targets
☑ Watch SCALP column - exit if changes to WAIT
☑ Watch for opposite-colored diamonds
☑ Move stop to breakeven after first target
☑ Exit all by market close
Advanced Tips
Scalping Psychology
Be patient: Wait for Score 5+ setups
Be decisive: When signal appears, act immediately
Be disciplined: Follow your stop loss always
Be flexible: Exit quickly if dashboard reverses
Optimization
Backtest on your specific instrument
Adjust RSI/Stoch levels for your market
Fine-tune volume thresholds
Keep a trade journal to track which setups work best
Multi-Timeframe Confirmation
Use 5-min dashboard as "trend filter"
Take 1-min trades only in direction of 5-min SCALP signal
Increases win rate by ~10-15%
Troubleshooting
Q: Dashboard shows WAIT most of the time
Normal - scalping is about patience. Quality > Quantity
3-8 good setups per day is excellent
Q: Too many false signals
Increase minimum Score requirement to 5 or 6
Only trade with volume surge (yellow backgrounds)
Add large order detection confirmation
Q: Signals too slow
You may be on too high a timeframe
Try 1-minute chart for faster signals
Ensure real-time data feed is active
Q: Support/Resistance not updating
Normal - updates every 3 bars
If completely stuck, remove and re-add indicator
Summary
This scalping system works best when:
✅ Multiple indicators align (Score 5+)
✅ Volume and tape speed confirm the move
✅ Order flow (diamonds) confirms direction
✅ Price is at key levels (support/resistance)
✅ You manage risk strictly
✅ You exit before market close
The golden rule: When SCALP says WAIT, you WAIT. Discipline beats frequency.

BVC - Optimized Trend StrengthOverview
BVC-Optimized Trend Strength is a next-generation trend evaluation system designed specifically for the Casablanca Stock Exchange (BVC).
It measures the true strength of bullish and bearish pressure using a combination of advanced technical filters:
• Trend structure via MM20 & MM50
• Market momentum via RSI
• Breakout confirmation using Donchian levels
• Volume validation based on BVC liquidity characteristics
• Slope strength of the fast moving average
• Weighted scoring engine (0 → 100)
• Non-repainting BUY/SELL signals
• Background regime detection (Bull / Bear / Neutral)
It is engineered to be highly configurable, lightweight, and fully adapted to BVC market behavior, where liquidity, breakout reliability, and trend confirmation behave differently from US or European markets.
⸻
How It Works
At every bar, the script evaluates 6 categories of trend evidence.
Each category contributes a configurable weight to a final Bull Score and Bear Score, each ranging from 0 to 100.
Bull Score Components
• Price above MM20
• MM20 above MM50
• Positive MA slope
• RSI above bullish threshold
• Donchian bullish breakout (non-repainting)
• Volume confirmation
Bear Score Components
Exact mirror of the bullish setup.
The result is a quantitative trend strength meter that reflects the true pressure behind the market.
⸻
Non-Repainting BUY & SELL Signals
Signals only trigger when the calculated score crosses your minimum threshold (default: 60).
Labels fire once, at the close of the candle, using:
MM crossovers
RSI regime shifts
Donchian breakouts
Trend structure & volume validation
All signals are non-repainting, meaning what you see historically is exactly what was printed live.
Labels include:
BUY • Very Strong (85/100)
SELL • Strong (65/100)
⸻
Background Regime Detection
The chart background automatically adapts to market conditions:
• Green → confirmed bullish regime
• Red → confirmed bearish regime
• Gray → mixed or transition phase
You may customize transparency and behavior.
⸻
Top-Right Dashboard
A clean summary panel displays:
• Price
• MM20
• MM50
• RSI
• Bull/Bear scores
• Recommended Action: BUY / HOLD, SELL / AVOID or WAIT
This gives traders an instant, objective view of market conditions.
⸻
Alerts
Built-in TradingView alerts:
• BUY Signal
• SELL Signal
Customize them directly through the TradingView alerts panel.
⸻
Ideal For
Swing traders
Position traders
Portfolio managers
Trend-followers
BVC investors wanting objective confirmation
Traders who hate repainting signals
⸻
Why It Works on the BVC
The BVC behaves differently from high-frequency markets.
Breakouts often require confirmation, low volume distorts momentum, and many assets move in structured waves.
This script integrates all these insights into a single, powerful and unified indicator—built for Morocco, by someone who trades Morocco.
⸻
Disclaimer
This indicator does not guarantee profits and should be combined with market structure, liquidity evaluation, and proper risk management. Past performance does not guarantee future results.

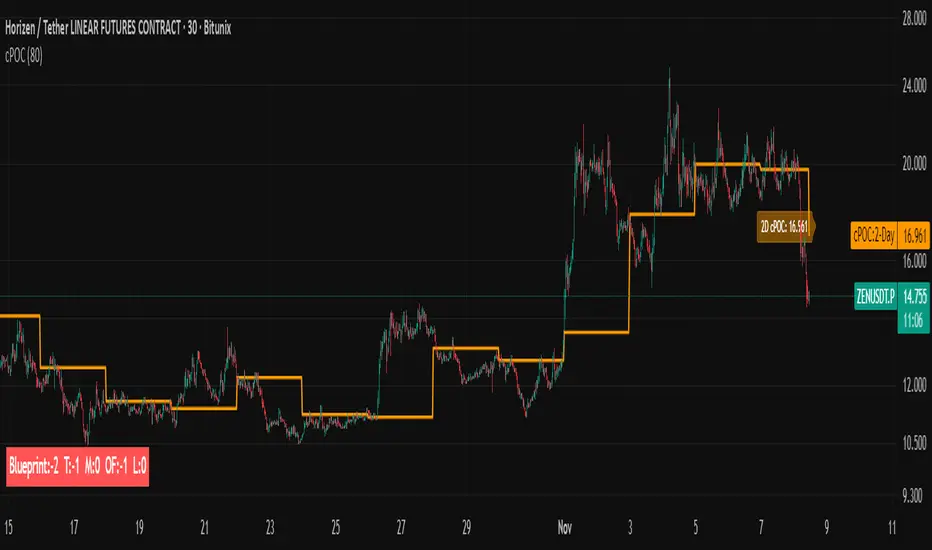
Trading Blueprint v7 Pro — VWAP-CVD, cPOC Trend MomentumTBv7 Pro is the advanced release of the Trading Blueprint framework — engineered for institutional-style intraday analysis that fuses VWAP location, CVD orderflow, composite profile bias, and momentum curvature into one cohesive system.
Core Framework
VWAP Structure → Adaptive mean anchored to session VWAP with ±1σ / ±2σ deviation envelopes for dynamic equilibrium detection.
vPOC per bar by ruckard ()
Anchored Volume Profile by DGT ()
CVD Orderflow Divergence → Smoothed delta histogram with fractal pivots identifying hidden absorption and exhaustion (patterns (Bull / Bear Div). Cumulative Volume Delta by AustrianTradingMachine )
cPOC Integration (2-Day Composite) by poopsnag (me :)→ Confirms true acceptance or rejection zones across sessions for precision bias alignment.
TMI (Trend Momentum Indicator by TradingRiot()) → Quantifies slope + mean crossover strength, providing actionable momentum confirmation (bullish / bearish support / divergence).
Bias Dashboard → Displays VWAP bias, numerical score, and dynamic color feedback for at-a-glance trade orientation.
Usage Context
Designed for professionals trading 15 m execution inside 1 h / 4 h context. Ideal for VWAP-cPOC location setups, reversion / continuation scalps, and orderflow confirmation using cumulative delta behavior.
🔧 Modules such as RSI / AO are pre-wired and easily activated for full Trading Blueprint confluence mapping.

cPOC 2 DayIt’s perfect for your 2-Day cPOC since:
It derives from volume distribution data.
It highlights market structure, value area, and composite volume behavior.
Traders searching for “cPOC,” “volume profile,” or “market profile” will find it here.
Use this if your indicator’s main function is showing POCs, VAH/VAL, or composite volume balance zones.
If your cPOC script is part of a broader system:
Trend Analysis — if it’s used for directional bias and context with VWAP/EMAs.
Support/Resistance — if the tool primarily highlights POC/VAH/VAL as static levels to trade from.
Other — only if your indicator mixes data from multiple frameworks (e.g., combines orderflow, delta, VWAP, and TPO).