What-if scenarios in trading options
Options trading is all about preparing for the unexpected. With Options Strategy Builder, you can model custom what-if scenarios to see how your strategy behaves under different market conditions before they actually happen. Create custom what-if scenarios, view multiple ones, adjust time and implied volatility, and see how your positions react — all directly on the options chart.
CONTENTS:
What is a "what-if scenario"
By default, on the strategy chart, you see the payoff line (green and red in the screenshot), the T+0 P&L line (blue) and a selected Greek line (orange). All these lines are calculated based on the current market conditions, including the current point in time and the current level of implied volatility.

With the what-if scenario feature, you can calculate charts under modified market conditions. Choose a different moment in time (for instance, tomorrow or a week later), change the implied volatility, or both.
The Strategy Builder allows you to create custom what-if scenarios and display them on the options chart in addition to the default lines.
Predefined scenarios
What-if scenario controls are located above the chart. By default, the dropdown menu contains three predefined what-if scenarios:
- Time +5 days
- IV +10%
- IV -10%
If you click the checkbox to the left of any of them, the corresponding line will be shown on the chart.

Custom scenarios
The purpose of predefined scenarios is mainly to highlight the feature to users. The real power of what-if scenarios lies in the ability to create your own custom scenarios, store them, and apply whenever needed.
To create a custom scenario, click the Add what-if… option in the dropdown list.
In the Add what-if dialog, you can set up the parameters of a custom scenario:
- Time shift: Measured in days. Can be positive (+1 is tomorrow, +2 is the day after tomorrow, etc.) or negative (-1 is yesterday, -2 is two days earlier, etc.)
- IV shift: Measures in percent. Can also be positive or negative
- Line style: Displayed as dots, dashes, or solid lines. It's colored automatically depending on how many scenarios you've selected
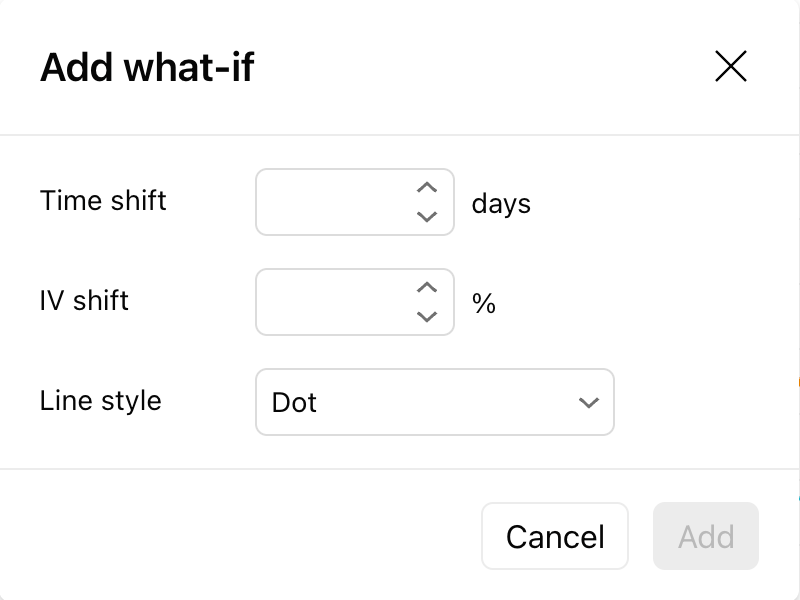
As soon as you click Add and close the dialog, a new scenario is created and added to the chart. Its display name will be generated automatically based on its parameters.

Viewing multiple scenarios
Suppose you hold a long OTM (nearly ATM) call position in AAPL with about three months untill expiration. A bad scenario for this position is when the price doesn’t go up and the call option expires out of the money.
But that’s not the only risk. Even if the stock trades sideways near the strike, the option may still lose value because of time decay (theta) or a drop in implied volatility (IV). Both effects eat away at the premium, leaving the trader with losses even if the price hasn’t moved against them.
This is where multiple what-if scenarios come into play. You can plot not only a "no price change" scenario, but also add lines for "time passes by one month" and "IV falls by 10%" to see how those factors interact. By layering several scenarios on the same chart, you get a much clearer picture of what really threatens your position and how resilient it is under different market conditions.
To display multiple scenarios on a chart, just select them in the dropdown list.

With custom what-if scenarios, you’re no longer trading blind — visualize how time and volatility shifts affect your strategy before they happen. This helps you identify hidden risks and opportunities in your options positions. Stay prepared, adjust smarter, and trade with greater confidence.
Also read: