ADIB Stock Analysis – Converging Triangle in Focus!Greetings Traders,
Today, we’re taking a closer look at ADIB (Abu Dhabi Islamic Bank) — an interesting setup forming on the chart!
Key Highlights:
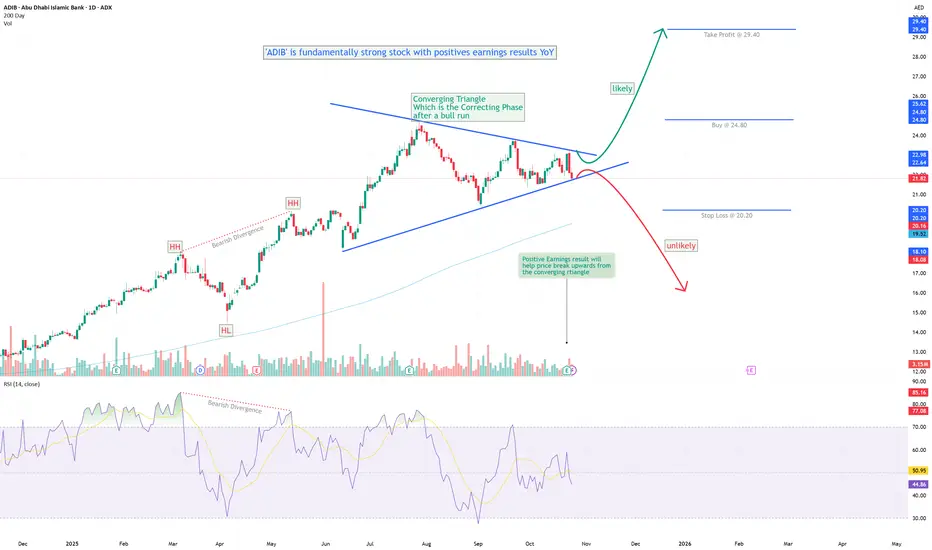
Fundamentally strong: ADIB continues to deliver solid YoY earnings growth.
Bearish divergence was observed earlier, leading to strong selling pressure, followed by the formation of a converging triangle pattern.
This triangle appears to represent a corrective phase after a prolonged bullish rally.
The stock recently announced positive earnings results, reinforcing the underlying strength.
Considering the technical and fundamental setup, a bullish breakout from the triangle looks probable.
Trading Plan: Wait for a confirmed breakout above the upper trendline before entering a cautious long position. Traders can take a risky position after break-out of triangle. And for Cautious traders wait for the breakout from the upper tip of the triangle.
Stop Loss: Below the recent swing low.
Keep an eye on volume during the breakout — confirmation is key.
Happy Trading & Stay Disciplined!
Trade ideas
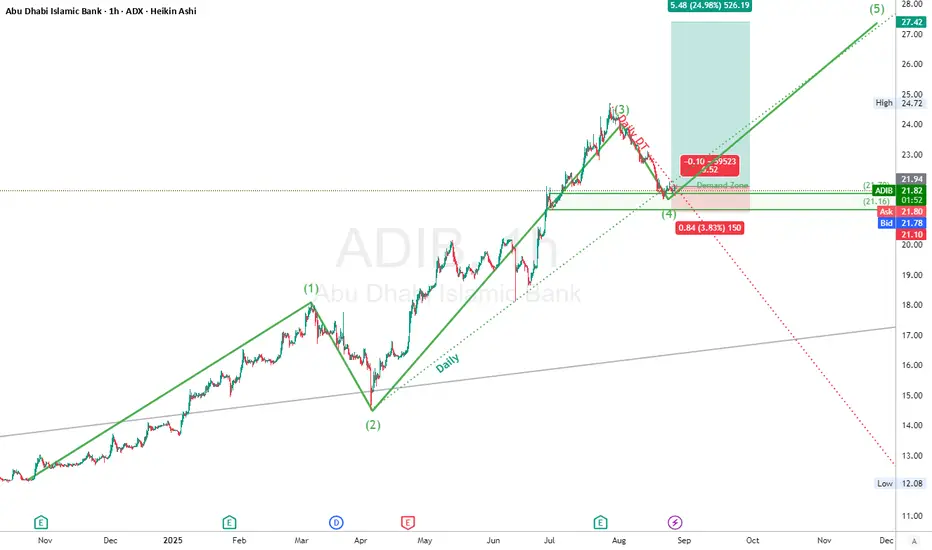
Abu Dhabi Islamic Bank (ADIB) – ADX– 1H chart -LongADIB is showing textbook Elliott Wave behavior. After a strong impulsive wave structure into wave (3), price corrected cleanly into the **Demand Zone** and held above the key support at **21.16** – right in line with a classic wave (4) retracement.
The drop into this zone followed a **bullish descending channel (bullish DT)**, indicating exhaustion of sellers and potential reaccumulation. Price is now rebounding from this base, suggesting wave (5) may just be starting.
A beautiful confluence of:
* Fib levels,
* Demand zone,
* Channel breakout,
* Wave (4) support.
The bulls are stepping in. This is **prime positioning**.
### 🟩 **Demand Zone**
* Key Zone: **21.10–21.78 AED**
* Clean support on both price structure and psychology; price wicked into zone but rejected downside.
### 🎯 **Trade Idea**
* **Entry**: 21.70–21.80 AED (current levels)
* **Stop Loss**: 21.10 AED (beneath structure low)
* **Take Profit**: 27.42 AED (projected wave (5) target)
* **Risk/Reward**: \~5.48R
"The market is a device for transferring money from the impatient to the patient." – Warren Buffett
### ⚠️ **Disclaimer**
This is not financial advice. Always perform your own analysis and manage your risk accordingly. This is for educational purposes only.
ADIB - Price action testing Fibonacci Retracement RatiosThe Price is testing the Fibonacci Retracement levels and is expected to continue uptrend. Good opportunity to buy at these levels. These levels are indicated on the chart.
