Short Semiconductors by Trading SOXS LongThis chart shows the long-term ratio between SOXL/SOXS. The intent is to detect reversals
between semi-conductors long and short. At the pivot high, the price of SOXL compared with
SOXS is at its highest. With a retreat from the pivot high, the price of SOXL is retreating while
SOXS is rising. Historically in 2022 as shown on the chart, pivots were with a ratio of 1,25 to
2,35 while the low pivots were with a ratio of 0.2 to 0.6.
At present SOXL has run up and over-extended as part of the AI breakout phenomenon. The
ratio of 1.8 is in the reversal zone where SOXL price is dropping while SOXS price begins
a significant rise. At present, the mass index is above 27 and awaiting a drop below 26.5.
The second indicator rate of change (ROC) detects spikes in the SOXL /SOXS ratio presumptive
for a pivot. The last time SOXS ran up over a long term ( with SOXL turning down)
was August to October when price increased from $33 to $88 representing a 266% rise.
I see this as a prior supertrend that could now be repeated again.
In conclusion, this idea leads me to take a swing long position is SOXS which I expect to
trend up over a period of a couple of months or more.
SOXL trade ideas

SOXLI hope you caught my idea earlier this month, in which I explain how April chop beneath mid of the 6-23 range likely deviation before sned.
Now that we're here:
If above 19 it's sending 23, which is first quarter of the whole move.
Has plenty of gap incentive for higher between first quarter and 50% retracement (40) as well.
If we do get the pullback to 17s you know what to do, but I believe it's going to be an exciting month of June.
If above 23 it's sending 40, so long as stays above 23.

Soxl longAMEX:SOXL
Soxl to the moonnnnnnn Soxl long over the next few days semiconductors are on fire right now. They’re holding the market up especially NVIDIA.

Mar/2023 Plan for $SOXLGT ($8.77) - VTN ($12.5) - Fibo ($12.45)
Plan A: Sell put option one month expire to earn premium at $12.5. Goal to earn 4% monthly premium from collaterals money.
Plan B: I am willing to hold SOXL long-term at $12.00/share if I need to exercise my Plan A sell put option.
Plan C: I will sell cover call option for Plan B to earn 4-5% monthly premium income from the stock value and dividend income.
Plan D: Only sell my SOXL at $19.00 for 55% capital gain from $12.00. Or I will continue to do Plan C to earn 4-5% monthly premium income from the stock value and dividend income.

SOXL - Rising Trend Channel [MID TERM]- SOXL is moving within a rectangle formation between support at 12.99 and resistance at 18.59.
- A decisive break through one of these levels indicates the new direction for the stock.
- SOXL is between support at 13.70 and resistance at 18.00.
- Overall assessed as technically positive for the medium long term.
*EP: Enter Price, SL: Support, TP: Take Profit, CL: Cut Loss, TF: Time Frame, RST: Resistance, RTS: Resistance to be Support LT TP: Long Term Target Price
*Chart Pattern:
DT - Double Top | BEARISH | RED
DB - Double Bottom | BULLISH | GREEN
HNS - Head & Shoulder | BEARISH | RED
REC - Rectangle | BLUE
iHNS - inverse head & Shoulder | BULLISH | GREEN
Verify it first and believe later.
WavePoint ❤️

SOXL Stock Chart Fibonacci Analysis 051523 Trading Idea
1) Find a FIBO slingshot
2) Check FIBO 61.80% level
3) Entry Point > 14.4/61.80%

Trading idea – Entry point > 13.2/61.80%Trading Idea
1) Find a FIBO slingshot
2) Check FIBO 61.80% level
3) Entry Point > 13.2/61.80%

SOXL Stock Chart Fibonacci Analysis 041123Trading Idea
1) Find a FIBO slingshot
2) Check FIBO 61.80% level
3) Entry Point > 17/61.80%

SOXLLocally, at least since last April, SOXL has been confined to a trading range as defined herein by yellow horizontal lines, which is the range from 23 highs to 6 lows, thereby having mid at 14.5. So long as above 14.5, I reckon that SOXL will make its way to the range highs (23). On a longer time horizon, it seems likely to reclaim 23 as support and resume trading within its larger range, which is from its 73 highs to 6 lows and has mid at 39.5. So 23 next, and then reclaim 23 for 39.

SOXL Stock Chart Fibonacci Analysis 0322231) Find a FIBO slingshot
2) Check FIBO 61.80% level
3) Entry Point > 17/61.80%

Megaphone Bottom | 20% move possibleDirexion Daily Semiconductor Bull 3X Shares forms bullish "Megaphone Bottom" chart pattern
"Megaphone Bottom" chart pattern formed on Direxion Daily Semiconductor Bull 3X Shares (SOXL:NYSE). This bullish signal indicates that the stock price may rise from the close of $16.61 to the range of $19.60 - $20.30. The pattern formed over 16 days which is roughly the period of time in which the target price range may be achieved, according to standard principles of technical analysis.
Tells Me: The recent broadening action tells us that trading has been out of control, but a breakout on the upside suggests we're starting a more decisive uptrend.
With its broadening price swings, the Megaphone represents a market that's unstable and out of control. It typically consists of two successively higher highs between three lower lows, and the reversal signal occurs when the price breaks up above the second peak (the highest high) as a sign of a more decisive bullish move.


SOXL - Failing Trend [MIDTERM]SOXL has broken through the ceiling of a falling trend channel in the medium long term. This indicates a slower falling rate initially, or the start of a more horizontal development. SOXL has received a positive signal from the moving average indicator, thus signaling a continued rise. The stock is approaching support at 14, which may give a positive reaction. However, a break downwards through 14 will be a negative signal. SOXL is overall assessed as technically neutral for the medium long term.

$SOXL something is cooking...$soxl Our next target is at 16.53, which is still 8.5% away from the current price. Breaking below 14.53 would be a weak support level.

SOXL to Big Lows 15 Min CandlesThere is a chance that SOXL might end up filling the gap January 23.
We are currently at the end of the Elliot wave theory so if that proves to be true we should continue to see a very steep decline.
With various reports coming out the only thing I think that would keep it up is good economic reports.
I think you will see SOXL come down to roughly $12.90 where it will test support at around $13.


Bear Penant Breaking OutBearish penant formed on the 1HR for AMEX:SOXL . Looks like a break out after hours and should confirm when Open.
RSI divergence is also present in recent hours.
Measured flag pole downwards tags the macro trend/flag that's formed on the daily.

SOXL Stock Chart Fibonacci Analysis 022523Trading Idea
1) Find a FIBO slingshot
2) Check FIBO 61.80% level
3) Entry Point > 13.6/61.80%

what happens if we stay near the bottom of this range?quite simply its very bearish. if semiconductors dont immediately rally over this pivot they wont come back this week. if they dont come back this week the whole market is headed down for now.

SOXL Stock Chart Fibonacci Analysis 022223Trading Idea
1) Find a FIBO slingshot
2) Check FIBO 61.80% level
3) Entry Point > 13.8/61.80%

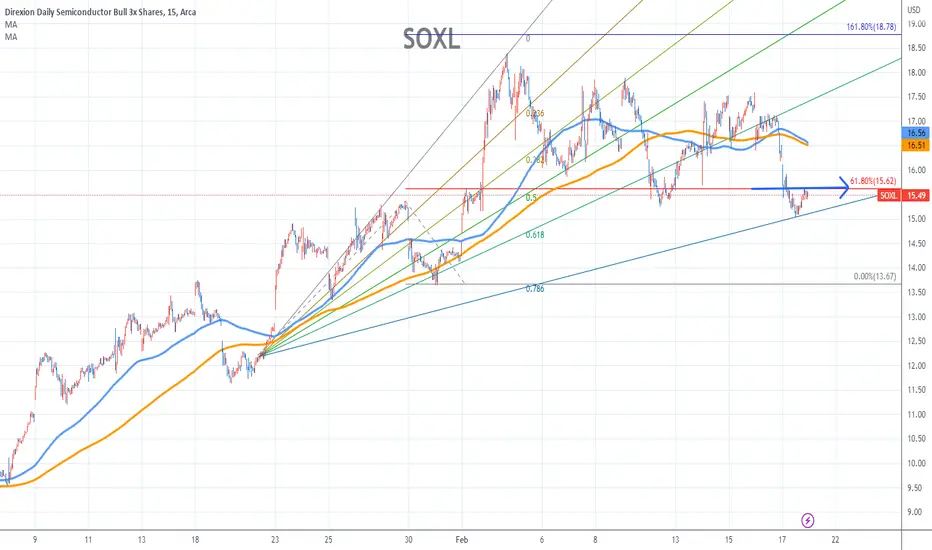
SOXL Stock Chart Fibonacci Analysis 021823Trading Idea
1) Find a FIBO slingshot
2) Check FIBO 61.80% level
3) Entry Point > 15.6/61.80%
SOXL break out!Been a while, but finally SOXL has broken out and IF this week keeps up or at least keeps where it is currently, it appears to be a clear breakout on the weekly chart.
Clearly, MACD and VolDiv are aligned for a bullish run.
Heads up!
Revisit again soon...
