XHB – A continuing long-term short with further downside potentiIn my analysis it is unquestionable that the housing market is weakening further, and a significant mid-term decline is inevitable.
My godchild is currently spending a few months in the United States, preparing for an English degree. What she tells me about the housing situation and grocery prices
Key stats
About State Street SPDR S&P Homebuilders ETF
XHB provides quirky and diffused exposure to homebuilders. It selects US firms by market-cap, then equally weights its components--an approach that results in a portfolio that tilts away from companies that dominate the industry. The fund reaches well beyond industry bounds by our lights: Most holdings land outside the homebuilding category. While XHB doubtlessly provides more diversification, investors looking for hefty stakes in leading names won`t find them here. Index rebalancing occurs quarterly. Prior to Oct. 31, 2025 the Issuer did not use the branding of State Street in the fund name.
Related funds

$XHB: A POTENTIAL REVERSAL PATTERN Monitoring a potential Falling Wedge. If it pans out (missing the last leg down) it should be followed by a sharp move to the upside
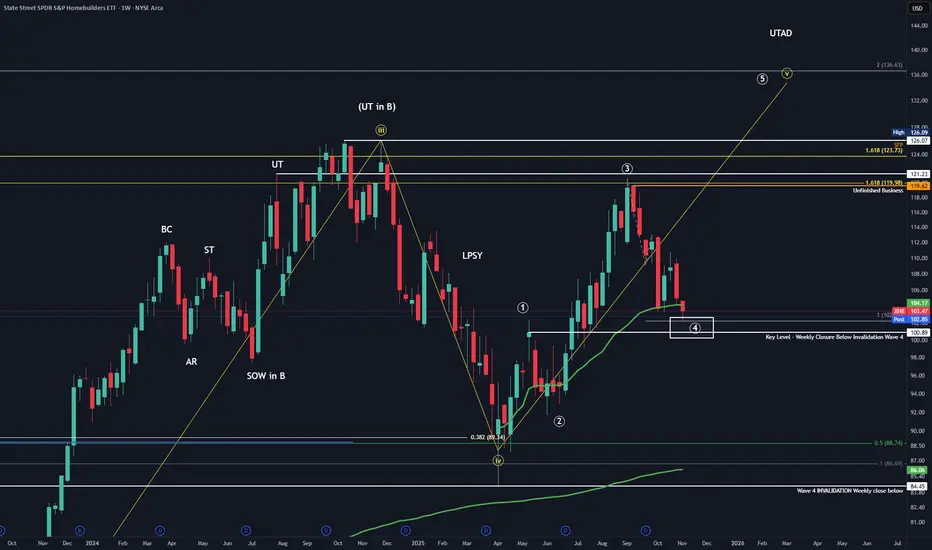
XHB Update! - HTF and Local Elliot Wave Count. KeyzoneXHB Keyzone hit for potential swing long to new ATH. Invalidation would be closing weekly candle below 100.89. It's okay to wick through the psychological level of 100, but closing below would invalidate the local wave 4.
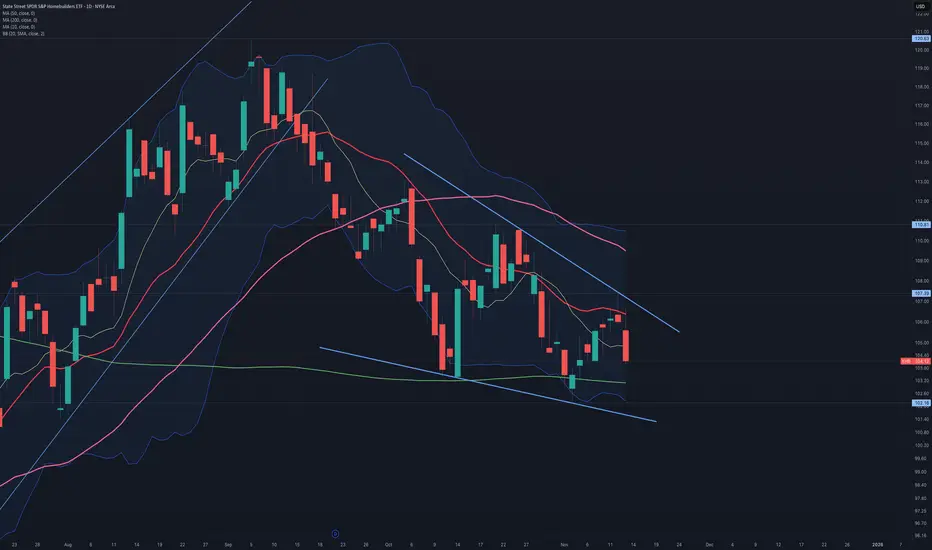
XHB - Housing Is In Real Trouble - My Short explained🏠 Some Facts & Fundamentals first 🏠
The Fed has made its first rate cut in 2025, and more are expected if inflation remains under control. That could put downward pressure on long-term mortgage rates, which may give the market a little boost.
Builders (like Lennar) are 🏚️ facing profit pressure 🏚️

My short analysis on why I am comfortably long XHB
Price making HHs and HLs
RSI making HHs and HLs
2 break above 200SMA, the second one making a HH with increasing volume
Price holding above 50 EMA which recently underwent a direction reversal

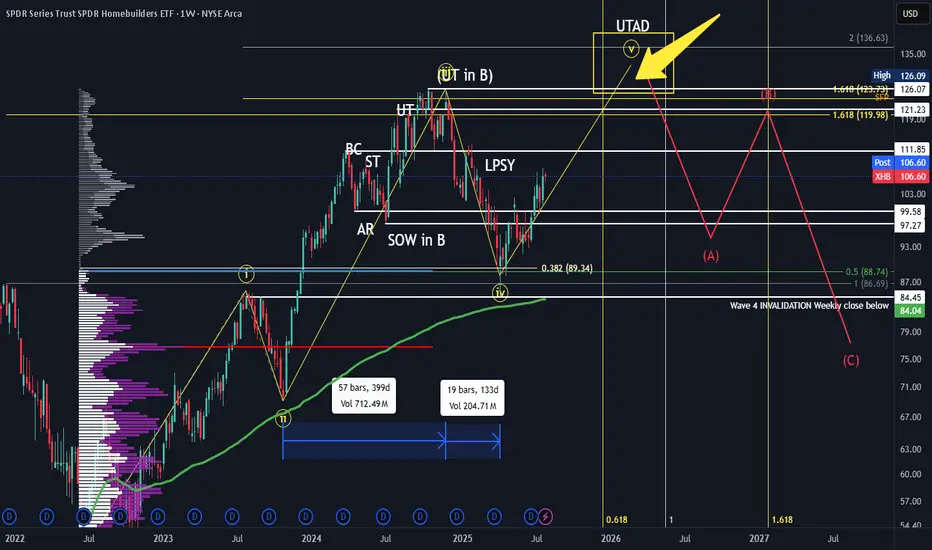
XHB HTF Elliot Wave Count and Wykoff Distribution HTF Elliot Wave Count aligning with HTF Wykoff Distribution Pattern. In confluence with Fibonnacci trend/extension and fibonnaci time. Also further confluence with SPX HTF Wave Count and Distribution
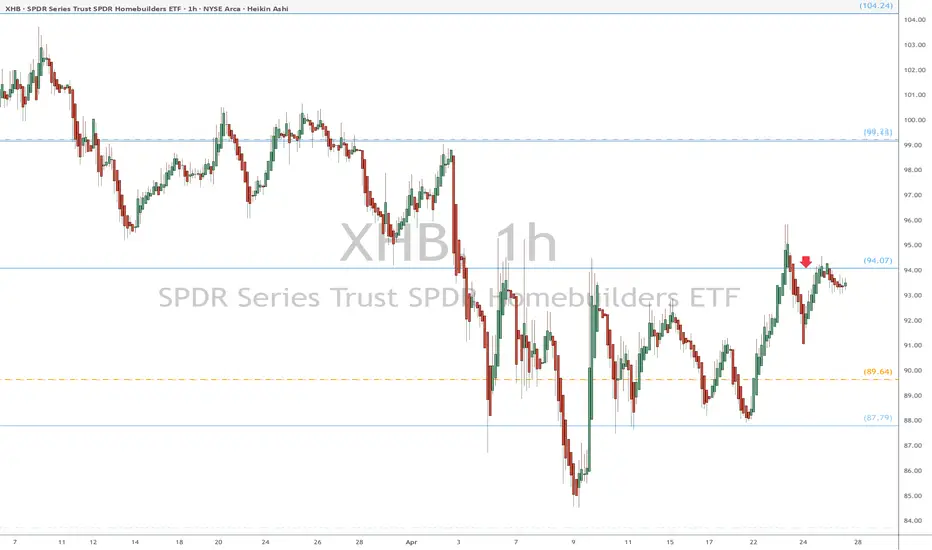
XHB eyes on $94.07: Semi-Major Genesis fib trying to End Bounce XHB trying to recover after good Housing reports.
Currently testing a Semi-Major Genesis fib at $94.07
Look for a dip or a Break-and-Retest to take entries.
$XHB - ShortSimilar to AMEX:SRS which is a short against real estate, AMEX:XHB is the home builders index. We again see a revesal candle into the prior qrtrs mother bar, if it closes inside the mother bar, a strong top signal is created.

Home building Will it continue or start decliningThis could be a leading indicator for what is to come. Let's keep an eye on it.
We do have a bearish divergence on the monthly RSI. It also is happening on the weekly as well.
It is to early to tell what direction it will go. We should expect a strong bounce from here and see where it goes.
Best

Shorting Homebuilders ETFIf you look at the Building Permits Leading Indicator, new permits have been decreasing since January 2022. Housing Starts will confirm the same... New Home Sales have decreased since 2020... Building Permits usually lead Housing Completion by 8-16 months...
Additionally Interest Rates have nearly

See all ideas
Summarizing what the indicators are suggesting.
Oscillators
Neutral
SellBuy
Strong sellStrong buy
Strong sellSellNeutralBuyStrong buy
Oscillators
Neutral
SellBuy
Strong sellStrong buy
Strong sellSellNeutralBuyStrong buy
Summary
Neutral
SellBuy
Strong sellStrong buy
Strong sellSellNeutralBuyStrong buy
Summary
Neutral
SellBuy
Strong sellStrong buy
Strong sellSellNeutralBuyStrong buy
Summary
Neutral
SellBuy
Strong sellStrong buy
Strong sellSellNeutralBuyStrong buy
Moving Averages
Neutral
SellBuy
Strong sellStrong buy
Strong sellSellNeutralBuyStrong buy
Moving Averages
Neutral
SellBuy
Strong sellStrong buy
Strong sellSellNeutralBuyStrong buy
Displays a symbol's price movements over previous years to identify recurring trends.
Frequently Asked Questions
An exchange-traded fund (ETF) is a collection of assets (stocks, bonds, commodities, etc.) that track an underlying index and can be bought on an exchange like individual stocks.
XHB trades at 121.36 USD today, its price has risen 1.89% in the past 24 hours. Track more dynamics on XHB price chart.
XHB price has risen by 5.22% over the last month, and its yearly performance shows a 13.75% increase. See more dynamics on XHB price chart.
NAV returns, another gauge of an ETF dynamics, have risen by 6.80% over the last month, showed a 14.64% increase in three-month performance and has increased by 15.36% in a year.
NAV returns, another gauge of an ETF dynamics, have risen by 6.80% over the last month, showed a 14.64% increase in three-month performance and has increased by 15.36% in a year.
Since ETFs work like an individual stock, they can be bought and sold on exchanges (e.g. NASDAQ, NYSE, EURONEXT). As it happens with stocks, you need to select a brokerage to access trading. Explore our list of available brokers to find the one to help execute your strategies. Don't forget to do your research before getting to trading. Explore ETFs metrics in our ETF screener to find a reliable opportunity.
In some ways, ETFs are safe investments, but in a broader sense, they're not safer than any other asset, so it's crucial to analyze a fund before investing. But if your research gives a vague answer, you can always refer to technical analysis.
Today, XHB technical analysis shows the buy rating and its 1-week rating is strong buy. Since market conditions are prone to changes, it's worth looking a bit further into the future — according to the 1-month rating XHB shows the strong buy signal. See more of XHB technicals for a more comprehensive analysis.
Today, XHB technical analysis shows the buy rating and its 1-week rating is strong buy. Since market conditions are prone to changes, it's worth looking a bit further into the future — according to the 1-month rating XHB shows the strong buy signal. See more of XHB technicals for a more comprehensive analysis.
No, XHB doesn't pay dividends to its holders.
XHB trades at a premium (0.00%).
Premium/discount to NAV expresses the difference between the ETF’s price and its NAV value. A positive percentage indicates a premium, meaning the ETF trades at a higher price than the calculated NAV. Conversely, a negative percentage indicates a discount, suggesting the ETF trades at a lower price than NAV.
Premium/discount to NAV expresses the difference between the ETF’s price and its NAV value. A positive percentage indicates a premium, meaning the ETF trades at a higher price than the calculated NAV. Conversely, a negative percentage indicates a discount, suggesting the ETF trades at a lower price than NAV.