ENERGY SECTOR One of the best performing sector of lately has been the energy sector. Most of the stocks are making new 52 week highs. I like XOM, OXY, CVX, DVN, and MRO. They still have some resistance above from 2018 year but still liking them to push higher.
Trade ideas

$XLE Long IdeaThe Energy sector has shown incredible strength during the market selloff as investors seek dividend paying stocks in a stage where rate hikes are inevitable. Historical data shows that energy sector outperforms in an economy with raising rates and this time is no different. With EPS around the corner for $XLE biggest holdings ($XOM, $CVX and $OXY), best case scenario would be an increase in dividend which should send investors running towards these names.
The technical side of this trade shows an strong uptrend with 52 week highs as the indices trade in a correction. If we look at the MACD, fairly bullish breakout and above resistance with room to run and thanks to the recent selloff, the RSI has restarted on longer time frames.
Targets for $XLE are 67, 72, and 76.
OptionsSwing Analyst
Daniel Betancourt
XLExle
this is more stuff
to put in the desc
so it's
fionally long enough please tv remove this i can't
thank you
xle looks good above those two lines

energy is another sector looking for a higher low (XLE)energy bullishness is another sector rotation play that makes me think were in a better place than some seem to believe. i think we will experience additional bolatility for the time being, but so will the markets at large. we should keep a decent uptrend, unless the pullback proves more retracement than risk tolerance for outflows can support.
the long and short of it is thag bulls have given themselves room to work with, even if we go sideways for a while.

Are we nearing the top on Energy and Oil?These are my ideas on trendlines mixed with a bit of market psychology.
***Not financial advice. Just entertainment and educational.

XLE target reachedXLE has blown past nearly all of my price target to sit underneath 69$. Daily chart is showing some sign of relief.

XLE to hit $130 by Jan 2025 a 300% gain from 2020 lowsCheck out the two trends prior to this. Clearly, you can see the run of over 300% that was 6 years long and then another 5-year trend at 142% gain. I believe we have entered commodities run and companies that produce oil and sell gasoline or diesel are going to benefit hugely. I am making a call that by January of 2025 we will see XLE at $130. Even if it doesn't, WTI Crude will hit that $130 mark. Two calls right there I think are very realistic repeating that 5-6 year trend which also matches the first 300% gain although the climb may be steeper. I think that climb coincides with how much inflation we have so I believe it's still a fair analysis overall.
If you have not watched my recent video on hyperinflation, I suggest you do. At least go compare a 1month chart of the M2 money supply (M2SL) to the SPX. Hand a hand increases and parabolic running back to 1960. It looks to be sometime around 2025 we hit our first level of lift-off, straight up as the curve stops and begins to head to the moon. This happens to land around my chart here with XLE being at $130 by 2025. After 2025 all bets are off. WE could be heading into a massive inflationary person and it could be a billion per share or something crazy. That number won't matter anymore of course as it's only nominal.

XLE and Moon Cyclesuhoh...New Moon Cycle at a high.
Can it still hit 71.33?
Or just a temporary high???

Energy is overinvestedEnergy was by far the best sector in 2021, now the cycle is moving on, so its due for a descent pullback

XLE broke out downtrend line; looking goodXLE broke out of downtrend line & rising wedge.
It is now above all moving averages & the cloud in this weekly chart,
Measured targets of big & small head & shoulders are 80/85.
Not trading advice


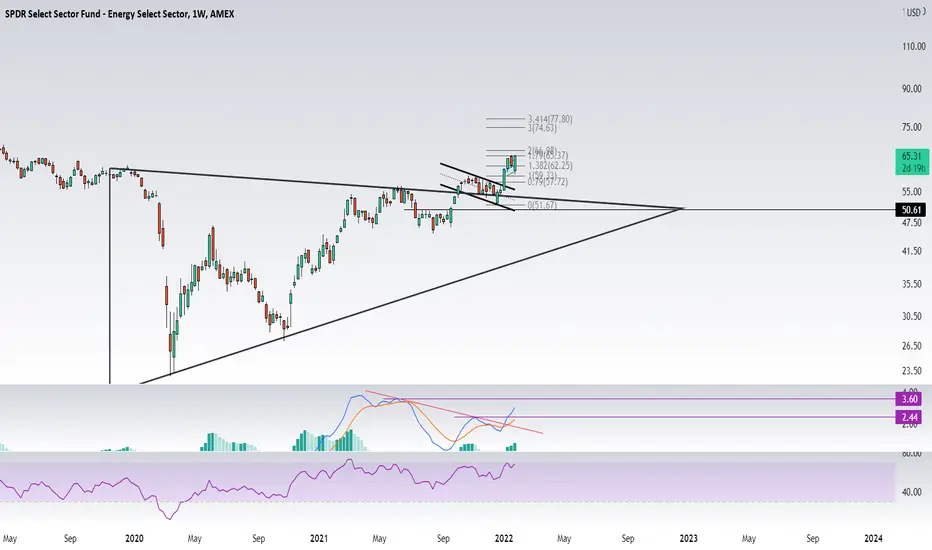
Energy Sector going Down. XLEImmediate targets 60, 58, 57 .
We are not in the business of getting every prediction right, no one ever does and that is not the aim of the game. The Fibonacci targets are highlighted in purple with invalidation in red. Fibonacci goals, it is prudent to suggest, are nothing more than mere fractally evident and therefore statistically likely levels that the market will go to. Having said that, the market will always do what it wants and always has a mind of its own. Therefore, none of this is financial advice, so do your own research and rely only on your own analysis. Trading is a true one man sport. Good luck out there and stay safe


XLE...false break?At current levels ($64), XLE seems to have have done a textbook break and retest of the downrend (purple) in place since 2014 that wold indicate a powerfull move higher is in the cards. However, the impulse move since the lows of march2020 seems complete and XLE reached its minimum target in the $66 area last week. This, plus overbought technicals (Stoch RSI) might suggest that we might be looking at a false break and XLE is about to move below the trendline again for a correction at least to the 50wk ma ($53) that has been significant in the past and potentially lower. All eyes on the FED tomorrow. A dovish tone will likely send XLE higher towards $79. on the opposite, if the FED maintains its recent hike rethoric we will be looking at the false break scenario described above.

XLE S&P Oil and Energy Sector in UptrendOil is in an Uptrend,
Higher Highs and Higher Lows.
Should bounce at support zones
59.40-57.
Read notes.

XLE S&P Oil and Energy SectorXLE is the ETF of the S&P Oil and
Energy Sector.
If you have to buy anything...
This should be it right now.
Oil could spike up when the Russians roll
(which will be any day now).
If you see 60, might be a good entry.
Oil could easily see $100 a barrel or more
very soon.
if you can swing it...February calls would work.

Another Take of XLE relative to broader equity marketsAnother Take of XLE relative to broader equity markets
would love to hear thoughts from others on this one

4 reasons to be bullish on energy XLE1) XLE just break above the neckline of precious big Head & Shoulder correction.
2) XLE just breakout of a falling wedge.
3) XLE just breakout of a rising wedge.
4) XLE have to be bullish in 2022 econimic recovery.
Wave 3 continues in 2022.
What do you think?

Energy ($XLE) Relative to S&P 500 ($SPY)The energy sector is looking to breakout of a 2-year consolidation phase. Perhaps 3rd time is a charm. Largest components of $XLE include: Exxon Mobil ($XOM), Chevron ($CVX), EOG Resources ($EOG), Schlumberger ($SLB), & ConocoPhillips ($COP).

SHORT XLEThe Energy Sector will be the first to sell off once high growth becomes favored again. XLE is overpriced because of inflation fears when in reality inflation is on a downtrend Month over Month. I expected to see Energy costs fall in the short term along with XLE's price. Playing 2/18 $61 puts at $1.59 a contract.

XLE 55/53 Put Credit SpreadOpened for a 0.25 Credit
XLE is making a strong move upwards, this filled on the afternoon pullback. If this pulls back in the next few days I will add the call side to turn this into a IC. This will provide me delta neutrality and allow me to play the range from 55-60.

Energy and Financials Look Like Tech 5-1/2 Years Ago2022 has begun with another sharp rotation from growth to value stocks. The SPDR Technology ETF had its biggest weekly drop in over a year, while the SPDR Energy ETF had its biggest gain in even longer.
Financials also jumped:
Price action in the two value sectors (XLE and XLF) seems to resemble XLK another moment 5-1/2 years ago. The chart below shows XLK between January 2015 and November 2016. Notice how the tech ETF spent more than a year consolidating sideways after a big run, chopping along its 100- and 200-day simple moving averages (SMAs) before breaking out. There was also a bullish candlestick pattern (post-Brexit kicker) on June 27-28, 2016:
XLE and XLF haven’t consolidated as long as XLK in 2016, but they have other similarities. Both moved sideways for at least six months and spent time below their 100-day SMAs. Both made one final higher low at the 200-day SMAs. Both had potentially bullish candlesticks (abandoned-baby hammers). And, most importantly, both closed at new highs.
It’s also noteworthy that XLK’s 2016 breakout helped launch the current regime of FANG and “big cap growth.” Now as investors shed tech stocks and monetary conditions grow less favorable , similar breakouts have occurred in the polar-opposite sectors. Are we entering a new phase of the market, led by neglected cyclical value names?
TradeStation is a pioneer in the trading industry, providing access to stocks, options, futures and cryptocurrencies. See our Overview for more.
Important Information
TradingView is not affiliated with TradeStation Securities Inc. or its affiliates. TradeStation Securities, Inc., TradeStation Crypto, Inc., and TradeStation Technologies, Inc. are each wholly owned subsidiaries of TradeStation Group, Inc., all operating, and providing products and services, under the TradeStation brand and trademark. When applying for, or purchasing, accounts, subscriptions, products and services, it is important that you know which company you will be dealing with. Please click here for further important information explaining what this means.
This content is for informational and educational purposes only. This is not a recommendation regarding any investment or investment strategy. Any opinions expressed herein are those of the author and do not represent the views or opinions of TradeStation or any of its affiliates.
Investing involves risks. Past performance, whether actual or indicated by historical tests of strategies, is no guarantee of future performance or success. There is a possibility that you may sustain a loss equal to or greater than your entire investment regardless of which asset class you trade (equities, options, futures, or digital assets); therefore, you should not invest or risk money that you cannot afford to lose. Before trading any asset class, first read the relevant risk disclosure statements on the Important Documents page, found here: www.tradestation.com .

XLE - Breakout of 7 Year Downtrend XLE topped in June 2014, and finally broke the down trend on 1/10/22. OPEC and US producers showing tremendous fiscal and drilling discipline (great for shareholders). Oil supply / demand imbalance will only grow more extreme as omicron wanes, and the global economy continues to reopen.
Best performing sector YTD :)
