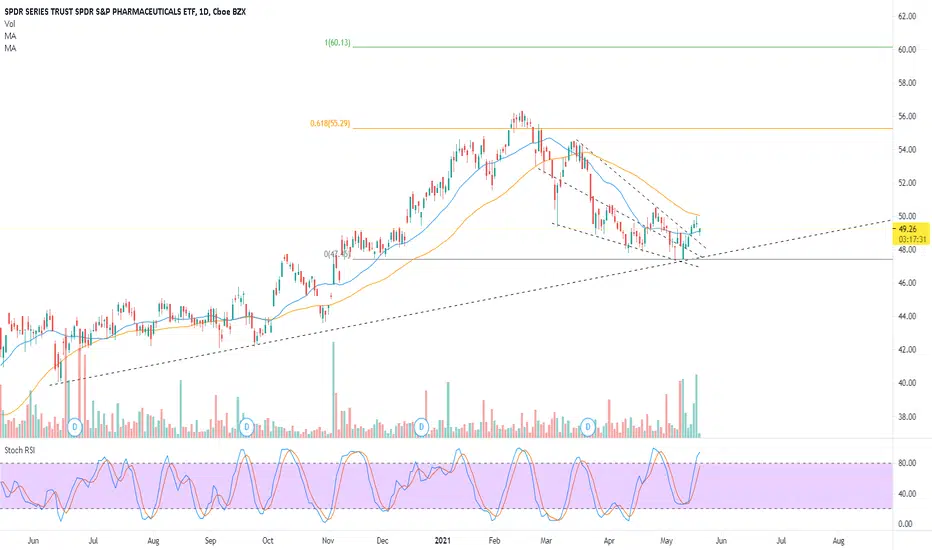
XPH eyes on $44: long term resistance looks broken and retestedPharma as a whole is lagging the market.
Few of the co's are flying but rest are not.
ETF has broken and retested key resistance.
$ 43.96 - 44.17 is the exact zone to flip.
$ 39.27 - 39.94 below is a major support.
$ 47.20 - 47.99 above is major resistance.
=======================================
Key stats
About State Street SPDR S&P Pharmaceuticals ETF
XPH offers equal-weighted exposure to a narrow selection of US pharmaceutical companies, stretching across all market caps. XPH's weighting scheme causes it to be far less concentrated than the industry, which is dominated by a handful of mega-cap names like J&J, Pfizer and Merck. The fund also introduces a heavy tilt to mid- and small-caps, which makes for a rather volatile fund relative to the industry. Overall, XPH is a solid way to capture a less concentrated version of the pharma market. The index is rebalanced quarterly. Prior to Oct. 31, 2025 the Issuer did not use the branding of State Street in the fund name.
Related funds

S&P Pharmaceutical Sector: A Prescription for Growth● The S&P Pharmaceutical sector has great potential for growth.
● The weekly chart shows that after breaking out of the Symmetrical Triangle Pattern, the ETF had a short period of consolidation and is now ready for a rise.
● The daily chart also indicates a Cup & Handle Pattern, with the price trend

Vertex PharmaNASDAQ:VRTX is on a verge of a breakout. AMEX:XPH is also staging a recovery, but still trading below key levels. For now, the focus in on a NASDAQ:VRTX look position.

XPH | Pharmaceuticals to Outperform- Price is breaking minor falling wedge pattern on strong volume
- Pharmaceutical stocks have lagged the broader market in the past year and have not been so inexpensive relative to the S&P 500 in at least 20 years
- As the healthcare sector is starting to out perform the overall market, I have be


See all ideas
Summarizing what the indicators are suggesting.
Oscillators
Neutral
SellBuy
Strong sellStrong buy
Strong sellSellNeutralBuyStrong buy
Oscillators
Neutral
SellBuy
Strong sellStrong buy
Strong sellSellNeutralBuyStrong buy
Summary
Neutral
SellBuy
Strong sellStrong buy
Strong sellSellNeutralBuyStrong buy
Summary
Neutral
SellBuy
Strong sellStrong buy
Strong sellSellNeutralBuyStrong buy
Summary
Neutral
SellBuy
Strong sellStrong buy
Strong sellSellNeutralBuyStrong buy
Moving Averages
Neutral
SellBuy
Strong sellStrong buy
Strong sellSellNeutralBuyStrong buy
Moving Averages
Neutral
SellBuy
Strong sellStrong buy
Strong sellSellNeutralBuyStrong buy
Displays a symbol's price movements over previous years to identify recurring trends.
Frequently Asked Questions
An exchange-traded fund (ETF) is a collection of assets (stocks, bonds, commodities, etc.) that track an underlying index and can be bought on an exchange like individual stocks.
XPH trades at 56.84 USD today, its price has risen 0.04% in the past 24 hours. Track more dynamics on XPH price chart.
XPH price has fallen by −0.11% over the last month, and its yearly performance shows a 24.49% increase. See more dynamics on XPH price chart.
NAV returns, another gauge of an ETF dynamics, have risen by 2.22% over the last month, showed a 11.89% increase in three-month performance and has increased by 26.16% in a year.
NAV returns, another gauge of an ETF dynamics, have risen by 2.22% over the last month, showed a 11.89% increase in three-month performance and has increased by 26.16% in a year.
Since ETFs work like an individual stock, they can be bought and sold on exchanges (e.g. NASDAQ, NYSE, EURONEXT). As it happens with stocks, you need to select a brokerage to access trading. Explore our list of available brokers to find the one to help execute your strategies. Don't forget to do your research before getting to trading. Explore ETFs metrics in our ETF screener to find a reliable opportunity.
In some ways, ETFs are safe investments, but in a broader sense, they're not safer than any other asset, so it's crucial to analyze a fund before investing. But if your research gives a vague answer, you can always refer to technical analysis.
Today, XPH technical analysis shows the buy rating and its 1-week rating is buy. Since market conditions are prone to changes, it's worth looking a bit further into the future — according to the 1-month rating XPH shows the buy signal. See more of XPH technicals for a more comprehensive analysis.
Today, XPH technical analysis shows the buy rating and its 1-week rating is buy. Since market conditions are prone to changes, it's worth looking a bit further into the future — according to the 1-month rating XPH shows the buy signal. See more of XPH technicals for a more comprehensive analysis.
No, XPH doesn't pay dividends to its holders.
XPH trades at a premium (0.08%).
Premium/discount to NAV expresses the difference between the ETF’s price and its NAV value. A positive percentage indicates a premium, meaning the ETF trades at a higher price than the calculated NAV. Conversely, a negative percentage indicates a discount, suggesting the ETF trades at a lower price than NAV.
Premium/discount to NAV expresses the difference between the ETF’s price and its NAV value. A positive percentage indicates a premium, meaning the ETF trades at a higher price than the calculated NAV. Conversely, a negative percentage indicates a discount, suggesting the ETF trades at a lower price than NAV.