BITX to 3Xdue to it being a 2x leverage ETF
we need to respect that chart patterns can be distorted.
So when a regular Hunt Volatility Funnel usually consolidates sideways before a explosive breakout move.
A levered ETF can be distorted , so that the sideways consolidation is actually pointing UP.
Givin
Key stats
About 2x Bitcoin Strategy ETF
Home page
Inception date
Jun 27, 2023
Structure
Open-Ended Fund
Replication method
Synthetic
Dividend treatment
Distributes
Distribution tax treatment
Ordinary income
Income tax type
Capital Gains
Max ST capital gains rate
39.60%
Max LT capital gains rate
20.00%
Primary advisor
Volatility Shares LLC
Distributor
Foreside Fund Services LLC
ISIN
US92864M3016
BITX aims to provide 2x daily exposure to bitcoin futures. The fund seeks to track the price movement of bitcoin futures traded on the CME Futures Exchange for a single day. The fund buys cash-settled Bitcoin futures contracts and will roll the contracts on a monthly basis, as they near expiration. The expiring contracts are replaced with the next month contracts. The final trade date each month is the last Friday of the contract month. On day T-2 at market close, the index is 0% in the expiring futures contract and 100% in the next futures contract. Futures contracts can and often do trade in backwardation, meaning the costs of rolling contracts will reduce returns. The index itself is price weighted and does not rebalance. As a result, the return of BITX shares can vary significantly from 2x exposure, if held for longer than a day. As a geared product with daily resets, the fund is designed as a short-term trading tool and not a long-term investment vehicle.
Related funds
Classification
Symbol
Geography
Global
What's in the fund
Exposure type
Mutual fund
Cash
Bonds, Cash & Other100.00%
Mutual fund82.37%
Cash17.63%
Top 10 holdings
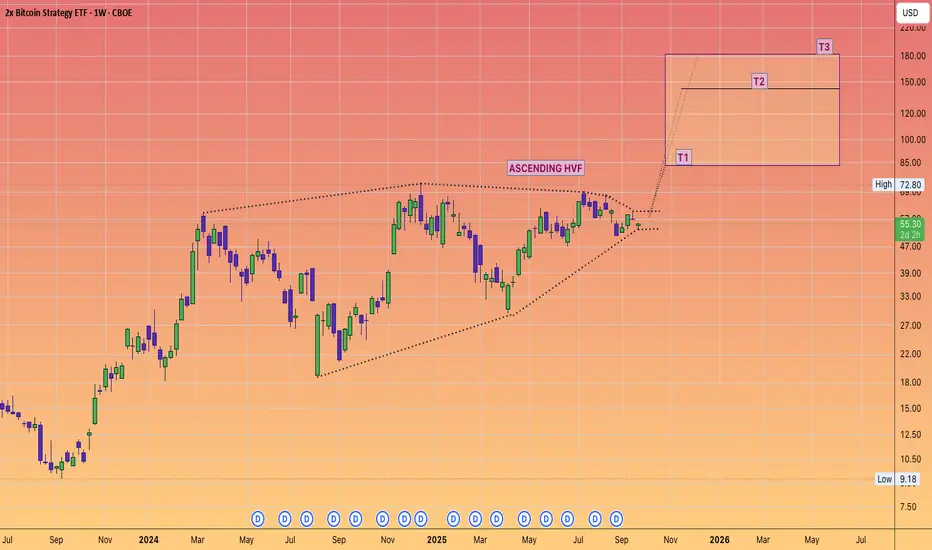
return to support provides buy entry 1->4 : return to proven buyers
next ?
* linear regression 2nd std. break to upside
* vpoc protecting stop loss & support buyside
* bullish divergence
* obv downtrend broken to upside
* number 2,3 and 4 break bb extreme deviation

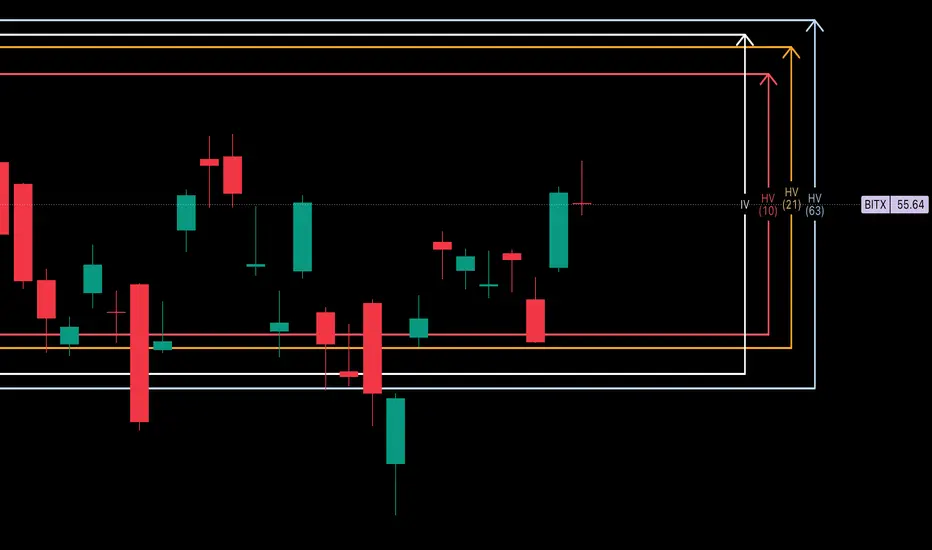
BITx -- Weekly Volatility SnapshotHello Bitcoin community 🤠👾🤑👾🤠
Good morning/Good afternoon, maybe goodnight to you pending where you are in the world!
Nonetheless, I'm glad you found me because here we are going to look over our weekly historical volatility ranges on CBOE:BITX and assess where IV is in perspective to what's tr
BITx - Weekly Volatility Snapshot Good Morning -- Happy Father's day to any dad's out there!
Let's took a weekly look at CBOE:BITX -- our 2x leveraged BITSTAMP:BTCUSD fund.
Last week, we saw a beautiful gap up to the upper HV63 implied ranges were profit was taken and accelerated selling begin. Our bi-weekly trending values h

BITx - Weekly Volatility PotentialGood Morning!
Here is my weekly perspective for CBOE:BITX --
From when we reviewed last weekend, IV (84.60%) has lowered -2.39% and is entering the week with a 2% IVp. We have been in this pattern of rotating IV and Bi-Weekly volatility trends back and forth as HV10 (62.69%) entering the week ha

BITx - Weekly Volatility SnapshotGood afternoon -- Here is my weekly perspective for CBOE:BITX
IV (86.99%) entering the week sits in the 3rd percentile for the year. HV10 (60.22%) has been lowering towards it's yearly lows of 47.87% showing a coiling of bi-weekly values at 87.65% from this -- and a divergence from IV of -26.77

BITx - Weekly Volatility SnapshotGood Afternoon,
Here is my weekly perspective for CBOE:BITX
IV (96.75%) entering this week is holding in the 18th percent range for the year and has been climbing weekly from putting in new lows at the beginning of the year. We essentially have been seeing rising IV with rising price action, th

BITx Weekly PotentialVolatility, expressed through standard deviation, quantifies market elasticity and presents a level of probability and precision that humbles us all.
Now we move on to the world of BTC with a look at CBOE:BITX
Here, as we have been observing an ongoing regression, you see that HV10 has expande

BITX — Harmonic Completion: Expression in Time for point ‘D’CBOE:BITX
I wanted to share my concept of fibonacci retracement in time with the community and why I selected the 86.6% retracement of this sell off for point ‘D’ within my harmonic structure with an exit and completion of today.
This was a 45 day sell off after the first ‘W’ price distribution

Using Historical Volatility and HarmonicsI track bi-weekly, monthly, and quarterly volatility to have a feel for how trending markets elasticity is and I weight this volatility percentage to the ever sliding IV environment and calculate an implied range for the week.
This helps me gauge the weekly candle potential.
Here you see my HV10/2

See all ideas
Summarizing what the indicators are suggesting.
Oscillators
Neutral
SellBuy
Strong sellStrong buy
Strong sellSellNeutralBuyStrong buy
Oscillators
Neutral
SellBuy
Strong sellStrong buy
Strong sellSellNeutralBuyStrong buy
Summary
Neutral
SellBuy
Strong sellStrong buy
Strong sellSellNeutralBuyStrong buy
Summary
Neutral
SellBuy
Strong sellStrong buy
Strong sellSellNeutralBuyStrong buy
Summary
Neutral
SellBuy
Strong sellStrong buy
Strong sellSellNeutralBuyStrong buy
Moving Averages
Neutral
SellBuy
Strong sellStrong buy
Strong sellSellNeutralBuyStrong buy
Moving Averages
Neutral
SellBuy
Strong sellStrong buy
Strong sellSellNeutralBuyStrong buy
Displays a symbol's price movements over previous years to identify recurring trends.
Frequently Asked Questions
An exchange-traded fund (ETF) is a collection of assets (stocks, bonds, commodities, etc.) that track an underlying index and can be bought on an exchange like individual stocks.
BITX trades at 31.03 USD today, its price has risen 10.39% in the past 24 hours. Track more dynamics on BITX price chart.
BITX net asset value is 28.10 today — it's fallen 39.35% over the past month. NAV represents the total value of the fund's assets less liabilities and serves as a gauge of the fund's performance.
BITX assets under management is 1.37 B USD. AUM is an important metric as it reflects the fund's size and can serve as a gauge of how successful the fund is in attracting investors, which, in its turn, can influence decision-making.
BITX price has fallen by −39.09% over the last month, and its yearly performance shows a −50.03% decrease. See more dynamics on BITX price chart.
NAV returns, another gauge of an ETF dynamics, have fallen by −39.35% over the last month, showed a −47.97% decrease in three-month performance and has decreased by −46.02% in a year.
NAV returns, another gauge of an ETF dynamics, have fallen by −39.35% over the last month, showed a −47.97% decrease in three-month performance and has decreased by −46.02% in a year.
BITX fund flows account for −637.35 M USD (1 year). Many traders use this metric to get insight into investors' sentiment and evaluate whether it's time to buy or sell the fund.
Since ETFs work like an individual stock, they can be bought and sold on exchanges (e.g. NASDAQ, NYSE, EURONEXT). As it happens with stocks, you need to select a brokerage to access trading. Explore our list of available brokers to find the one to help execute your strategies. Don't forget to do your research before getting to trading. Explore ETFs metrics in our ETF screener to find a reliable opportunity.
BITX invests in funds. See more details in our Analysis section.
BITX expense ratio is 2.38%. It's an important metric for helping traders understand the fund's operating costs relative to assets and how expensive it would be to hold the fund.
Yes, BITX is a leveraged ETF, meaning it uses borrowings or financial derivatives to magnify the performance of the underlying assets or index it follows.
In some ways, ETFs are safe investments, but in a broader sense, they're not safer than any other asset, so it's crucial to analyze a fund before investing. But if your research gives a vague answer, you can always refer to technical analysis.
Today, BITX technical analysis shows the sell rating and its 1-week rating is sell. Since market conditions are prone to changes, it's worth looking a bit further into the future — according to the 1-month rating BITX shows the strong sell signal. See more of BITX technicals for a more comprehensive analysis.
Today, BITX technical analysis shows the sell rating and its 1-week rating is sell. Since market conditions are prone to changes, it's worth looking a bit further into the future — according to the 1-month rating BITX shows the strong sell signal. See more of BITX technicals for a more comprehensive analysis.
Yes, BITX pays dividends to its holders with the dividend yield of 20.95%.
BITX trades at a premium (0.05%).
Premium/discount to NAV expresses the difference between the ETF’s price and its NAV value. A positive percentage indicates a premium, meaning the ETF trades at a higher price than the calculated NAV. Conversely, a negative percentage indicates a discount, suggesting the ETF trades at a lower price than NAV.
Premium/discount to NAV expresses the difference between the ETF’s price and its NAV value. A positive percentage indicates a premium, meaning the ETF trades at a higher price than the calculated NAV. Conversely, a negative percentage indicates a discount, suggesting the ETF trades at a lower price than NAV.
BITX shares are issued by Volatility Shares LLC
BITX follows the BTC/USD Exchange Rate - USD - Benchmark Price Return. ETFs usually track some benchmark seeking to replicate its performance and guide asset selection and objectives.
The fund started trading on Jun 27, 2023.
The fund's management style is active, aiming to outperform its benchmark index by actively selecting and adjusting assets. The goal is to achieve returns that exceed those of the index the fund tracks.