ASX LIMITED: 15 AUG, 2025 ELLIOTT WAVE ANALYSISConclusion: Bearish pressure is increasing, wave C)-blue is likely pushing lower.
Key Points: Wave C)-blue is moving lower, targeting 48.12. While price must remain below 73.88 to remain bearish.
On the other hand, when price action moves above 73.88, it is directly suggesting that wave 3)-purple is moving much higher at that point.
©By Hua Chi Cuong (Shane), CEWA-M (Certified Elliott Wave Analyst - Master Level).
ASX Limited
No trades
Trade ideas

DAILY TRADER’S PLANNER🌅 MORNING PREP
⏰ 6:00 a.m. – 6:45 a.m. | Ground the Mind
Light movement / stretching / walk
20–25 min mindfulness meditation
5 min breath journaling:
My emotional tone this morning
Any lingering bias, fear, or excitement from yesterday?
What does a calm, rule-following day look like?
🧠 Anchor Phrase:
“I will execute my edge with clarity, not with hope.”
🧠 MARKET PREP
🕕 6:45 a.m. – 7:30 a.m. | Systems First
Review open trades: still valid per system?
Check watchlist: any potential setups for today?
Pre-calculate entry, stop, and position size for each
If in drawdown: confirm size adjustment without changing rules
📚 PRE-MARKET NOURISHING TIME
🕖 7:30 a.m. – 8:30 a.m. | Detach Before the Storm
No charts, no news, no Twitter
Read non-market material (Zen, philosophy, biography)
Eat a light, mindful breakfast.
2-minute breath anchor before charts
📊 FINAL SCAN & ORDER PREP
🕣 8:30 a.m. – 9:15 a.m.
Check for overnight/pre-market price shifts.
Finalise trade orders: entries, stops, position sizes
Place limit/stop orders or set alerts
Mentally commit to no improvising.
🔔 NYSE OPEN – CONTROLLED EXECUTION
🕤 9:30 a.m. – 10:00 a.m. | First 30 Minutes
Monitor for order fills or open adjustments per rules
Avoid impulsive trades — wait for planned triggers
Log trades immediately if filled
⏳ MID-SESSION CHECKS
🕛 12:00 p.m. | Halfway Through
Scan for stops hit / targets reached
Adjust only per system rules
Breathing reset before clicking anything
📉 MARKET CLOSE REVIEW
🕓 4:00 p.m. – 4:15 p.m.
End-of-day close review for signals
Record trades and update journal (R-multiples, emotional state)
Note any pending setups for tomorrow
🛑 POST-MARKET DECOMPRESSION
After 4:15 p.m. – until next morning
All trading screens off by 6:00 p.m.
Movement or nature time
Dinner without market talk or news
Fiction reading or creative time
Gratitude journaling
🌀 WEEKLY REVIEW (Saturday Morning)
R-multiples gained/lost
Did I follow the system in all trades?
Any emotional overrides?
Any refinements needed for execution or prep?

ASX on WatchLooking to buy the pullback/retest under $68
Why:
Looking for bounce off demand zone, $67.50 - $68
1.618 fib extension lines up with demand zone
Head and shoulders pattern is forming. Not a good time to go long

StochRSI Daily Swing Strategy – TP/SL 1% | ASX | 90d BackTesterThis is a just for fun Stochastic RSI-based strategy designed for ASX stocks on the Daily chart.
It aims to capture small but consistent swings with a 1% Take-Profit and 1% Stop-Loss.
Ideal for back and forward testing short-horizon trades with tight risk control.
Currently back-tested over 90 days with a 100% win rate (3/3 trades).
Parameters: RSI(15), %K(9), Smooth K(2), D(4).

AUS Stock: ASX - Elliott Wave Analysis - 07 OCT, 2024 - BullishAUSTRALIAN STOCK: ASX - 7 OCT, 2024
©Master of Elliott Wave: Hua (Shane) Cuong, CEWA-M.
Wave (iii)-orange is unfolding to push higher, targeting the nearest target at 70.00. While price must remain above 61.72 to maintain this view.

ASX stock market hey guys,
looking at this as a contracting flat with more downside to break the previous short-medium term low of ~54

ASX Wyckoff DistributionWyckoff Distribution possibly on Weekly/monthly timeframe. not sure if this actually plays out but something to keep a eye on

ASX LIMTED: 11 July, 2024© Master of Elliott Wave Analysis: Hua (Shane) Cuong, CEWA-M (Master's Designation)
Wave 3-grey is opening up to push higher, it is subdividing into wave (iii)-orange; while the price must sustain above the 60.58 level to sustain this view.
Invalidation point: 58.17

ASX.ASX: 04 July, 2024© Master of Elliott Wave Analysis: Hua (Shane) Cuong, CEWA-M
Details: The short-term outlook shows some evidence that wave 2-grey has ended. Wave 3-grey appears to be unfolding to push higher.
Invalidation point: 58.17

ASX LIMITED: 10 June, 2024© Master of Elliott Wave Analysis: Hua (Shane) Cuong, CEWA-M
Details: The shorter-term outlook shows that since the low at 61.36, wave 2-grey appears to have ended, and this allows wave 3-grey to unfold to push higher. Wave (i)-orange is unfolding and is fulfilling its role, following which wave (ii)-orange will unfold as ABC. We will be watching ASX LIMITED for a Long Trade Setup.
Invalidation point: 61.36

ASX LimitedASX is showing resistance and support. Trade has been set that shows that this sideways trend will stay

ASX Rising wedge On the chart we can see a rising wedge formation.
The price is still moving inside the pattern. Once is breaks the support line it would be a good time to enter the short position.
Target is showing on the chart.

ASX LTDWave 4 has completed with WXY pattern composed of zigzag and flat pattern.
The next wave is 5 which is just starting to form, heading to a first Target of $90.

ASX Bullish MovePrice continues to slide bearish, 12.92% decrease from high volume Node (P.O.C).
However, previous high volume node, VRVP of $81.48 and average closing price of $81.12 seems like the fair Value of ASX:ASX. Entering low volume node territory now and the only other times in recent memory that price entered these zones were highly volatile market conditions 1) Covid 2) Inflationary issues, Ukraine war and energy concerns etc. These seem like exceptional circumstances for these zones. Also, when price dropped to these zones there was accumulation, followed by bullish moves. It would seem that the market players value this asset higher. Additionally, This area is a previous support with significant price action having occurred in these areas.
As added confirmation, MACD is showing slowing bearish momentum. Highly probable to turn bullish with possibly a crossover in due time.

ASX BEARISHASX monthly chart with SMA 11, 13, 15. Price chart removed.
Looks like 2008 and 2020.
Sidenote Australia raised interest rates today.
Additionally, notice the double top.

Silver/ASX ratio breakdownIt's finally looking like Silver is going to outpace the ASX. A breakdown from the clear descending wedge after a clear double top on the Weekly time frame, I am feeling very bullish. Inflation is here to stay, and fiat currencies are in trouble.
Eyes are getting drawn to the shiny stuff.

The ASX looks goodMonthly chart for the ASX (Australian market)
Green ovals show the clear bull rejections along the major trendline which has been recently tested and is breaking out to the upside
I have labelled the chart patterns - I am unsure however if the 'Symmetrical triangles' are really that or Rising Wedges, so take that with a grain of salt

Analyzing Australian Securities Exchange Stock's Trend.According to The Australian Bureau of Statistics' data, there are two scenarios for the stock of ASX Limited's trend. The first scenario is more recommended than the second one, which depends on the negative news about the change in the employment rate, and it is more likely to make the stock fall to break the first support line 84.22 and reach the second support line 83.65, then the third support line 82.42 on the other hand, there is positive news about the decrease in the unemployment rate by 0.5% than the expected rate, which may cause the stock to rise to breach the first resistance line 84.74 to reach the second resistance line 85.38 and then the third resistance line 86.43

ASX A possibility?? An idea for ASX
if price continues in the fashion it has shown
ASX is the Australian market
I am not currently in any positions on ASX
This is a monthly timeframe, timestamp!

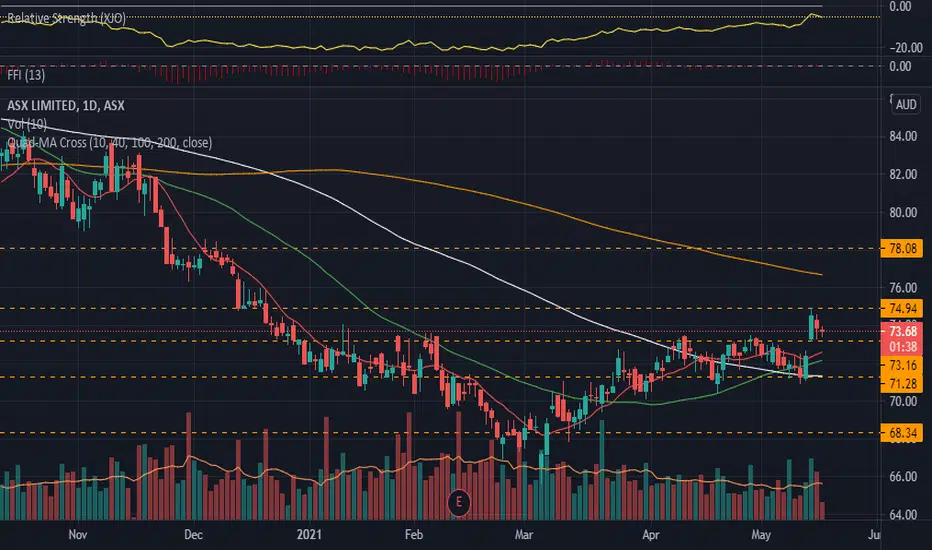
ASX.ASX_Range Breakout and Retrace Trade_LongENTRY: 73.62
SL: 71.29
TP: 76.69
- ADX<20
- RSI>50, RSI<70
- Daily RS -ve
- Daily FFI +ve
- Daily MACD +ve
- Weekly RS -ve
- Weekly FFI +ve
- Weekly MACD +ve
- MA aligned
- Breakout with good volume on 14 May 2021 and retraced with low volume
ASX; bearish retestShooting star under a key trend line and macro fib. Didn't hold weekly key level.


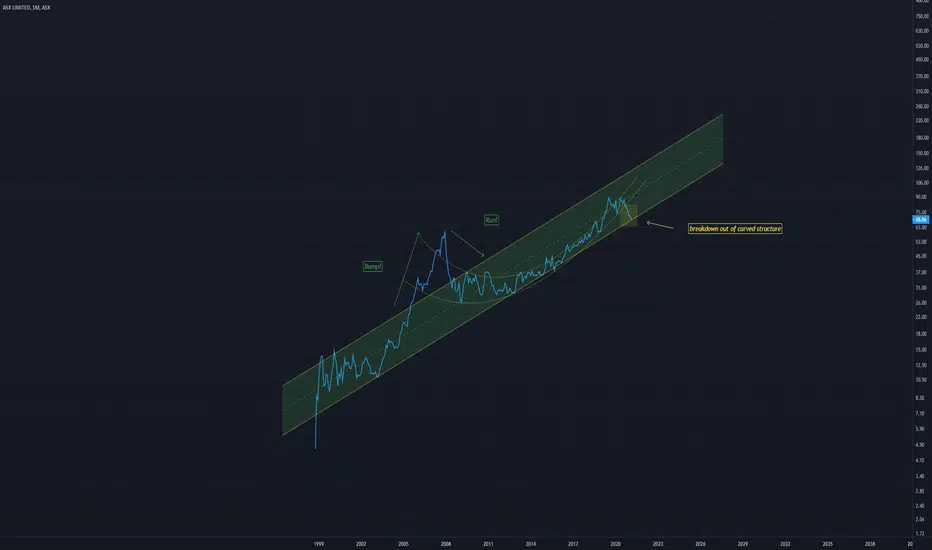
ASX Curved structure breakdownPrice has broken down from this curved structure
Although it is still within a larger channel
I feel this channel wont hold and a further breakdown will ensue
We will see