Quick Short Idea $SPYMarkets are looking weak and can go down.
Trade Plan:
Short Entry - 695.00
Target - 693.50
Stop Loss - 695.75
Key stats
About SPDR S&P 500 ETF
Home page
Inception date
Oct 13, 2014
Replication method
Physical
Dividend treatment
Distributes
Income tax type
Capital Gains
Primary advisor
State Street Global Advisors, Australia, Ltd.
Distributor
ALPS Distributors, Inc.
Identifiers
2
ISIN AU000000SPY3
SPY Fund Summary
The investment seeks to provide investment results that, before expenses, generally correspond to the price and yield performance of the S&P 500 Index. The Trust seeks to achieve its investment objective by holding a portfolio of the common stocks that are included in the Index), with the weight of each stock in the Portfolio substantially corresponding to the weight of such stock in the Index.
The investment seeks to provide investment results that, before expenses, generally correspond to the price and yield performance of the S&P 500 Index. The Trust seeks to achieve its investment objective by holding a portfolio of the common stocks that are included in the Index), with the weight of each stock in the Portfolio substantially corresponding to the weight of such stock in the Index.
Related funds
Classification

02-06 SPY Forecast and Perspective NOW!!! With Gamma Additives**RESISTANCE (Above):**
- U5: $684.32 (HVN, gamma, top target)
- ORBH: $683.69 (HVN, gamma cluster)
- PM High: $682.82 (HVN, premarket confirm)
- U4: $681.75 (HVN, strong band)
- **⚡ U3: $679.63 (Gamma Node)**
- **⚡ U2: $678.96**
- **⚡ ORBL: $678.76 (LVN, cluster edge)**
- **⚡ U1: $678.32**
**ANCHO

$SPY 15m - Fibonacci Confluence at Decision Point - TRADE SETUPAMEX:SPY 15m - Fibonacci Confluence at Decision Point
Price sitting at 0.618 retracement ($689.04) after rejecting descending trendline resistance.
Structure:
- Swing low: $684.14 (1.0 fib)
- Current: $689.44 (golden pocket)
- Trendline resistance: ~$690 declining
- Bearish target: $676.16 (1.618

SPY. Key Decision Zone After Strong Bounce for Feb 9-13What I’m Watching
SPY put in a solid recovery after selling off earlier in the week, but price is now pushing into a zone where things usually slow down. The bounce was clean, momentum improved, and buyers clearly stepped in — but we’re no longer in “easy upside” territory. From here, it’s about wh

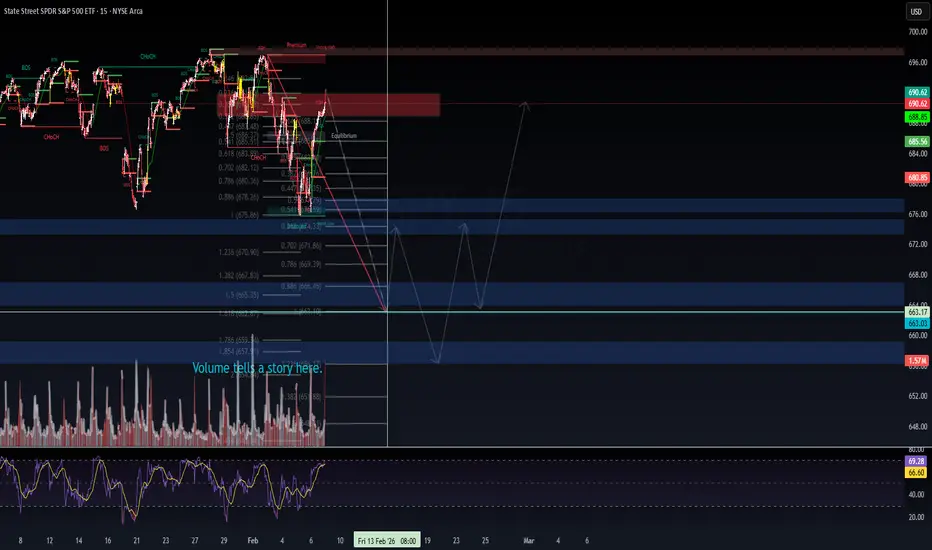
SPY Constructive Bear Thesis | Macro + SMC + Catalyst Alignment SPY Constructive Bear Thesis | Macro + SMC + Catalyst Alignment | Feb 2026
Structure
Price swept the previous swing high, printed a Change of Character (CHoCH), and is now sitting in premium at $690.62. Classic Smart Money Concepts distribution setup on the 15-minute timeframe.
The projected path f
most signs still pointing lowerWe broke the 100 daily and the 18 weekly ma's today. It still looks like 6500 is possible but it may or may not not be a straight line. Gold and silver may get a bid soon. BTC is at monthly target but it may continue to drop a bit more first. Oil still looks good. VIX closed above 20 and probably te

What happened here?This looks very odd...any explanations?
The price seems to have touched the low back in 2008? Must be a glitch...

SPY CONSTRUCTIVE BEAR THESIS | FEB 2026SPY CONSTRUCTIVE BEAR THESIS | FEB 2026
STRUCTURE:
Price tagged 1.0 Fib extension (697.84) — full retracement of the 2024-2025 impulse. CHoCH signals clustering at highs within Premium zone per SMC framework. Classic distribution characteristics forming.
TARGET ZONE: 627-631 (0.702 Fib / Equilibri

SPY Weekly Outlook – Week 5 of 2026 (Feb 02–06)SPY Weekly Outlook – Week 5 of 2026 (Feb 02–06)
Weekly Recap
Last week, SPY respected our bullish framework perfectly, resulting in a clean and profitable execution. The market opened with a gap up and reached Bullish Target 1, where we took partial profits and reduced exposure.
We then carried

SPY: The chart no one wants to talk about.The chart no one wants to talk about.
AMEX:SPY just completed a textbook 5-wave impulse from the March 2020 lows.
Wave (5) tagged the 2.0 Fibonacci extension near $720 — and we're now rolling over at $690, below channel resistance.
If you know your Elliott Wave theory, you know what comes next.
Co

See all ideas
Summarizing what the indicators are suggesting.
Oscillators
Neutral
SellBuy
Strong sellStrong buy
Strong sellSellNeutralBuyStrong buy
Oscillators
Neutral
SellBuy
Strong sellStrong buy
Strong sellSellNeutralBuyStrong buy
Summary
Neutral
SellBuy
Strong sellStrong buy
Strong sellSellNeutralBuyStrong buy
Summary
Neutral
SellBuy
Strong sellStrong buy
Strong sellSellNeutralBuyStrong buy
Summary
Neutral
SellBuy
Strong sellStrong buy
Strong sellSellNeutralBuyStrong buy
Moving Averages
Neutral
SellBuy
Strong sellStrong buy
Strong sellSellNeutralBuyStrong buy
Moving Averages
Neutral
SellBuy
Strong sellStrong buy
Strong sellSellNeutralBuyStrong buy
Displays a symbol's price movements over previous years to identify recurring trends.
Frequently Asked Questions
An exchange-traded fund (ETF) is a collection of assets (stocks, bonds, commodities, etc.) that track an underlying index and can be bought on an exchange like individual stocks.
SPY trades at 974.00 AUD today, its price hasn't changed in the past 24 hours. Track more dynamics on SPY price chart.
SPY net asset value is 1,002.92 today — it's fallen 2.47% over the past month. NAV represents the total value of the fund's assets less liabilities and serves as a gauge of the fund's performance.
SPY assets under management is 26.24 K AUD. AUM is an important metric as it reflects the fund's size and can serve as a gauge of how successful the fund is in attracting investors, which, in its turn, can influence decision-making.
SPY price has fallen by −5.79% over the last month, and its yearly performance shows a 1.21% increase. See more dynamics on SPY price chart.
NAV returns, another gauge of an ETF dynamics, have risen by −2.47% over the last month, have fallen by −2.47% over the last month, showed a −2.40% decrease in three-month performance and has increased by 4.16% in a year.
NAV returns, another gauge of an ETF dynamics, have risen by −2.47% over the last month, have fallen by −2.47% over the last month, showed a −2.40% decrease in three-month performance and has increased by 4.16% in a year.
SPY fund flows account for −1.08 T AUD (1 year). Many traders use this metric to get insight into investors' sentiment and evaluate whether it's time to buy or sell the fund.
Since ETFs work like an individual stock, they can be bought and sold on exchanges (e.g. NASDAQ, NYSE, EURONEXT). As it happens with stocks, you need to select a brokerage to access trading. Explore our list of available brokers to find the one to help execute your strategies. Don't forget to do your research before getting to trading. Explore ETFs metrics in our ETF screener to find a reliable opportunity.
SPY expense ratio is 0.09%. It's an important metric for helping traders understand the fund's operating costs relative to assets and how expensive it would be to hold the fund.
No, SPY isn't leveraged, meaning it doesn't use borrowings or financial derivatives to magnify the performance of the underlying assets or index it follows.
In some ways, ETFs are safe investments, but in a broader sense, they're not safer than any other asset, so it's crucial to analyze a fund before investing. But if your research gives a vague answer, you can always refer to technical analysis.
Today, SPY technical analysis shows the strong sell rating and its 1-week rating is neutral. Since market conditions are prone to changes, it's worth looking a bit further into the future — according to the 1-month rating SPY shows the buy signal. See more of SPY technicals for a more comprehensive analysis.
Today, SPY technical analysis shows the strong sell rating and its 1-week rating is neutral. Since market conditions are prone to changes, it's worth looking a bit further into the future — according to the 1-month rating SPY shows the buy signal. See more of SPY technicals for a more comprehensive analysis.
Yes, SPY pays dividends to its holders with the dividend yield of 1.11%.
SPY trades at a premium (0.54%).
Premium/discount to NAV expresses the difference between the ETF’s price and its NAV value. A positive percentage indicates a premium, meaning the ETF trades at a higher price than the calculated NAV. Conversely, a negative percentage indicates a discount, suggesting the ETF trades at a lower price than NAV.
Premium/discount to NAV expresses the difference between the ETF’s price and its NAV value. A positive percentage indicates a premium, meaning the ETF trades at a higher price than the calculated NAV. Conversely, a negative percentage indicates a discount, suggesting the ETF trades at a lower price than NAV.
SPY shares are issued by State Street Corp.
SPY follows the S&P 500. ETFs usually track some benchmark seeking to replicate its performance and guide asset selection and objectives.
The fund started trading on Oct 13, 2014.
The fund's management style is passive, meaning it's aiming to replicate the performance of the underlying index by holding assets in the same proportions as the index. The goal is to match the index's returns.