All Conditions for a Short Are in PlaceIt’s good to have the weekend to think everything through and make a decision calmly.
Shorting a rising market is usually a bad idea — I’ve tried before, and it’s only natural that my stop losses got hit.
On Friday, I was watching the market. Without going deep into the political background — I’m sure you’ve read the same things — I’ll sum it up in one word: negative.
To this, we can add overall overheating.
The way the market sold off that day doesn’t look like the end of the decline — although, of course, anything can happen. I believe that right now is the perfect moment to open a short position on the S&P 500 at the market open .
The stop will be wide — not pleasant, of course, if it gets hit again — but I feel that all conditions have aligned for a short setup.
My target is 640 — a strong resistance level, still about 2% away. I’ll be watching closely around that zone.
A move below 640 will open the path toward 595–605 , where I plan to start closing positions — possibly even earlier, depending on how price reacts to that key 640 level.
There are too many long positions in the market now; so far, we’ve only seen margin positions being liquidated. I think Monday might start with closing out long positions.
Either way, we’ll see at the open — but for now, I’ve outlined my plan and I intend to stick to it.
SPY trade ideas

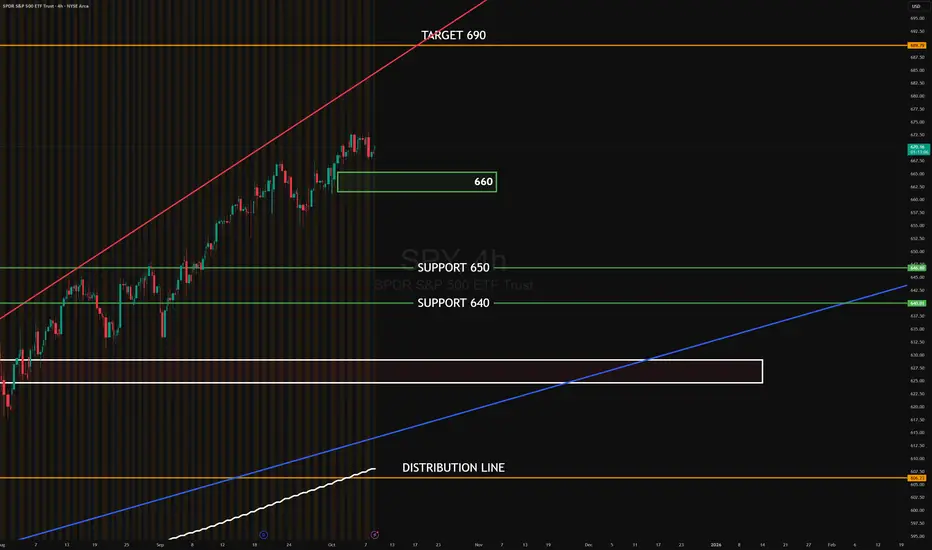
SPY OCT 2025SPY 4H — After the latest push, price is pausing below recent highs. Buyers keep absorbing dips into 660, while sellers are distributing near 675–680. Above 660, the structure still favors continuation toward the upper channel.
Target to the upside: 690
Target to the downside: 660 first; if lost, 650 → 640
#SPY #globaltrade #investment #investing #stockmarket #wealth #realestate #markets #economy #finance #money #forex #trading #price #business #currency #blockchain #crypto #cryptocurrency #airdrop #btc #ethereum #ico #altcoin #cryptonews #Bitcoin #ipo
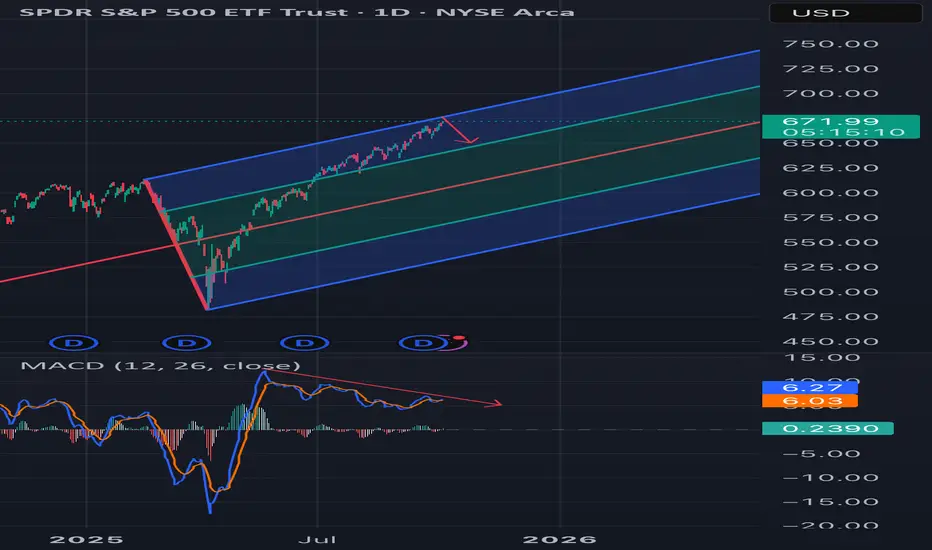
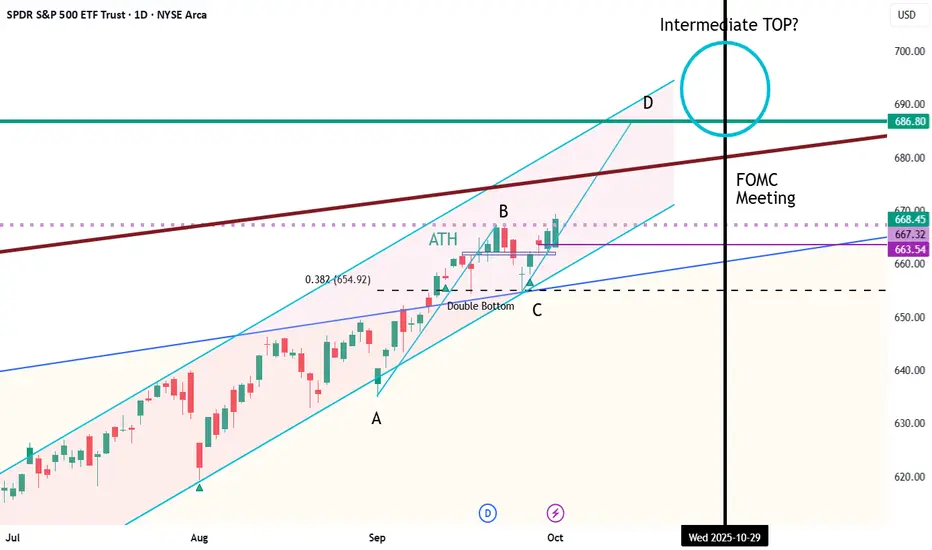
Follow up to my previous post on SPY potential support levelsSPY Technical Analysis — Elliott Wave & Fibonacci Structure
After failing to hold at two key support levels highlighted in the previous update, SPY finally found a temporary bounce at the 0.50 Fibonacci retracement level around 646.84. This aligns with a common Wave 4 retracement bounce zone after an aggressive Wave 3 move down.
1. Wave Structure
The current bounce appears corrective in nature and is likely forming Wave 4 (up) within the broader downtrend.
I do not view this bounce as a full reversal yet — price action still favors a final Wave 5 leg lower.
Ideally, Wave 5 could form a double bottom near the 0.50 Fib level (646.84), providing a potential base-building zone.
2. Key Levels to Watch
🟡 0.50 Fib (646.84) — current bounce zone; potential double-bottom target.
0.618 Fib (640.39) — next critical support if 0.50 fails. A break here may prolong the corrective structure.
⚫ 0.786 Fib (631.21) — deeper retracement zone. There’s a supply zone just above this level (see grey box on chart), which may offer initial demand or reaction.
3.Scenario Planning
If 646.84 holds and price consolidates, a short-term bullish structure could form, but any upside is likely corrective.
If 646.84 fails, the 0.618 level becomes pivotal. Breaking this area may push price into the grey supply zone near 0.786.
My preferred setup in this scenario would be to wait for a clean reaction at the grey zone:
Look for a bounce ➝ retrace ➝ breakout above the bounce high to signal a potential long entry.
Stop-loss placement would likely be just below 0.786 Fib (631.21) to reduce downside exposure.
4. Macro Consideration
Headline risk remains — any unexpected bullish catalyst (e.g., political or macroeconomic news, such as statements from Donald Trump) could accelerate or truncate the Wave 4–5 structure. A short squeeze from oversold levels is also possible but would need confirmation.

$SPY / $SPX Scenarios — Thursday, Oct 9, 2025🔮 AMEX:SPY / SP:SPX Scenarios — Thursday, Oct 9, 2025 🔮
🌍 Market-Moving Headlines
🚩 Powell spotlight: The Fed Chair’s morning remarks set the tone for risk sentiment — traders watching for policy bias hints.
💬 Fed overload: Bowman, Kashkari, Barr, and Daly dominate the docket — expect intraday rate-path chatter.
📉 Shutdown shadows: Jobless Claims* and Inventories* may face data delays; market liquidity remains headline-driven.
💻 Macro rotation: AMEX:SPY trades tightly to yield moves; tech leadership faces cross-currents as real rates stay firm.
📊 Key Data & Events (ET)
⏰ 🚩 8:30 AM — Fed Chair Jerome Powell opening remarks
⏰ 🚩 8:30 AM — Initial Jobless Claims (Oct 4) subject to delay
⏰ 8:35 AM — Michelle Bowman (Fed Vice Chair for Supervision) welcoming remarks
⏰ 8:45 AM — Michelle Bowman speech
⏰ 10:00 AM — Wholesale Inventories (Aug)* subject to delay
⏰ 12:45 PM — Neel Kashkari + Michael Barr discussion
⏰ 3:45 PM — Michelle Bowman speech
⏰ 4:10 PM — Mary Daly (SF Fed) speech
⏰ 9:40 PM — Mary Daly evening remarks
⚠️ Disclaimer: Educational/informational only — not financial advice.
📌 #trading #stockmarket #SPY #SPX #Fed #Powell #Bowman #Kashkari #Barr #Daly #joblessclaims #bonds #Dollar #shutdown #economy #megacaps
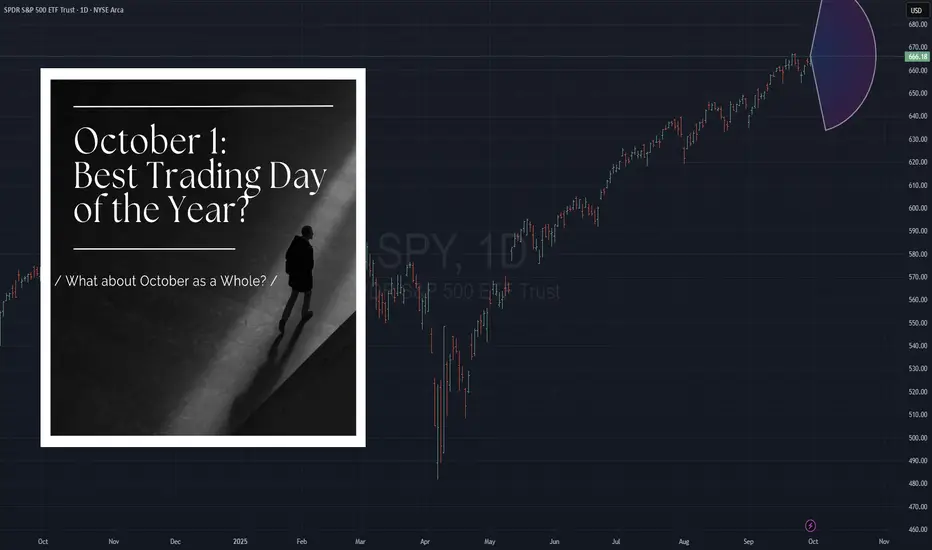
October 1st. Best Trading Day of the Year?NOTE: This is a post on Mindset and emotion. It is NOT a Trade idea or strategy designed to make you money. If anything, I’m posting this to help you preserve your capital, energy and will so you can execute your own trading system with calm, patience and confidence.
I was told yesterday that October 1 is historically a great trading day.
What does that mean?
That we buy? That we sell?
Or as traders, do we simply lean into the expected volatility in both directions, regardless of how it ends?
Is it really about direction or is it more about volatility itself?
And then I wondered, what about October as a whole?
We’ve just come through a really strong September. That alone puts expectations on edge. Do we continue higher? Or do we fall off in line with October’s reputation?
Because if you ask most people, October is “that scary crash month.”
1929. 1987. 2008.
Big events that seared into collective memory.
But the data tells a different story.
Seasonality studies show October has often been one of the stronger months for the S&P 500.
Yes, it tends to be more volatile with more big moves up and down.
But zoom out and October often finishes in positive territory. Many times it has even marked the end of declines and the start of new rallies.
So why does the “October crash” narrative persist?
Because our brains are wired to latch onto the dramatic, painful events more than steady gains. We remember the sting of a crash, not the quiet consistency of recovery.
That’s the mindset piece here.
Markets are not just numbers, they’re stories. The ones we tell ourselves, and the ones that echo across generations of traders.
If you believe October is dangerous, you’ll find evidence everywhere to confirm it.
If you believe October is an opportunity, you’ll see that too.
What matters is not October itself.
It’s your relationship with volatility and how you meet uncertainty. Both in the markets and in your own mental state.
Your ability to hold perspective in a month where the swings may be larger, the headlines louder and the ghosts of market history come knocking.
SPY Buyers In Panic! SELL!
My dear subscribers,
My technical analysis for SPY is below:
The price is coiling around a solid key level - 669.20
Bias - Bearish
Technical Indicators: Pivot Points Low anticipates a potential price reversal.
Super trend shows a clear sell, giving a perfect indicators' convergence.
Goal - 663.47
About Used Indicators:
By the very nature of the supertrend indicator, it offers firm support and resistance levels for traders to enter and exit trades. Additionally, it also provides signals for setting stop losses
Disclosure: I am part of Trade Nation's Influencer program and receive a monthly fee for using their TradingView charts in my analysis.
———————————
WISH YOU ALL LUCK

SPY – Liquidity Flow & Macro Context🧭 SPY – Liquidity Flow & Macro Context
Bias: Cautiously Bullish | VolanX DSS
SPY continues to respect the ascending channel — structure intact.
Each pullback toward the midline (660–654) offers liquidity-based entries within a healthy bullish trend.
Volume Context:
Rising volume confirms participation during expansions, while pullbacks show lighter volume → suggesting absorption, not reversal.
Macro Alignment:
Fed remains dovish 🕊️ → easing bias supports risk assets
U.S. government shutdown adds noise but hasn’t broken liquidity confidence
Rate-cut expectations remain elevated
Global rotation favoring Tech + Pharma → underpins SPY strength
Technical Map:
Support: 660 / 654
Pivot Zone: 667–675
Target 1: 688.5
Target 2: 701.5 (extended Fibonacci confluence)
Strategy:
Wait for controlled pullback into 660–654 liquidity zone → monitor volume fade & RSI reset → re-enter for next expansion leg.
💡 Any healthy pullback = opportunity, not exit.
#SPY #VolanX #Liquidity #SMC #Macro #BuyTheDip #Fed #TradingView #VolumeProfile

SPY is approaching resistance. major yearly fib projection. Something to watch in coming weeks. Could pump into this in the coming weeks. I wont short, but it is a huge area of interest.

Spy idea This disgrace will not go much higher 675 680 at most near resistance , huge Macd divergence . no economic data for the next two weeks . Market is going up on nothing rate cuts priced in already . I expect the market to correct soon and very quickly . Not an advice
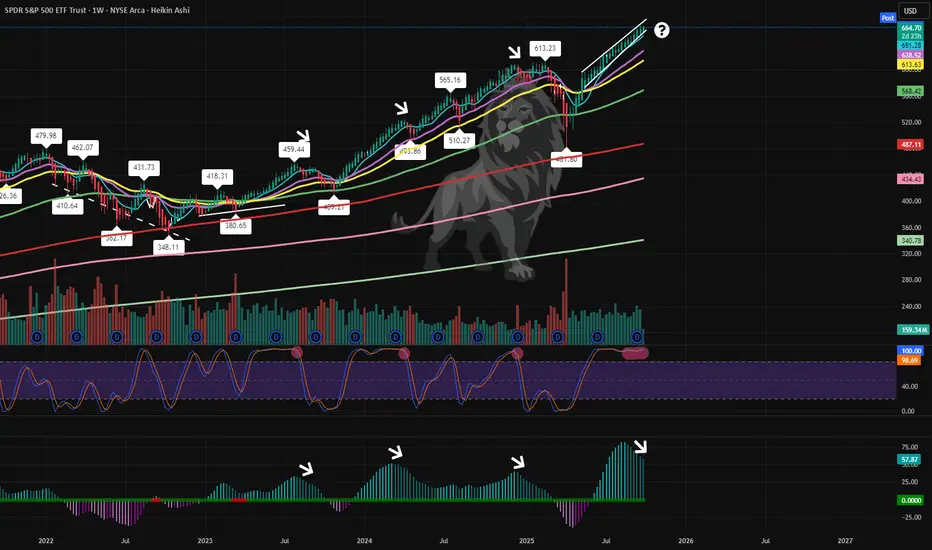
SPY weekly divergenceCheck out the chart on SPY weekly. As you can see, TTM has started to show that volatility has started to come out of the move (light cyan to dark (lower indicator)) all while SPY has continued to push higher. All times before this has signaled local weakness and a subsequent pullback ahead.
Waiting for the Stock Market to FallI’m expecting a decline in the stock market. Long positions are relevant only in the commodity sector — no stock longs!
At the moment, I’m not entering any positions. I’m watching the market, monitoring major players (who, by the way, are closing their positions and moving into cash), and keeping an eye on the news flow.
I believe that later this year or early next year, an opportunity to open a short position will appear. For now, I’m just observing. There have already been a few attempts to enter the market, but stop-losses got triggered. Thanks to stop-losses for existing — they prevent blowing up the account.
Right now, there’s no rush. It’s all about waiting for the right trade. Meanwhile, I’m staying long in metals.
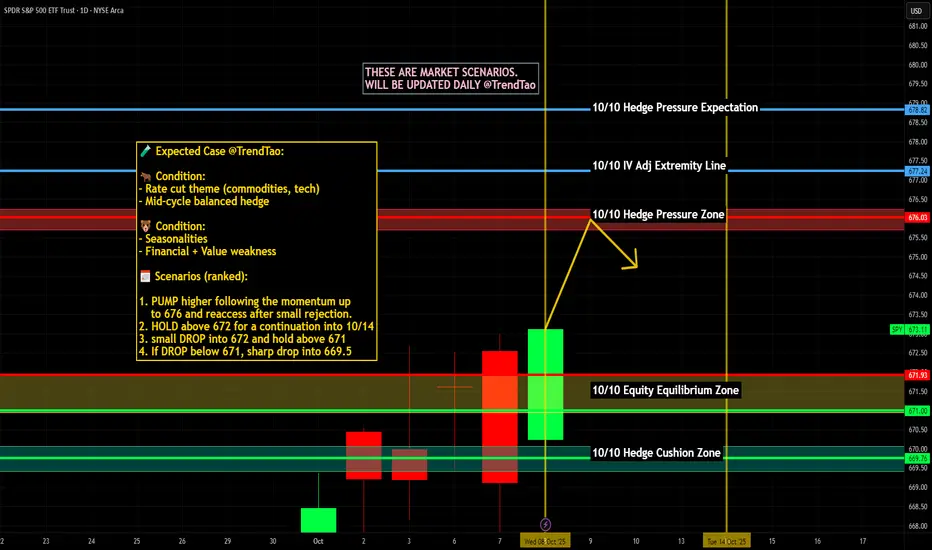
$SPY / $SPX Scenarios — Week of Oct 6 → Oct 10, 2025 🔮 AMEX:SPY / SP:SPX Scenarios — Week of Oct 6 → Oct 10, 2025 🔮
🌍 Market-Moving Headlines
🚩 Shutdown overhang: Some data (Trade, Jobless Claims, Budget) remain at risk of delay; markets lean on Fed tone instead.
📉 Fed-heavy week: Nearly every regional president and governor is on deck — tone from Powell (Thu) + FOMC Minutes (Wed) = the core catalyst.
💻 Earnings prep: Q3 pre-announcements begin — NASDAQ:AAPL NASDAQ:MSFT NASDAQ:NVDA remain leadership barometers.
💵 Rates & positioning: 10Y yields and USD remain key drivers into mid-month CPI/PPI stretch.
📊 Key Data & Events (ET)
Mon 10/6
⏰ 5:00 PM — Jeff Schmid (Kansas City Fed) speech
Tue 10/7
⏰ 🚩 8:30 AM — U.S. Trade Deficit (Aug)
⏰ 3:00 PM — Consumer Credit (Aug)
🗣️ Fed Speakers — Bostic (10:00), Bowman (10:05, 8:35, 8:45), Miran (10:45, 4:05), Kashkari (11:30)
Wed 10/8
⏰ 🚩 2:00 PM — FOMC Minutes (September Meeting)
🗣️ Fed Speakers — Musalem (9:20), Barr (9:30, 5:45), Kashkari (3:15), Goolsbee (7:15)
Thu 10/9
⏰ 🚩 8:30 AM — Initial Jobless Claims (Oct 4)
⏰ 🚩 8:30 AM — Fed Chair Powell remarks (opening keynote)
⏰ 10:00 AM — Wholesale Inventories (Aug)
🗣️ Fed Speakers — Bowman (8:35, 8:45, 3:45), Kashkari + Barr (12:45), Daly (4:10, 9:40 PM)
Fri 10/10
⏰ 🚩 10:00 AM — Consumer Sentiment (Prelim, Oct)
⏰ 2:00 PM — U.S. Federal Budget (Sept)
🗣️ Fed Speakers — Goolsbee (9:45)
⚠️ Disclaimer: Educational/informational only — not financial advice.
📌 #trading #stockmarket #SPY #SPX #Powell #FOMC #Fed #joblessclaims #tradebalance #consumerconfidence #shutdown #bonds #Dollar #megacaps #economy
Stock Market Forecast | TSLA NVDA AAPL AMZN META MSFTStock Market Forecast | CME_MINI:NQ1! SP:SPX NASDAQ:NDX CME_MINI:ES1!
Mag 7 | TSLA NVDA AAPL AMZN META MSFT GOOGL

$SPY Sectors: Shutdown PeriodA shutdown doesn’t hit all S&P 500 sectors equally. Some feel the impact right away through halted government spending or disrupted data, while others react more indirectly. Reality check at this point is necessary especially when the event of this scale creates evident misbalances. Therefore I'd like to document how the interplay of money flow across sectors might change at least for the period.
AMEX:SPY Sectors Impact:
AMEX:XLF Financials
Financials rely heavily on government economic data (Jobs Report, CPI, GDP) to gauge loan demand, credit risk, and Fed direction. With the Fed “flying blind,” bank lending becomes more cautious. Market volatility also reduces IPOs and M&A activity, hurting investment banks.
⬩Driver: Fed uncertainty + weaker deal-making environment.
AMEX:XLK Technology
Big Tech is less exposed to direct government spending freezes but relies on consumer confidence and capital markets. If uncertainty drives a pullback in corporate IT spending, cloud/software firms slow down. On the upside, tech is a defensive haven when traditional sectors (like industrials or energy) face disruption.
⬩Driver: Consumer/corporate demand resilience vs. risk-off rotation.
AMEX:XLE Energy
Energy projects (infrastructure, pipelines, renewables) often require federal permits and data from agencies like the EIA (Energy Information Administration). Delays stall exploration, development, and reporting. Additionally, frozen infrastructure funds cut into fuel demand from construction.
⬩Driver: Permitting delays + construction slowdown = weaker demand.
AMEX:XLV Healthcare
Healthcare is relatively defensive—people still need services. But disruption at the FDA and NIH means drug approvals, trials, and public health programs are delayed. Medicare/Medicaid payment systems could face administrative snags.
⬩Driver: Resilient demand but policy bottlenecks.
AMEX:XLP Consumer Staples
Grocery, beverages, and household goods usually benefit when uncertainty rises, as consumers shift toward essentials. SNAP (food assistance) delays could weigh on lower-income demand if prolonged.
⬩Driver: Defensive flows into necessities.
AMEX:XLY Consumer Discretionary
Discretionary spending suffers most when consumer confidence dips. Federal worker furloughs reduce near-term demand for retail, travel, and leisure. Auto sales also slow since they’re sensitive to credit and consumer sentiment.
⬩Driver: Weaker consumer confidence + furloughs.
AMEX:XLU Utilities
Utilities are defensive and less exposed to federal data flow. If Treasury yields dip on uncertainty, utilities benefit from their bond-proxy status. Regulatory delays on projects could be a small drag.
⬩Driver: Defensive positioning + rate sensitivity.
AMEX:XLI Industrials
Infrastructure and defense are big demand drivers. With $18 billion in infrastructure projects frozen, construction, machinery, and engineering firms take a hit. Aerospace/defense may see delayed contracts and funding interruptions.
⬩Driver: Government contract freezes + halted projects.
AMEX:XLC Communication Services
Ad-driven platforms (Meta, Alphabet) face weaker consumer spending and sentiment. Telecoms see little direct effect. Longer-term, uncertainty may reduce advertising budgets, hurting growth.
⬩Driver: Advertising sensitivity to sentiment.
AMEX:XLB Materials
Materials are highly linked to infrastructure and construction demand. Frozen federal projects reduce demand for cement, steel, and aggregates. Chemical companies may also face regulatory/permitting delays.
⬩Driver: Halted infrastructure = weaker demand.
AMEX:XLRE Real Estate
Higher uncertainty + Fed rate blindness weigh on commercial real estate and REITs. Infrastructure freezes reduce demand for new building projects. On the flip side, lower Treasury yields (if the market prices recession risks) could support REITs as bond proxies.
⬩Driver: Rate sensitivity vs. demand freeze.
These in turn trigger some other processes, depending on duration of government shutdown.

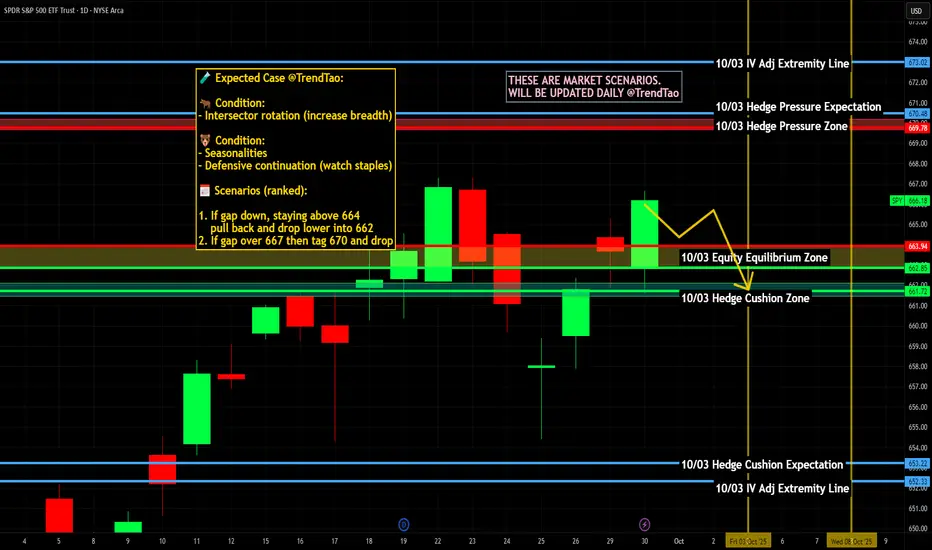
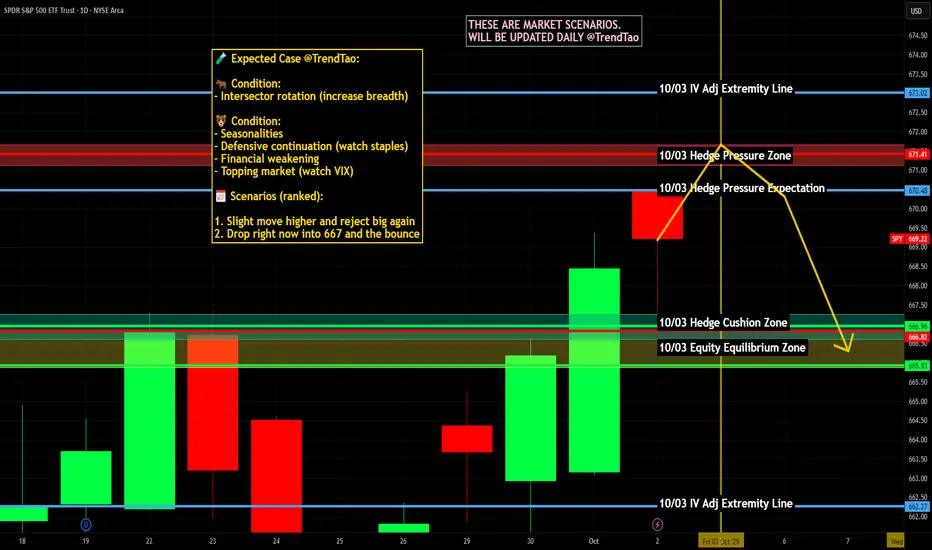
$SPY / $SPX Scenarios — Friday, Oct 3, 2025🔮 AMEX:SPY / SP:SPX Scenarios — Friday, Oct 3, 2025 🔮
🌍 Market-Moving Headlines
🚩 NFP risk — but delayed: September Employment Report, unemployment rate, and wages won’t publish if shutdown continues. Markets will run on positioning + PMIs instead.
📉 Labor vacuum: Absence of NFP could amplify volatility as traders trade on speculation.
💬 Fed-heavy Friday: A parade of Fed speakers guides tone into weekend positioning.
📊 Key Data & Events (ET)
⏰ 6:05 AM — John Williams (NY Fed) speech
⏰ 8:30 AM — Austan Goolsbee (Chicago Fed) TV appearance
🚩 At Risk of Delay (shutdown):
• 8:30 AM — Employment Report (Sep): Nonfarm Payrolls, Unemployment Rate, Avg. Hourly Earnings
✅ Still Publishing:
⏰ 9:45 AM — S&P Final Services PMI (Sep)
⏰ 10:00 AM — ISM Services (Sep)
🗣️ Fed Speakers:
• 9:30 AM — Stephen Miran (Fed Gov, TV)
• 1:30 PM — Lorie Logan (Dallas Fed)
• 1:40 PM — Philip Jefferson (Fed Vice Chair)
• 3:30 PM — Stephen Miran (Fed Gov, TV)
⚠️ Disclaimer: Educational/informational only — not financial advice.
📌 #trading #stockmarket #SPY #SPX #NFP #jobs #Fed #Powell #shutdown #ISM #PMI #bonds #Dollar #economy
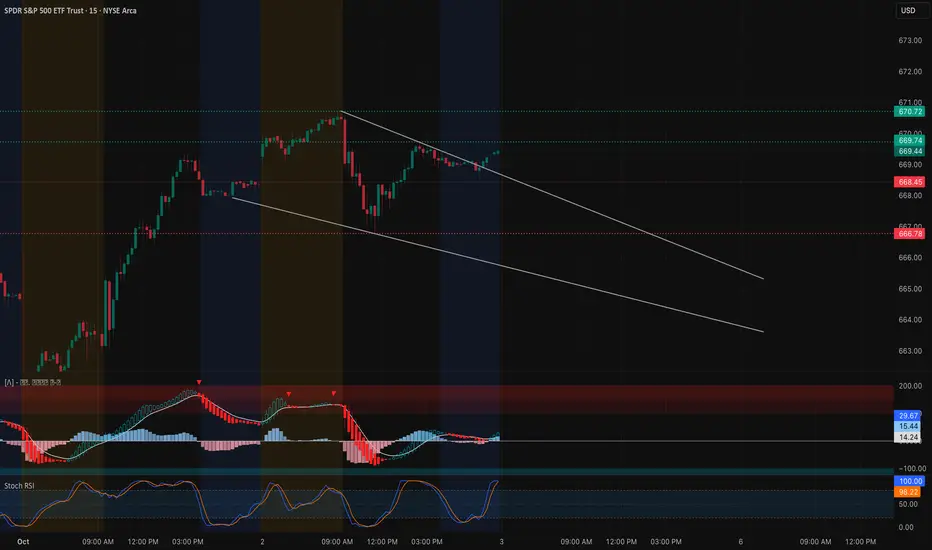
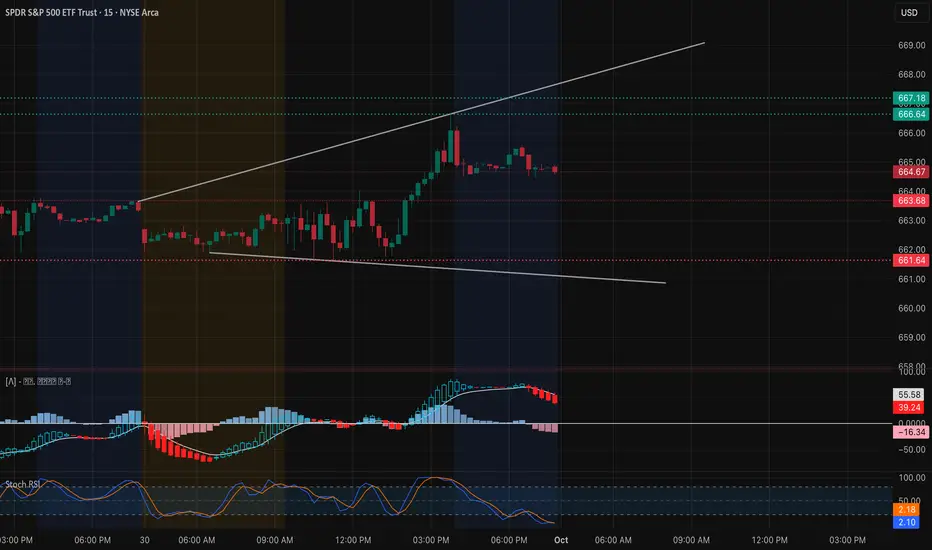
SPY Coiling Before the Move – Gamma Walls Set the Stage - Oct3 Intraday Technical Outlook (15m Chart)
SPY closed near $669.44, consolidating inside a falling wedge pattern. On the 15-minute chart, price is testing downtrend resistance after holding support earlier in the session:
* MACD: Curling back upward from bearish territory, hinting at momentum recovery.
* Stoch RSI: Back at extreme overbought, suggesting buyers are active but may face short-term exhaustion.
* Key Levels: Support sits at $668–666.7, with further downside pressure toward $663.2. Resistance sits at $670.7–671.0, the wedge top and breakout zone.
Intraday takeaway: A breakout above $671 could ignite upside momentum toward $673+. Failure to reclaim $670 risks a fade back toward $666–663.
Options Sentiment & GEX Outlook (1H Chart)
Options flow shows dealers are heavily positioned around key gamma levels:
* Gamma Walls:
* $670–673: Major call wall cluster and highest positive GEX — key resistance ceiling.
* $668: Gamma pivot level where dealers may defend.
* $663–660: Heavy put wall zone that can act as a downside magnet if $668 breaks.
* Implications:
* Holding above $668 keeps SPY pinned toward the $670–673 gamma wall.
* Losing $668 could trigger dealer hedging flows to drag price toward $663–660.
* Volatility Context: IVR at 15.7 is very low, while options skew shows 61.7% puts — indicating hedging remains defensive. Cheap premiums may favor straight directional calls/puts instead of spreads.
My Thoughts & Recommendation
For Oct 3 trading, SPY is tightening for a breakout:
* Intraday (scalping/trading): Watch $670–671 closely. A breakout here favors longs into $673+. If SPY rejects at $671 and breaks $668, expect a pullback toward $663.
* Options trading (swing/0DTE): Calls only make sense if SPY clears $671 with conviction. If SPY fails at $670 and breaks $668, puts toward $663–660 offer better risk/reward.
Bias heading into Oct 3: Neutral with breakout watch — $668 support vs $671 resistance will decide.
Disclaimer:
This analysis is for educational purposes only and does not constitute financial advice. Always do your own research and manage risk before trading.
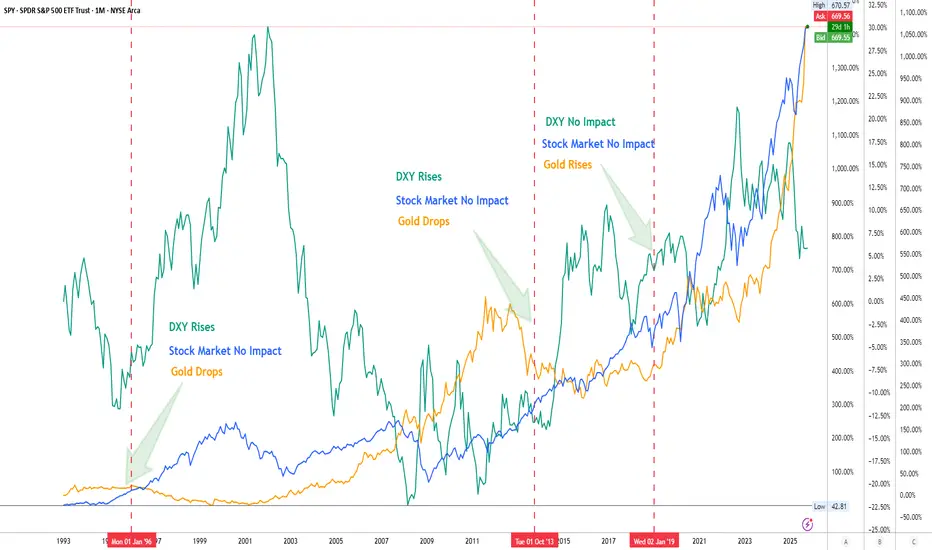
US Gov Shutdowns History: The Real ImpactLooking back at history:
-When DXY tend to rise with or after shutdowns
-Gold often drops while the stock market shows little impact.
Across 1996, 2013 & 2019 shutdowns, SP500 kept climbing, proving markets are more resilient than the headlines suggest.
Takeaway: Shutdowns = volatility noise. Long-term trend = earnings, liquidity, Fed policy.
#SPX #DXY #Gold #Trading #Markets
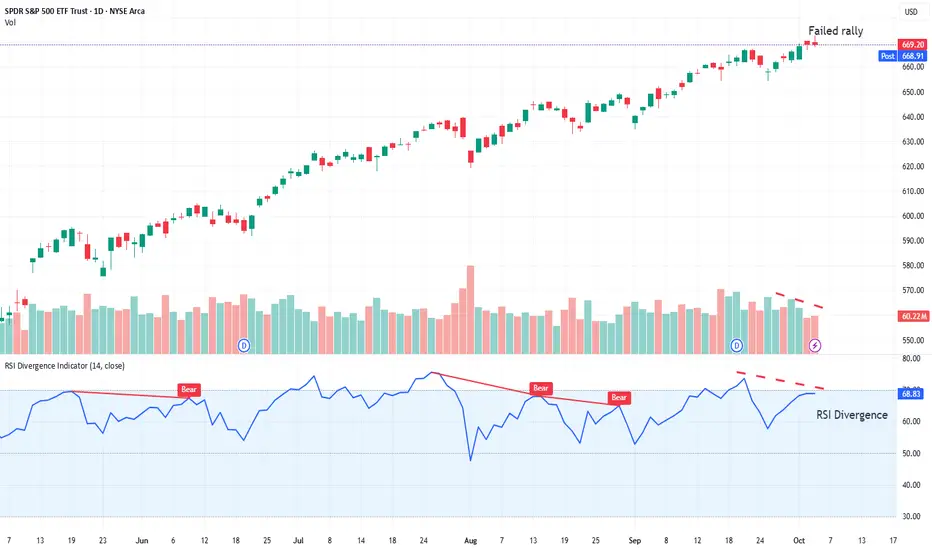
Bulls less confident, Weak setup for next weekRSI divergence with new highs. QQQ looks even worse. This is a weak setup for next week. Looks for a sell-off, unless some miracle happens.
SPY at a Critical Level! Key Trade Setups for Oct. 1 Market Structure (15m & 1h)
SPY closed around 664.6, holding inside an ascending channel. Price made a strong push into the 666–667 zone before cooling off. On the 15m chart, MACD is rolling down and Stoch RSI is oversold, suggesting near-term weakness, but the 1h structure is still bullish as long as 658–660 trendline support holds.
Support & Resistance Zones
* Resistance: 667 → 668 (Gamma walls + overhead supply)
* Support: 663–664, then 662, with stronger defense at 660–658
GEX / Options Sentiment
* Highest positive GEX magnet: 665
* Call walls: 667–668 (heavy cluster, tough to crack)
* Put walls: 662, 660 (strong downside lines)
* Options flow still favors puts (63%), showing downside hedging is dominant.
My Thoughts
SPY is coiling in a tight pocket:
* Bullish case: Holding 663–664 could bring another test into 667–668. A breakout over 668 with volume would open the door to 670+.
* Bearish case: Losing 663 turns momentum back to sellers, targeting 662 → 660, with 658 trendline as last defense.
Trade Setups for Oct. 1
* Bullish scalp: Long off 663–664 support, target 667–668, stop below 661.5.
* Bearish scalp: Short rejection at 667–668, target 662–660, stop above 669.
* Swing watch: Clear close above 668 → upside extension toward 670–672.
SPY is pinned between 663–664 support and 667–668 resistance. Whichever side breaks first will likely define the day’s momentum. Bulls must reclaim and hold above 668 for continuation, while bears need a break under 663 to take control.
Disclaimer: This analysis is for educational purposes only and not financial advice. Trade safely and manage risk.
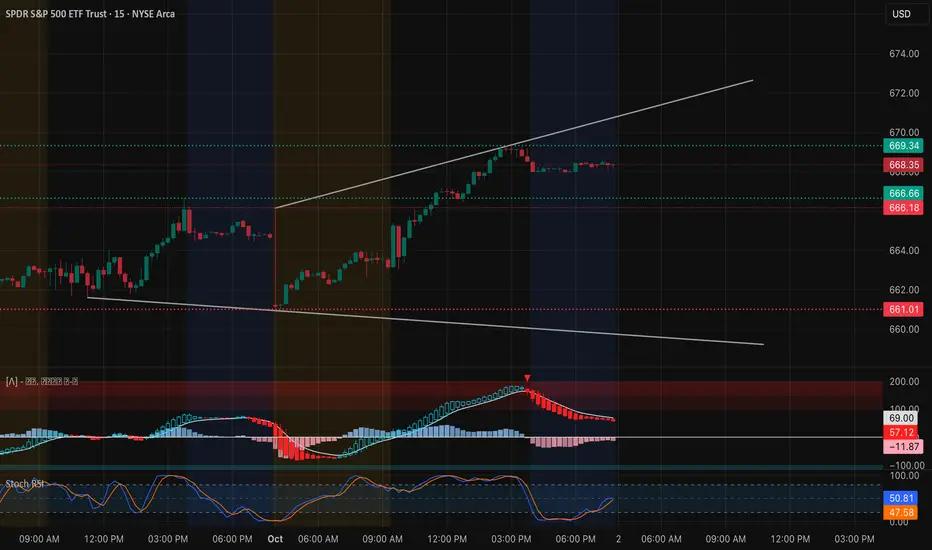
SPY Stalling at $669 – Gamma Ceiling in Play (Oct 2) Intraday (15-Min Chart)
SPY ripped higher into the 668–669 zone, testing the upper channel before momentum started cooling. On the 15-min chart, MACD has rolled over into red, while Stoch RSI is mid-range after pulling back from overbought.
* Immediate resistance: $669.3 intraday high.
* Support zones: $666.6 first, then $662 (gap fill and prior pivot).
* Upside trigger: A breakout over $669.5 opens the door toward 671–673 intraday.
* Downside risk: Break under $666 could trigger a pullback to $662–660.
Bias intraday: leaning bullish above 666, but momentum is stalling — buyers need to hold the line for continuation.
Options / GEX (1-Hour Chart)
Gamma positioning defines the battlefield clearly.
* Call walls: Heavy resistance at 667–671, with 669 marking the highest positive GEX level. Above 671, dealer hedging could fuel a push into 673+.
* Put walls: Key support sits at 662 and 660, with deeper protection at 655.
* Sentiment: Options flow leans bearish (≈97% puts), showing caution despite the recent rally.
This suggests SPY is pinned into a tight gamma box — 662 support vs 671 resistance. A breakout could fuel volatility, but chop is likely until one side cracks.
My Thoughts
For Oct 2, SPY is at a decision point. Scalps favor longs above 666 targeting 669–671, with tight stops if 666 fails. For option traders, a 668/671 call spread works if momentum carries higher, while a 665/660 put spread hedges downside if resistance holds.
Bias: Neutral to bullish above 666 — but until 671 breaks, SPY is capped by gamma walls.
Disclaimer: This analysis is for educational purposes only and does not constitute financial advice. Always do your own research and manage risk before trading.
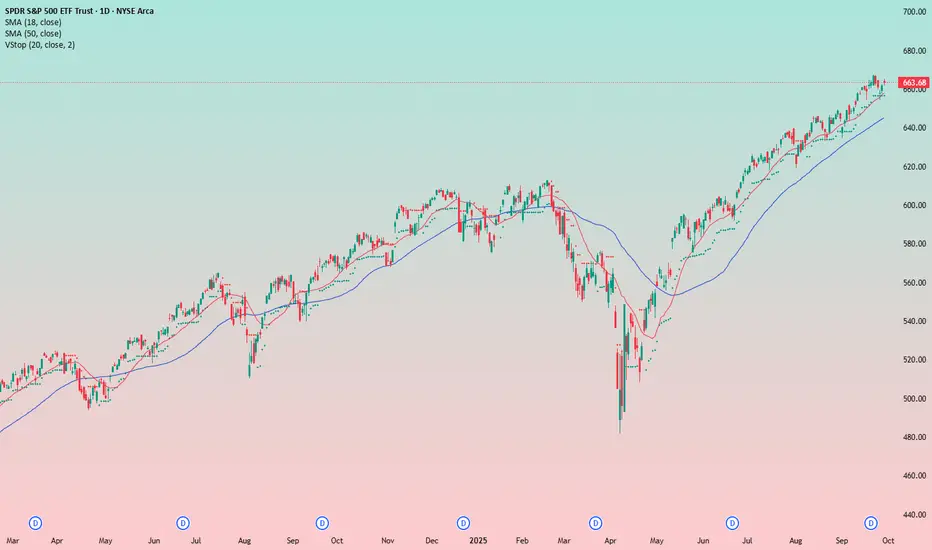
Welcome to the month of crashesSPY extended gains today, pushing into overextended territory relative to longer-term averages. The trend remains constructive, but the setup is becoming more two-sided as we head into October — a month historically prone to sharp market swings.
Bullish case:
Momentum remains strong within the broader uptrend.
A sustained breakout above 670–675 could open the path toward 690–700.
Bearish case:
🌍 Rising geopolitical tensions,
💱 Carry trade unwinding, and
🏦 The risk of no Fed rate cuts due to lack of supportive data,
combined with the seasonal October crash risk. Historically, October has been prone to sharp market selloffs (1929, 1987, 2008), adding seasonal risk., could ignite a 10–12% correction.
First warning sign: a breakdown below 660.
Deeper risk emerges if 645–650 support fails, which could accelerate downside momentum.
⚡ Takeaway: SPY is stretched — while upside targets remain valid, traders should watch these key levels as confirmation for either continuation or correction.
SPY VS. Economic DownturnTechnicals
- Double Top
- Bearish Divergence
- RSI approaching Overbought territory (68 on the daily)
Fundamentals
- Inflation Rising
- Unemployment Rising
- Job Openings Decreasing
- Government Shutdown (Friday's Non-Farm Payrolls report Cancelled)
- Q4 Earnings (Big Tech AI CapEx spend needs to show proof of ROI)

$SPY / $SPX Scenarios — Wednesday, Oct 1, 2025🔮 AMEX:SPY / SP:SPX Scenarios — Wednesday, Oct 1, 2025 🔮
🌍 Market-Moving Headlines
🚩 Jobs + factories double hit: ADP jobs and ISM Manufacturing kick off October with the labor + growth pulse.
📉 Q4 repositioning: Funds reset exposures after quarter-end — volatility risk elevated.
🛢️ Auto lens: Auto sales (TBA) add color on consumer durability.
📊 Key Data & Events (ET)
⏰ 🚩 8:15 AM — ADP Employment (Sep)
⏰ 9:45 AM — S&P Final Manufacturing PMI (Sep)
⏰ 10:00 AM — Construction Spending (Aug)
⏰ 🚩 10:00 AM — ISM Manufacturing (Sep)
⏰ TBA — Auto Sales (Sep)
⚠️ Disclaimer: Educational/informational only — not financial advice.
📌 #trading #stockmarket #SPY #SPX #ADP #ISM #manufacturing #jobs #economy #Dollar #bonds #autos #megacaps