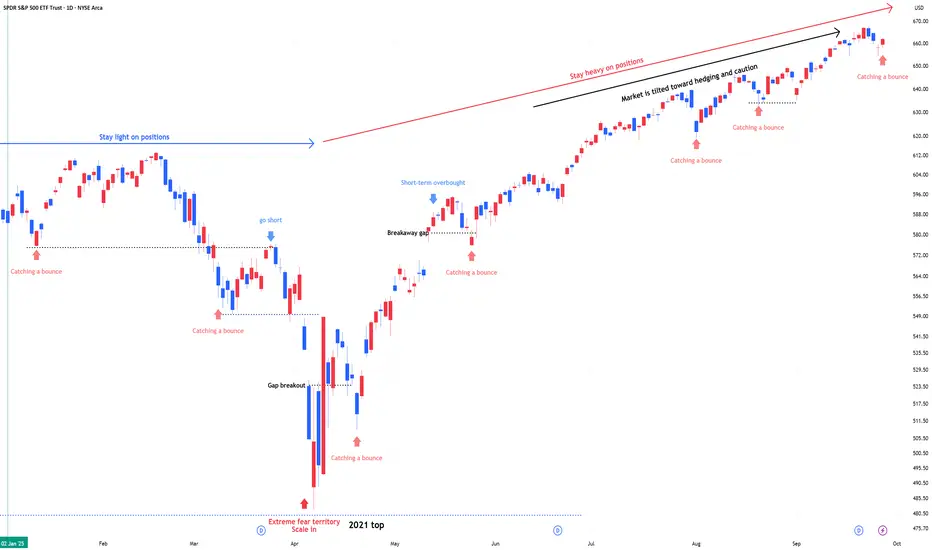
SPY : Stay heavy on positionsSPY : Stay heavy on positions (2x leverage)
Entering a risk-on, high-volatility zone.
A signal for catching a bounce has emerged.
In stay light on positions zones, I hold SPY(+QQQ) and reduce exposure.
In stay heavy on positions zones, I increase allocation using a mix of SSO(+QLD) and TQQQ.
** This analysis is based solely on the quantification of crowd psychology.
It does not incorporate price action, trading volume, or macroeconomic indicators.
SPY trade ideas
SPY WEEKLY 26 SEP 2025 This is the price action analysis for SPY . I have clearly discussed the levels and have touched on psychology side as well. If you have any doubts, feel free to leave a message.
NOTE: DONT TRADE AS OPTIONS AS MARKET IS ALL TIME HIGH

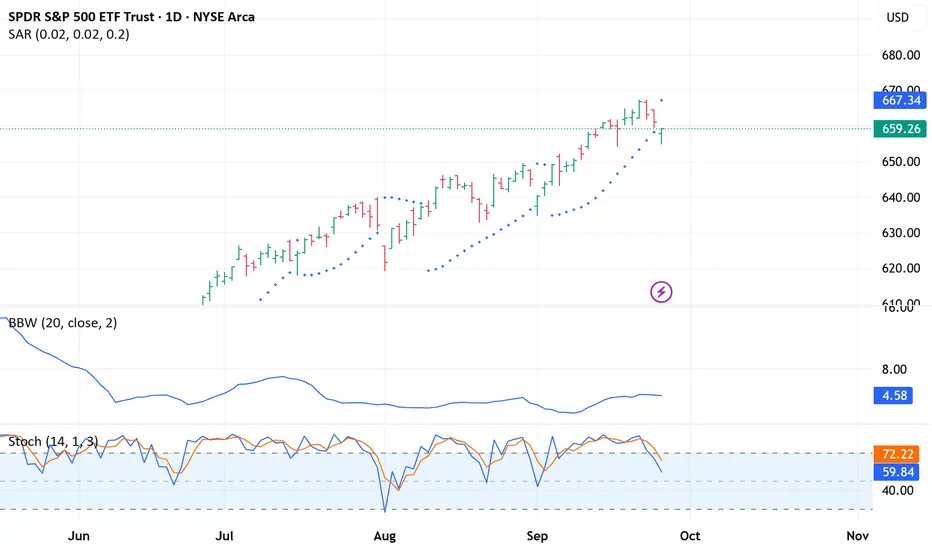
SPY and VIX - what I'm watching forA break below yesterday's low is a likely sell on SPY. VIX also in heavy consolodation but has not broken out yet.

SPY Technical Analysis – Sep 26 Morning SetupSPY is opening the session with early upward pressure but still sitting in a bigger, mixed range. Here’s a structured read based on the two 15-minute charts you shared.
1. Price Action & Market Structure
* Trend bias: Pre-market push lifted price from ~657 to 662.3, breaking the overnight range and creating a small bullish structure break (CHoCH).
* Immediate reaction: After tagging ~662.3 the candle pulled back toward 659–660, so the move is being tested rather than cleanly extending.
* Key intraday pivot: 659.5–660 zone now acts as first key support. Holding here keeps the morning bullish idea alive; losing it invites a retest of the lower demand pocket at 656.5–657.
2. Supply & Demand / Order Flow
* Demand: 657–656.5 (HVL base and yesterday’s lower support).
* Supply: 661–662.3 (today’s pre-market high and first call resistance). Above that, next notable supply is near 664–665 where bigger call walls cluster.
3. Indicator Check
* 9 EMA / 21 EMA: Price is still above both, showing near-term momentum, but the recent red candle is testing the 9 EMA.
* MACD: Positive histogram and lines still crossed bullish, supporting continuation if support holds.
* Stochastic: Entering overbought territory; a short-term pause or retest is normal.
4. Options & GEX Context
* Call Walls / GEX:
* 1st call resistance: 661 (56% concentration)
* 2nd: 664 (36%)
* 3rd: 665 (49%)
* Put Walls / Support:
* 1st put wall: 656.5 (highest negative NET GEX)
* 2nd: 654 (stronger downside magnet if 656.5 breaks)
* Put/Call ratio: Puts ~62% vs Calls ~38%, still tilted bearish on a larger frame.
Interpretation: Near-term intraday gamma pressure favors a chop between ~657 and ~662 until one side gives way. A decisive 15-minute close over 662.3 could squeeze to 664-665.
5. Trading Scenarios
Bullish Path
* Entry idea: Bounce from 659.5–660 with volume reclaim.
* Targets: 662.3 then 664–665.
* Stop: Below 657.
Bearish Path
* Entry idea: Clean 15-min close under 659 with selling volume.
* Targets: 656.5 first, then 654.
* Stop: Above 661.
Scalpers can watch 1-minute retests at these pivots for confirmation.
6. Quick Take
SPY is trying to build a morning reversal off the 657 base, but gamma positioning and overnight resistance at 662.3 keep the upside capped until proven otherwise. Early risk-reward favors patience: wait for either a strong 15-minute close above 662.3 for a push toward 664-665, or a failure below 659 to ride a fade toward 656.5/654.
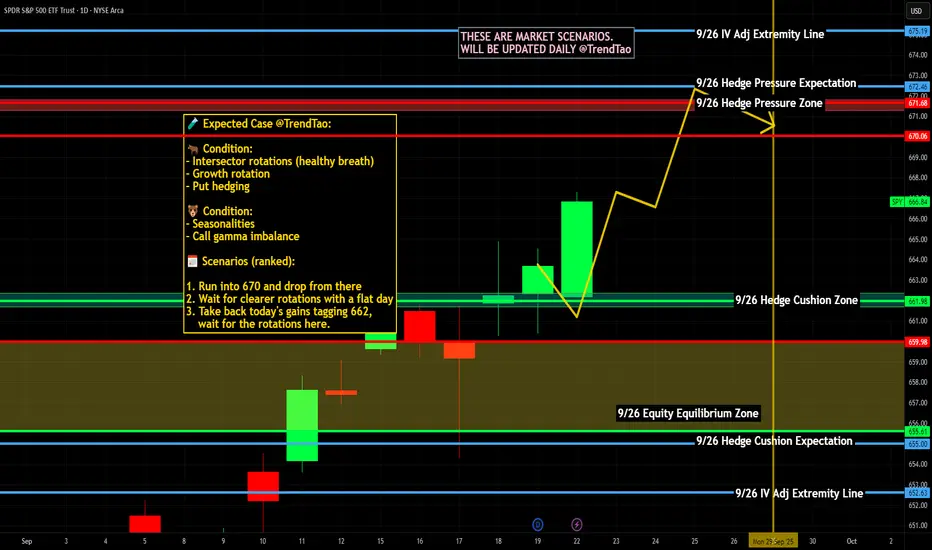
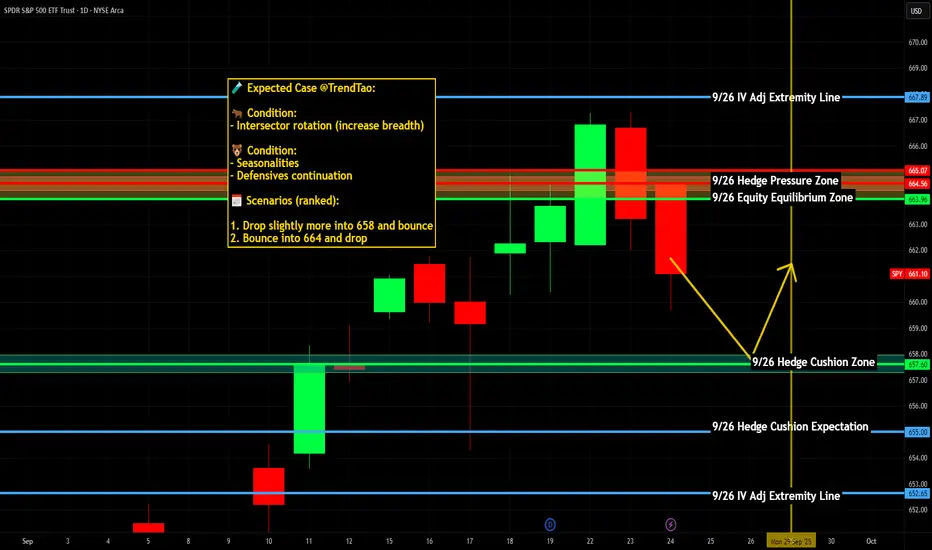
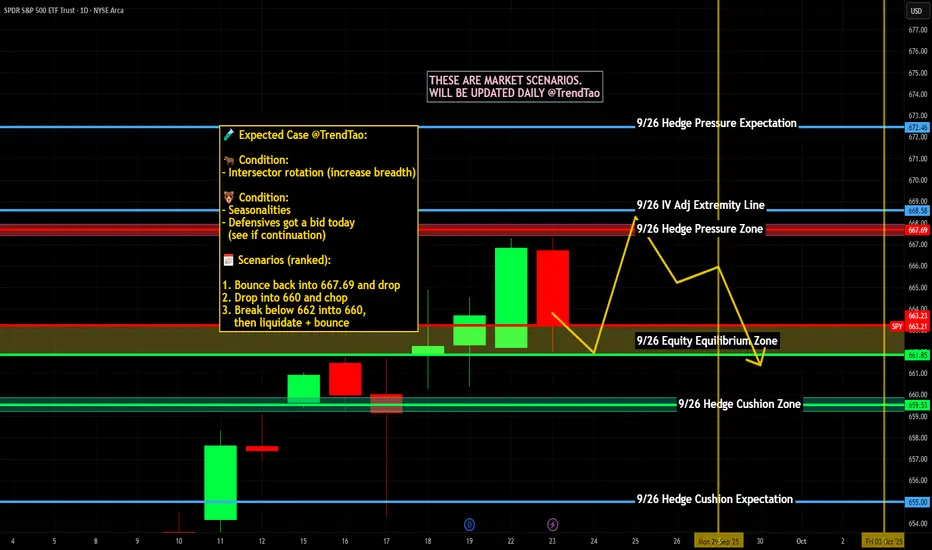
$SPY Tomorrow’s Trading Range 9.26.25
This is tomorrow’s trading range for SPY - Look at that Island gap in the upper part. What do you think? End of the rally?
Rates were cut, equities are overvalued and it’s time to reverse this beast. Just my opinion - trade the chart not my opinion.

Still AliveStill here, don't worry, will post an update soon on what I've been up to. But for now, we're at an inflection point, with ChatGPT saying we could see 655 and further 652 by Monday if markets react badly to PCE. Otherwise a nice healthy bounce to 662 and try for 667 -> 672 by next Friday. And we both peg Tuesday Sept 30th/Weds Oct 1st as up days, me with about 70% confidence.... ChatGPT with about 85%. *rolls eyes*

SPY SEP 25,2025 READ NOTESSpy can still hit $676 but as a trader my job is to understand the risk then put Stop loss & then trade.
So, I am long with stocks only:
SL @$653 with a target of $676.
The level is pretty average & most of the traders who learnt price action from me won't even call this a level. If you don't understand a level, then don't trade it(simple).
I initiated the long trade when I posted the chart in the morning.
If it hits my SL then il accept and move on. I am waiting for this week to close &will publish the video analysis tomorrow after market close.
NOTE: DO NOT TRADE OPTIONS

$SPY / $SPX Scenarios — Friday, Sept 26, 2025🔮 AMEX:SPY / SP:SPX Scenarios — Friday, Sept 26, 2025 🔮
🌍 Market-Moving Headlines
📉 Month-end flows: Positioning shuffle as traders square books into Q3-end.
💵 Fed lens: Multiple Fed appearances keep policy tone in focus post-SEP.
💻 Tech + growth watch: AMEX:XLK flows remain sensitive to yields + inflation gauges.
🛢️ Commodities check: Oil and dollar volatility continue to set cross-asset tone.
📊 Key Data & Events (ET)
⏰ 🚩 8:30 AM — Personal Income & Spending (Aug)
⏰ 🚩 8:30 AM — PCE Price Index (Aug) + Core PCE (YoY & MoM)
⏰ 10:00 AM — Consumer Sentiment (Final, Sep)
🗣️ Fed Speakers:
• 7:30 AM — Tom Barkin (Richmond Fed, TV appearance)
• 9:00 AM — Tom Barkin (speech)
• 1:00 PM — Michelle Bowman (Fed Vice Chair for Supervision)
⚠️ Disclaimer: Educational/informational only — not financial advice.
📌 #trading #stockmarket #SPY #SPX #PCE #inflation #Fed #Powell #joblessclaims #consumer #Dollar #bonds #megacaps
$SPY - Important Point To Watch Watching the S&P here closely. Catalyst-heavy window ahead with two more FOMC decisions (Oct 28–29 and Dec 9–10) sandwich Q3 earnings (banks kick off mid-Oct mega-cap tech late Oct/early Nov). These can drive volatility and directional breaks.

SPY - The Sell Signal that is ALWAYS a BuyOnce again, the Parabolic indicator triggers sell. Probably the most useless indicator on the planet for the S&P. ANy little dip is quickly bought up. Why is now any different?
SPY Pre-Market Trade Plan (Bearish Bias) 9/25Been receiving lots of positive feedback on pre-market trade plans so here is another one for 9/25. Trade Idea with a bearish central thesis. Invalidates if we break and close above to purple box (stop).

SPY CORRECTION SOON?Technical Outlook:
- Head and Shoulders (forming)
- Overbought RSI (above 70)
- Signaling Bearish Divergence
Fundamental Outlook:
Economic weakness looms as rising inflation meets sluggish growth, fueling stagflation fears. With markets on edge, a spooky September sell-off could be triggered by tightening conditions and fading investor confidence.

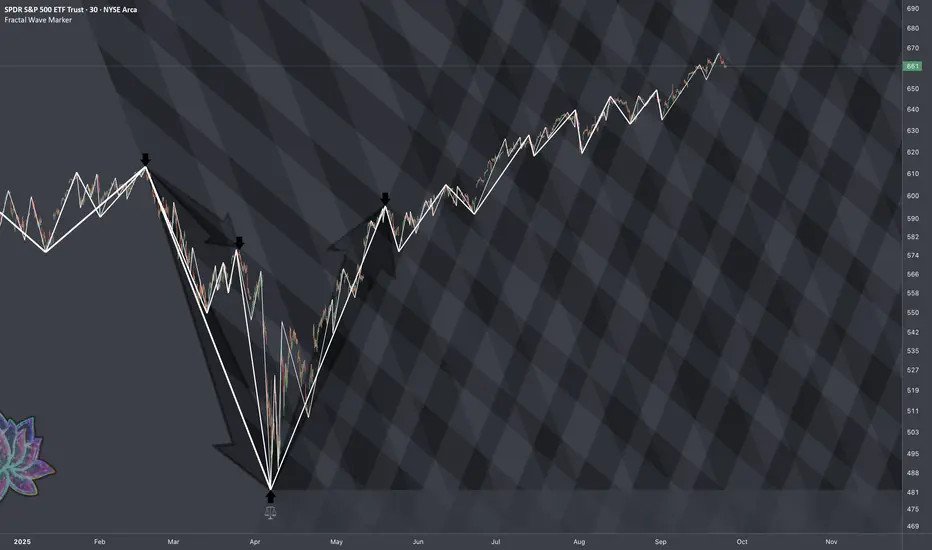
$SPY: Systematic Behavior 3 Frames of Reference:
An angle from the top (beginning of decline) to a point of resistance where the price got further dumped to form a bottom. This emphasizes some boundary that needs to be broken in order to proceed to transition phase.
Also would be nice to have the angle of entire tariff crash so the fib spacings could reflect the shockwaves of that event.
For the 3rd ( as 3rd axis in geodesics ), we would cover what immediately grew after crash establishing a common angle.
In cases 2 and 3, the common criterion for choosing the angle was that in both cases the nested cycles on smaller scale were completed confirming the measured angle. Watching for consistency in shapes is essential for capturing the interplay of multiple forces.
$SPY / $SPX Scenarios — Thursday, Sept 25, 2025🔮 AMEX:SPY / SP:SPX Scenarios — Thursday, Sept 25, 2025 🔮
🌍 Market-Moving Headlines
📉 Data-heavy morning: Multiple macro releases hit at 8:30 AM, setting tone across bonds, USD, and equities.
💬 Fed chorus: Packed lineup of Fed speakers keeps policy narrative in focus.
💻 Tech + rates tension: AMEX:XLK flows remain sensitive to bond yield direction post-FOMC.
🛢️ Energy lens: Oil volatility continues to act as an inflation wildcard.
📊 Key Data & Events (ET)
⏰ 🚩 8:30 AM — Initial Jobless Claims (weekly)
⏰ 🚩 8:30 AM — GDP (Q2, third estimate)
⏰ 🚩 8:30 AM — Durable Goods Orders (Aug)
⏰ 10:00 AM — Existing Home Sales (Aug)
🗣️ Fed Speakers:
• 8:20 AM — Austan Goolsbee (Chicago Fed)
• 9:00 AM — John Williams (NY Fed) & Jeff Schmid (Kansas City Fed)
• 10:00 AM — Michelle Bowman (Fed Vice Chair for Supervision)
• 1:00 PM — Michael Barr (Fed Gov.)
• 1:40 PM — Lorie Logan (Dallas Fed)
• 3:30 PM — Mary Daly (San Francisco Fed)
⚠️ Disclaimer: Educational/informational only — not financial advice.
📌 #trading #stockmarket #SPY #SPX #GDP #joblessclaims #durablegoods #housing #Fed #Powell #Dollar #bonds #megacaps
SPY S&P 500 etf Oversold on the RSI ! 2025 Price Target ! The SPDR S&P 500 ETF Trust (SPY) is flashing a major buy signal, with its Relative Strength Index (RSI) currently sitting at 28.33 — firmly in oversold territory. Historically, every time SPY has entered oversold levels on the RSI, institutional buyers have stepped in aggressively, driving sharp rebounds in the following weeks and months.
The last time SPY dipped below the 30 RSI threshold was during market pullbacks in 2022 and 2023 — both of which were followed by significant rallies as institutions capitalized on discounted valuations. The current setup is no different. With earnings growth stabilizing, inflation cooling, and the Federal Reserve signaling a potential shift toward rate cuts in the second half of the year, the backdrop for a recovery is aligning perfectly.
Technically, SPY is also approaching key support levels that have held strong in past market corrections. The combination of an oversold RSI and strong institutional appetite at these levels creates a compelling case for a bounce.
My price target for SPY by year-end is $640, representing over 15% upside from current levels. With sentiment stretched to the downside and technical indicators flashing green, SPY looks primed for a sharp and sustained rebound. Now could be the perfect time to position for the next leg higher.

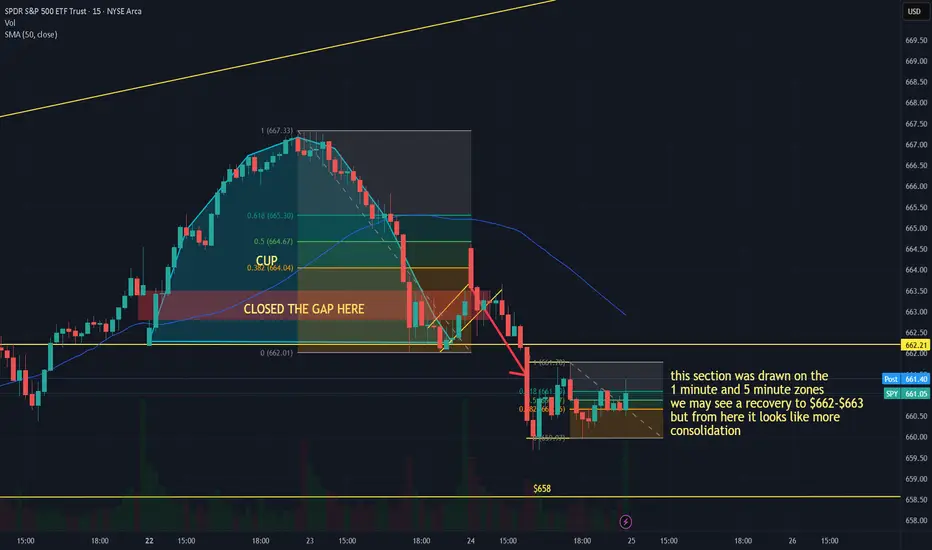
$SPY REVERSE CUP AND HANDLE part 2.I guess the reverse cup and handle I had drawn out on the 5 minute and one minute chart worked out too bad I did not have a put option in place. I would have recovered some of my losses chasing the rabbit on $ORCL. I'm not going to lie this market has me shook. I seriously prefer crypto. Participating in a market that is this effected by someone talking is ridiculous. What I am trying to learn is price action. I am also learning to use the 50 day Moving Average indicator. I am not fully comfortable. I have been able to use FIB retracement tool along with some other indicators whether it be a chat pattern or the MVA.
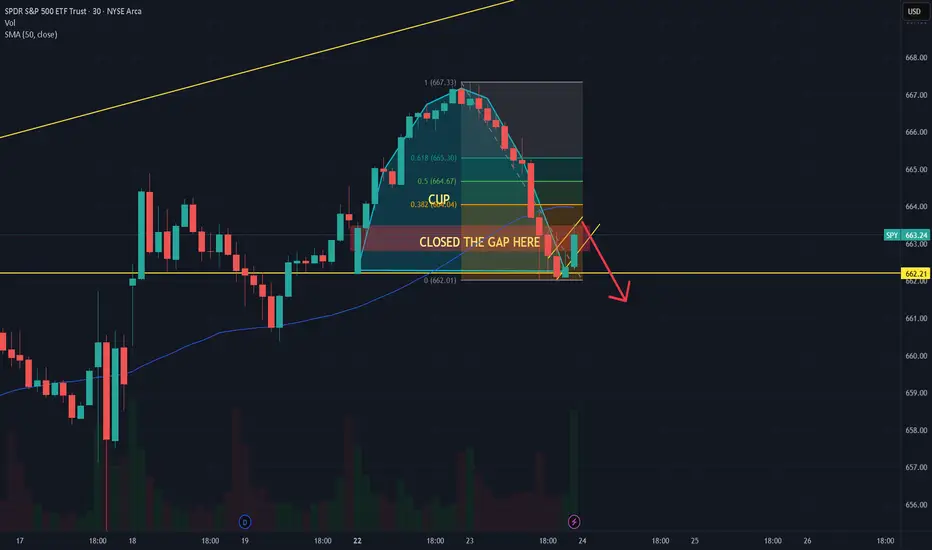
So, if you zoom in to the area where consolidation is taking place using the FIB retracement and support and resistance lines it may touch $662-$663. If it breaks out with a strong green candle we may have a recovery, but it breaks out lower below support with a strong red candle you will see a breakdown further down to previous supports $658, $654, $652.70 To close a big gap,
The reason I also say it may touch $662-$663 is because we should be tracking that the candles have to either bounce off of or tread about the 50-day MVA. So, either way there is money to be made but once this month and the holidays are through expect this to breakout much higher to $700 if trump gets his way. AKA Printer go BRRRRR. He's a master market manipulator and Perma bull
In the meantime, sit and wait for a good breakout I may have to exit my current position at a loss. Scary times we are living in. Get your life right with The Lord Jesus Christ.
AS ALWAYS THIS IS NOT FINANCIAL ADVICE, PURELY USING MY SELF-TAUGHT TECHNICAL ANALYSIS OF THE SITUATION. GODBLESS YOU ALL AND I PRAY YOU ALL HIT YOUR GOALS THIS MONTH.
SPY Trapped Between 670 Resistance & 662 Support📖 Crown Point Research
1. Date & Time
📌 Date: 24th September 2025
📌 Time: 08:45 PM IST
2. Fundamental News
“US Treasury yields eased slightly, but Fed officials kept policy guidance hawkish. Headlines are mixed: tech optimism vs inflation caution. Market moves remain primarily technical.”
3. Public Sentiment & Human Behavior
• Retail: Chasing intraday bounces expecting a reversal.
• Institutions: Distributed supply at resistance, rotated flows cautiously.
• Social Signal: Headlines read “soft landing confidence,” but structure shows fragile micro pullbacks.
4. Current Structure
Macro :
• Resistance: 668–670
• Support: 655–652
• Stage: Macro Maturity → candles show fragile tops
Micro :
• Resistance: 665–667
• Support: 661.5–662
• Behaviour: Controlled pullback underway.
5. Projection (Paths)
Primary Path (65%):
Retest 665–667, then continuation lower toward 661.5–662.0.
Alternate Path (25%):
Hold above 665 → extension into 670
Low Path (10%):
Breakout beyond 670 → only possible with strong global positive catalyst (policy/economic shock).
Overrides:
Bullish Override : If positive news , Breakout extends beyond 670 toward 675
Bearish Override (3/3 pillars align): If negative news, Collapse accelerates toward 657–655 directly, bypassing pullback supports.
6. Pullback Levels
• Shallow: 664.5–665.0
• Medium: 667.0 barrier
• Deep: 670–671
7. Final View
Bias: Bearish until 667 is reclaimed with conviction.
• Path remains toward 662 with extension possible to 655 if bearish override triggers.
8. Essence (Philosophy Line)
“Until barriers flip with institutional strength, downside paths remain dominant.”
9. Disclaimer
⚠️ “This analysis is shared for educational and research purposes only. It is not financial advice, trading advice, or investment recommendation. Market decisions are entirely your own responsibility.”

Reverse Cup and Handle On SPY.So, I am looking at spy on the 1 minute and I see this beautiful arch It got a cup, and the handle is either forming or formed. So, I double check on the 30, 1 hour the 4 hour and the daily. The Daily is kind of eh. So, I can see it going down on the 1 minute if the Handle has formed and touching 660, But on other time frames like the daily using a 50-day moving average along with a support and resistance line you can see it go as low as $650, Since I am usually a crypto bro and Now I am trying my hand in stocks. It's not even the volatility that I struggle with its the Market reaction to the news. You can see something like a reverse cup and handle form and if trump says, " All American citizens should be on the lookout for SPYies." All of a sudden, the AMEX:SPY will do the opposite of what should happen when a cup and handle is forming. Although I regret putting in my position to soon and not looking at the chart first I put in a long call for $675- to $680 now I feel like. I should stick back to paper trading crypto at least I was more successful. I guess it's just a learning curve for me. But we shall see hopefully some good new tomorrow lol.
THIS IS NOT FINANCIAL ADVICE, BE ADVISED THIS IS MY OPINION AND JUST BASSED OFF OF WHAT I LEARN FROM LEARNING TRADING STRATGIES ON YOUTUBE. GODBLESS YOU ALL AND GOODLUCK. I need to do better.
Lesson learned this week.
Dont chase the rabbit
Look at the chart first before you put in a trade. I am about to blow up my account in a bit. SMH Went from $260 to $830 in a month doing swing trades. Not im back down to $300, chasing the rabbit and spending money moving. Ugh wish me luck its hard out here for a PAMP.
SPY touching the Upper ChannelSPY touching the Upper Channel. Let's see if retracts down to touch the lower channel

$SPY / $SPX Scenarios — Wednesday, Sept 24, 2025🔮 AMEX:SPY / SP:SPX Scenarios — Wednesday, Sept 24, 2025 🔮
🌍 Market-Moving Headlines
📉 Month-end positioning: Flows light as traders prep for Thursday’s 🚩 GDP + Jobless Claims.
💻 Mega-cap drift: Tech leadership remains central with $AAPL/ NASDAQ:NVDA volatility post-Powell.
💵 Rates + housing: Home affordability narrative continues to weigh on broader risk tone.
📊 Key Data & Events (ET)
⏰ 🚩 10:00 AM — New Home Sales (Aug)
⏰ 4:10 PM — San Francisco Fed President Mary Daly speech
⚠️ Disclaimer: Educational/informational only — not financial advice.
📌 #trading #stockmarket #SPY #SPX #Fed #housing #Powell #economy #Dollar #bonds #megacaps
SPY Sep 23 – Bulls Pushing Toward 668–670, Gamma Still in PlayPrice Action & Setup (1-Hour Chart)
SPY has been grinding higher after last week’s consolidation, now trading around 666.7 and pressing the upper end of the short-term channel. Immediate supports line up at 665 and 662, with deeper backup near 657. As long as SPY holds above 665, the structure favors another push to the 668–670 zone.
Momentum Read
MACD remains strongly positive with rising histogram, showing momentum is still alive. Stoch RSI is elevated (near 90), which could lead to short pauses or small pullbacks, but no reversal signals yet.
GEX (Options Flow) Confluence
Gamma exposure is bullish:
* Highest positive GEX / Call resistance: ~668–669
* 2nd Call Wall: near 667
* Next Call Wall: around 670
* Major Put Support: 661 with a secondary wall near 655
Holding above 665 forces dealers to hedge higher, which can keep the squeeze alive toward 668–670.
Trading Plan
* Upside continuation: Enter long on a confirmed hourly close above 667.2. Target 668–670. Stop just below 665.
* Dip buy: A pullback to 665 or 662 that holds on volume can be a low-risk reload.
* Quick short: Only if 661 breaks with heavy volume, aiming for 657 and 655.
Option Angle
Short-dated calls in the 668–670 strike range remain attractive if SPY stays over 665. Protective puts near 661 can work if breakdown signals appear.
Bottom Line
Bulls hold the upper hand as long as SPY stays above 665. A clean push over 667 could quickly extend to 668–670, with gamma hedging likely to assist.
Disclaimer: This is for educational discussion only and not financial advice. Always do your own research and manage risk.

Let's keep an eye out. Who else is seeing the same thing.
I am a bit worried at how people think this is a great 👍🏾 market. People buying in now wanting to catch some of these gains, its too late. The Fear&Greed Index reading around 63% more Greed 🐷🐖, how?
Some people might be left holding the 🎒 in 2026.
1. Let's pray
2. Take some profits, let the rest ride
3. Look forward a pullback & dollar cost
4. If you got it, hedge/look for shorts
Hope you all had a green 💚 year, give God his glory and give our 10% to charity.
Take care.

$SPY / $SPX Scenarios — Tuesday, Sept 23, 2025 🔮 AMEX:SPY / SP:SPX Scenarios — Tuesday, Sept 23, 2025 🔮
🌍 Market-Moving Headlines
📉 Post-Fed digestion: Equities and bonds still recalibrating after last week’s SEP + Powell tone.
💻 Mega-cap watch: Tech + AI flows continue to drive AMEX:XLK sentiment.
🌐 Central bank chatter: A busy Fed speaker slate gives extra volatility into month-end.
📊 Key Data & Events (ET)
⏰ 9:00 AM — Fed Vice Chair for Supervision Michelle Bowman speech
⏰ 🚩 9:45 AM — S&P Global Flash PMIs (Sep) — Services & Manufacturing
⏰ 10:00 AM — Atlanta Fed President Raphael Bostic speech
⏰ 🚩 12:35 PM — Fed Chair Jerome Powell speech
⚠️ Disclaimer: Educational/informational only — not financial advice.
📌 #trading #stockmarket #SPY #SPX #Powell #Fed #PMI #economy #Dollar #bonds #megacaps