$SPY / $SPX Scenarios — Thursday, Sept 18, 2025🔮 AMEX:SPY / SP:SPX Scenarios — Thursday, Sept 18, 2025 🔮
🌍 Market-Moving Headlines
📉 Post-Fed digestion: Markets recalibrate after Wednesday’s 🚩 FOMC decision + Powell press conference.
💵 Dollar & yields watch: FX and Treasury moves reflect how traders interpret the Fed’s updated path.
💻 Tech + growth trade: Positioning in AMEX:XLK and high-beta names remains key as rates reset.
🛢️ Energy chatter: Oil volatility keeps AMEX:XLE and inflation hedges in focus.
📊 Key Data & Events (ET)
⏰ 🚩 8:30 AM — Initial Jobless Claims (weekly)
⏰ 8:30 AM — Philadelphia Fed Manufacturing Survey (Sep)
⏰ 🚩 10:00 AM — Conference Board Leading Economic Index (Aug)
⚠️ Disclaimer: Educational/informational only — not financial advice.
📌 #trading #stockmarket #SPY #SPX #Fed #Powell #joblessclaims #economy #Dollar #bonds #tech #oil
SPY trade ideas
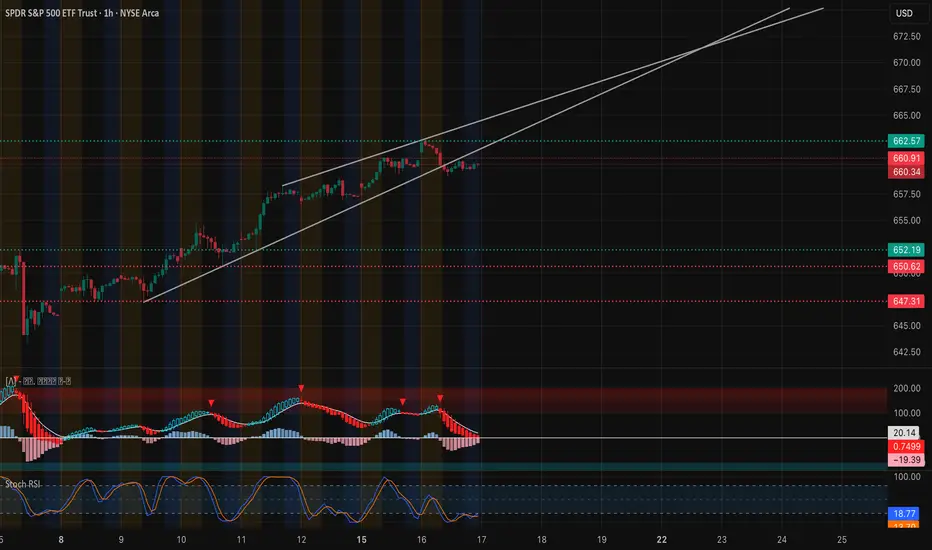
SPY: Coiling Near 660 With Key GEX Support–Swing & Scalp Sep 171-Hour Chart Technical View
SPY remains inside an upward channel, but the 1-hour chart shows a slight cooling. After peaking near $662.5, price is consolidating just above $660. MACD momentum has faded and Stoch RSI is in oversold territory, signaling a pause with potential for either a bounce or a deeper retest.
* Immediate Support: $659–$660 (current demand and channel midline)
* Major Support: $652 and $647 (trend and high-volume zones)
* Upside Zone: $662.5–$665 (channel top and key resistance) with $670 as the next major extension
The 9 EMA is still above the 21 EMA, which keeps the bullish structure alive as long as $659 holds.
GEX & Options Flow
Gamma positioning suggests mixed but constructive flows:
* Call Walls: $662.5 (strongest call resistance), $665, and $670.
* Put Walls: $652 and $641 are significant downside hedges.
* GEX Bias: Put gamma remains high at ~80.3%, while IVR is around 14.6 (IVx ~16.1). This signals a market braced for hedging but with moderate volatility expectations.
Such a setup typically leads to contained price action unless $659 breaks decisively.
Trade Thoughts & Suggestions
* Swing Idea: Buy dips near $659–$660 with a stop below $652, targeting $662.5–$665 and possibly $670.
* Scalp Idea: Quick bounce plays off $659 or a breakout scalp if $662.5 is reclaimed on strong volume.
* Bearish Scenario: A clean break under $652 could trigger a fast slide toward $647 and $641.
Quick Take
SPY is consolidating after a strong run. For Sept 17, the $659–$660 zone is critical. Holding it favors another push toward $662.5–$665; losing it opens lower supports.
Disclaimer: This analysis is for educational purposes only and does not constitute financial advice. Always do your own research and manage risk before trading.
Markets on Edge Ahead of Fed: Eyeing a CorrectionSimilar to what I mentioned in the silver outlook, I believe today the classic rule may play out: buy the rumor, sell the fact. This could trigger a pullback across the board — in precious metals (particularly silver and palladium) and, of course, in the broader equity market.
That said, it’s safer to consider entries closer to the Fed decision or even right after, since short-term market noise and potential manipulations are likely. I’ll be watching for opportunities, but any position will require a tight stop-loss, as the chart has yet to form a strong short setup — this trade is more of an idea than a clean technical pattern.
📝Trading Plan
🟢Entry: I plan to open a short closer to the Fed rate announcement.
🔴Stop: above yesterday’s high
🎯Target: 640

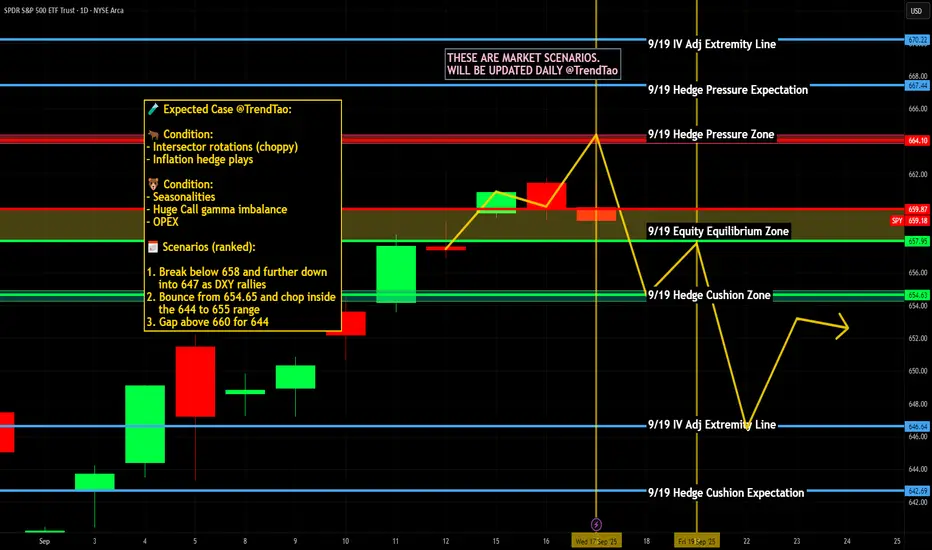
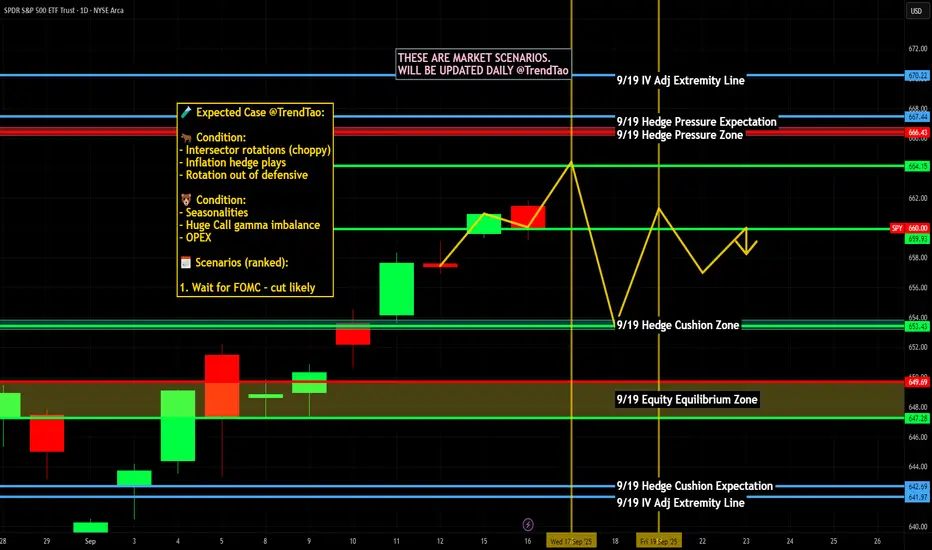
$SPY / $SPX Scenarios — Wednesday, Sept 17, 2025🔮 AMEX:SPY / SP:SPX Scenarios — Wednesday, Sept 17, 2025 🔮
🌍 Market-Moving Headlines
🚩 Fed Day: All eyes on the FOMC decision + Powell press conference — this will lock in the September rate path.
📉 Positioning risk: Funds lightened up into Tuesday’s Retail Sales; volatility likely post-Fed.
💻 Tech leadership in focus: NASDAQ:AAPL , NASDAQ:MSFT , and AI plays driving AMEX:XLK flows ahead of macro.
🛢️ Crude swings: Energy price stability remains an inflation sentiment wildcard.
📊 Key Data & Events (ET)
⏰ 8:30 AM — Housing Starts & Building Permits (Aug)
⏰ 10:30 AM — EIA Petroleum Status Report
⏰ 🚩 2:00 PM — FOMC Policy Decision + SEP (dot plot)
⏰ 🚩 2:30 PM — Powell Press Conference
⚠️ Disclaimer: Educational/informational only — not financial advice.
📌 #trading #stockmarket #SPY #SPX #FOMC #Powell #Fed #housing #energy #bonds #Dollar #megacaps
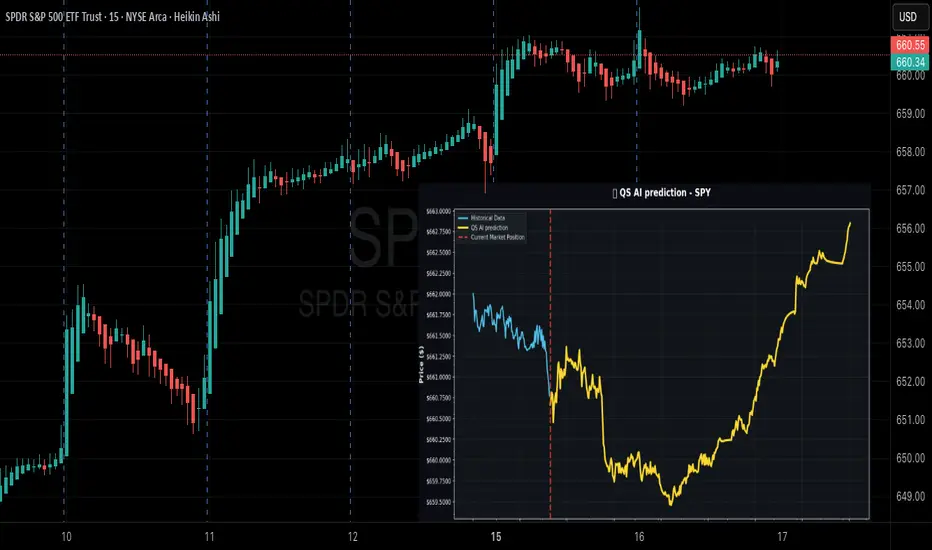
$SPY Neutral Prediction--Traders Eye BreakoutDaily AI-powered trade ideas, SPY 0DTE plans, NLP news signals, weekly option alerts & live trading updates. Trade smarter, every day. 🚀📈
🚀 AMEX:SPY Intraday Prediction – Neutral Trend, Breakout Loading?
📊 Market Status
Price: $660.77
Data Quality: ✅ Strong
Timeframe: 1-Min K-Line Precision
🎯 Price Forecasts
30-Min Target → $661.18 (+0.06%)
2-Hr Target → $659.75 (-0.16%)
End-of-Day → $662.85 (+0.31%)
📈 Extended Outlook
Final Target: $662.85 (+0.31%)
Volatility: 3.4%
Range: $659.46 – $662.85
⚖️ Trend Read
Direction: NEUTRAL
Confidence: 55%
Bias: ⚡ Watching for breakout above $662.85
🔑 Levels That Matter
Support → $659.46
Resistance → $662.85
Range Size → 0.5%
Central Bank Digital Currencies (CBDCs) in World Trading Systems1. Understanding CBDCs
1.1 Definition
A Central Bank Digital Currency (CBDC) is a digital form of a country’s sovereign currency, issued and regulated by its central bank. Unlike bank deposits or private stablecoins, CBDCs are a direct liability of the central bank, making them risk-free in terms of credit and liquidity.
1.2 Types of CBDCs
CBDCs are broadly categorized into:
Retail CBDCs – Designed for everyday transactions by individuals and businesses, functioning like digital cash.
Wholesale CBDCs – Used by banks and financial institutions for interbank settlements, large-scale cross-border trade, and capital market operations.
For world trading systems, wholesale CBDCs are particularly relevant because they address cross-border settlement delays, currency risks, and high transaction costs.
2. Historical Context of Trade & Money
To understand how CBDCs might transform world trade, we need to briefly revisit the evolution of money and trading systems.
Gold & Silver Standard: Ancient trade relied on commodity money (gold, silver, copper), valued for scarcity and intrinsic worth.
Paper Money & Fiat Currencies: With modern nation-states, paper currency and fiat systems emerged, backed initially by gold (Bretton Woods, 1944) and later by trust in governments.
The Dollar Dominance: Post-1971, the US dollar became the world’s reserve currency, dominating global trade settlement, particularly in oil and commodities (Petrodollar system).
Digital Payments & Cryptocurrencies: In the 21st century, fintech innovation and blockchain technology challenged traditional banking, raising questions about efficiency, privacy, and sovereignty.
CBDCs represent the next evolutionary step—a blend of sovereign money and digital innovation—capable of transforming not only domestic payments but also cross-border trade systems.
3. CBDCs in Global Trade: Opportunities
3.1 Faster Cross-Border Settlements
Today, cross-border trade payments often take 2–5 days, relying on intermediaries, correspondent banks, and SWIFT messaging. With CBDCs, settlement can be instantaneous, reducing time and risk.
For example, a Chinese exporter selling goods to an African buyer could receive payment in digital yuan instantly, without waiting for dollar-clearing in New York.
3.2 Reduced Transaction Costs
International trade involves currency conversion, banking fees, and correspondent charges, which can add 3–7% to transaction costs. CBDCs, by enabling direct currency-to-currency exchange via digital platforms, could significantly lower costs.
3.3 Financial Inclusion in Trade
Many small and medium enterprises (SMEs), especially in developing economies, struggle with cross-border payments due to lack of banking access. CBDCs can democratize access, enabling SMEs to engage directly in global markets.
3.4 Bypassing SWIFT & Dollar Dependence
One of the most debated impacts of CBDCs is their potential to challenge US dollar hegemony. Currently, over 85% of global trade is invoiced in dollars or euros. CBDCs like the digital yuan (e-CNY) aim to provide an alternative, especially in Asia, Africa, and Belt and Road countries.
3.5 Programmable Money & Smart Contracts
CBDCs can be embedded with programmability, enabling conditional trade payments. For instance:
A CBDC transaction could release payment automatically once goods clear customs.
Smart contracts could enforce trade finance agreements, reducing fraud and disputes.
4. Key Global CBDC Experiments
4.1 China’s Digital Yuan (e-CNY)
The most advanced large-scale CBDC, piloted in over 25 cities.
Being tested in cross-border trade via Hong Kong, Singapore, and Belt and Road Initiative (BRI) partners.
Aims to internationalize the yuan and reduce dollar dependence.
4.2 India’s Digital Rupee
Introduced by the Reserve Bank of India (RBI) in 2022–23.
Wholesale pilot programs for interbank settlements.
Potentially useful for India’s high-volume trade with Asia, Africa, and the Middle East.
4.3 Europe’s Digital Euro
European Central Bank exploring a digital euro for retail and wholesale use.
Expected to strengthen eurozone trade settlement systems and reduce reliance on US intermediaries.
4.4 Project Dunbar & Project mBridge
Project Dunbar (BIS): A multi-CBDC platform involving Singapore, Australia, Malaysia, and South Africa.
Project mBridge: Collaboration between China, Thailand, UAE, and Hong Kong, enabling real-time cross-border CBDC payments.
These pilots suggest that CBDCs are moving beyond national borders into multilateral trade systems.
5. Implications for World Trading Systems
5.1 Geopolitical Shifts in Currency Power
CBDCs could accelerate the shift from unipolar dollar dominance to a multipolar currency order, where regional CBDCs (digital yuan, digital rupee, digital euro) coexist and compete.
5.2 Trade Alliances & CBDC Zones
Countries may form CBDC trading blocs, agreeing to settle in digital currencies instead of dollars. For example:
BRICS nations exploring a CBDC trade platform.
Gulf states considering digital settlements for oil exports.
5.3 Transparency vs. Privacy
CBDCs offer traceability, reducing trade-based money laundering and fraud. However, this raises concerns about state surveillance of international transactions.
5.4 Impact on SWIFT & Correspondent Banking
If CBDCs enable direct central bank-to-central bank settlement, traditional intermediaries like SWIFT and correspondent banks could lose relevance.
5.5 Exchange Rate Mechanisms
With real-time settlement, CBDCs may require new FX models, possibly leading to dynamic currency baskets for trade invoicing.
6. Challenges & Risks
6.1 Interoperability
For CBDCs to work in world trade, different national CBDCs must interact seamlessly. This requires standardized protocols and cross-border agreements.
6.2 Cybersecurity Threats
CBDCs, being digital, face risks of hacking, cyberwarfare, and systemic attacks, which could disrupt global trade.
6.3 Monetary Sovereignty Conflicts
If a foreign CBDC gains dominance in another country (e.g., digital yuan in Africa), it may undermine local monetary control.
6.4 Technological Divide
Advanced economies may adopt CBDCs faster, leaving developing nations behind, creating digital trade inequalities.
6.5 Political Resistance
The US, benefiting from dollar dominance, may resist widespread CBDC adoption in trade settlement. Sanctions, regulations, and political pressure could slow CBDC globalization.
Critical Perspectives
While CBDCs promise efficiency and inclusivity, critics warn that:
They may fragment global finance if each nation builds incompatible systems.
CBDCs could be used as tools of geopolitical influence, where powerful economies push their CBDCs onto weaker partners.
Privacy concerns and state control may reduce adoption in democratic societies.
Thus, the success of CBDCs in world trading systems depends not only on technology but also on trust, governance, and global cooperation.
Conclusion
Central Bank Digital Currencies are no longer theoretical—they are becoming reality. Their integration into world trading systems could redefine how goods, services, and capital move across borders. CBDCs promise faster, cheaper, and more inclusive trade settlements, reducing reliance on intermediaries and potentially reshaping global monetary power.
Yet, the transition is fraught with challenges: interoperability, cybersecurity, political resistance, and the risk of financial fragmentation. The future likely points to a multi-CBDC ecosystem, coordinated by international institutions, where nations balance efficiency with sovereignty.
In essence, CBDCs represent both a technological innovation and a geopolitical tool. Their impact on global trade will depend not just on design and adoption but on how nations choose to cooperate—or compete—within this new digital financial order.
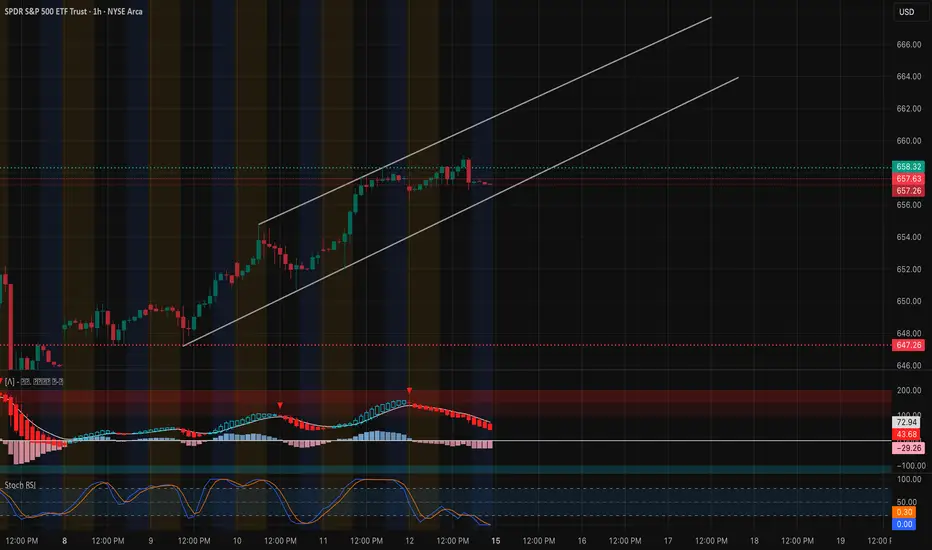
SPY 1H + GEX Game Plan for Tue, Sep 16SPY Holding Strong Inside Rising Channel — Eyes on 662 Gamma Wall 🚀
Market Structure (1-Hour View)
* Trend: SPY continues its steady rising channel advance, making higher highs and higher lows above 659.9.
* Momentum: MACD is flattening with red bars hinting at minor consolidation, while Stoch RSI near oversold (~17) shows room for another push if buyers step back in.
Key Levels to Watch
* Resistance: 661.0 (recent high), 662–663 (strong gamma / call resistance), and 664 as next upside target.
* Support: 658.3, 657.4, and deeper 652.2–650.6.
GEX Read (Sep 16)
* Highest positive NETGEX / Call Resistance: 662
* 2nd Call Wall: 660, 3rd Call Wall: 664.
* Put walls / magnets: 657, 655, and 650.
* Options sentiment: Puts dominate (~75%), IVR ~13.7, IVx ~15.4 — dealers may try to pin SPY near 660 but a squeeze over 662 can trigger hedging higher.
Implication:
* Base case: sideways between 657 and 662 until fresh flows.
* Break and hold >662 can ignite a gamma squeeze to 664 or higher.
* A close <657 shifts bias toward 652–650.
Trade Scenarios
1) Bullish Breakout
* Trigger: 1H close >662 with strong volume.
* Entry: 662.2 on retest.
* Targets: 664 → 666.
* Stop: Below 659.5.
* Options: 662/664 call debit spread for a quick gamma pop.
2) Range Fade
* Trigger: Failure to clear 661.5–662 zone.
* Entry: 661 short.
* Targets: 659 → 657.
* Stop: Above 662.5.
* Options: 661P or 661/657 put spread for a fast pullback.
3) Breakdown
* Trigger: 1H close <657 with a failed retest.
* Entry: 656.8 short.
* Targets: 652 → 650.
* Stop: Back above 658.5.
* Options: 657/652 put spread for a deeper correction.
Scalping & Swing Notes
* Early session watch 659.5–662 pivot for direction.
* EMA/VWAP holds above 659.5 favor longs; repeated rejection favors shorts.
Risk & Management
* Low implied volatility makes debit spreads efficient.
* Take partials at first target and trail stops aggressively.
This analysis is for educational purposes only and does not constitute financial advice. Always trade with a plan and manage risk carefully.

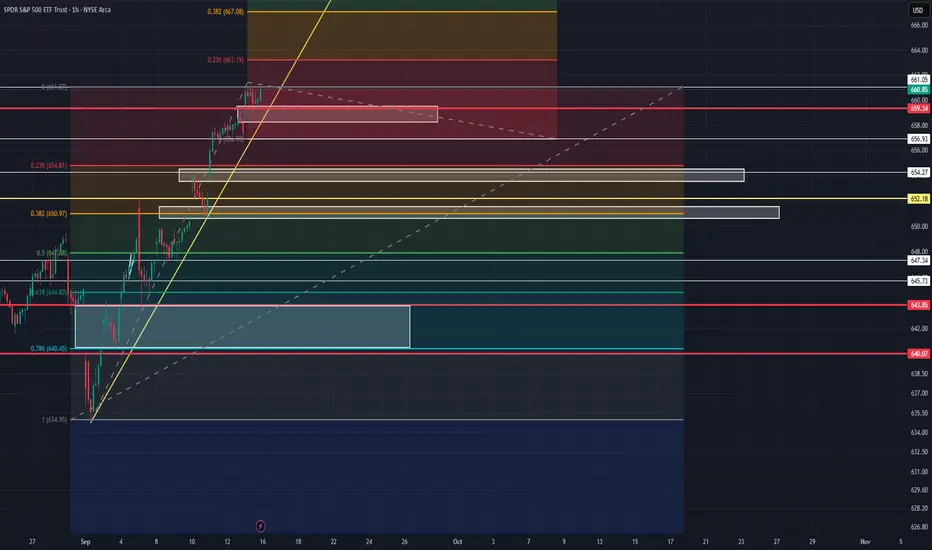
decision pointThere are some key levels on AMEX:SPY i'm marking for the rest of the week. I still feel more bearish to rate cuts and post-rate cut announcement. There has been some strong upward pressure in the last week that it seems a bit irrational that we will not hit some cool off somewhere for an unknown period of time. There are some fib extension levels I marked for possible support/ resistance. Namely, 663.19 at the .236 and 667.08 at the .382. There are points above that as well marked. For support I have 654.81 and 650.97 which both lines up well with price action support/ resistance. if we break the more macro golden trendline I will be looking to leverage into a short position to a possible profit box on the downside towards some of these levels.
Rate cuts are ALREADY priced in, again, but anything that comes out that shifts our forward-looking projections could move price now. ie. future rate cuts, hawkish, dovishness etc.
Either way technicals still want cooling off but due to heavy bear pressure and this expectation being widespread we will see shorts getting squeezed a bit and price moving erratically at times to the upside (as we have ben).
$SPY / $SPX Scenarios — Tuesday, Sept 16, 2025🔮 AMEX:SPY / SP:SPX Scenarios — Tuesday, Sept 16, 2025 🔮
🌍 Market-Moving Headlines
📉 Pre-Fed jitters: Traders square positions one day before Wednesday’s 🚩 FOMC decision + Powell presser.
💻 Mega-cap flows: Post-Apple launch chatter and AI sector sentiment keep AMEX:XLK leadership in play.
🛢️ Energy watch: Crude swings remain a headline driver for inflation hedges and $XLE.
💵 Dollar steady: FX tone reflects markets bracing for Fed clarity mid-week.
📊 Key Data & Events (ET)
⏰ 🚩 8:30 AM — Retail Sales (Aug)
⏰ 9:15 AM — Industrial Production & Capacity Utilization (Aug)
⏰ 10:00 AM — Business Inventories (Jul)
⏰ 10:00 AM — NAHB Housing Market Index (Sep)
⚠️ Disclaimer: Educational/informational only — not financial advice.
📌 #trading #stockmarket #SPY #SPX #RetailSales #Fed #Powell #economy #Dollar #bonds #oil #AAPL #megacaps
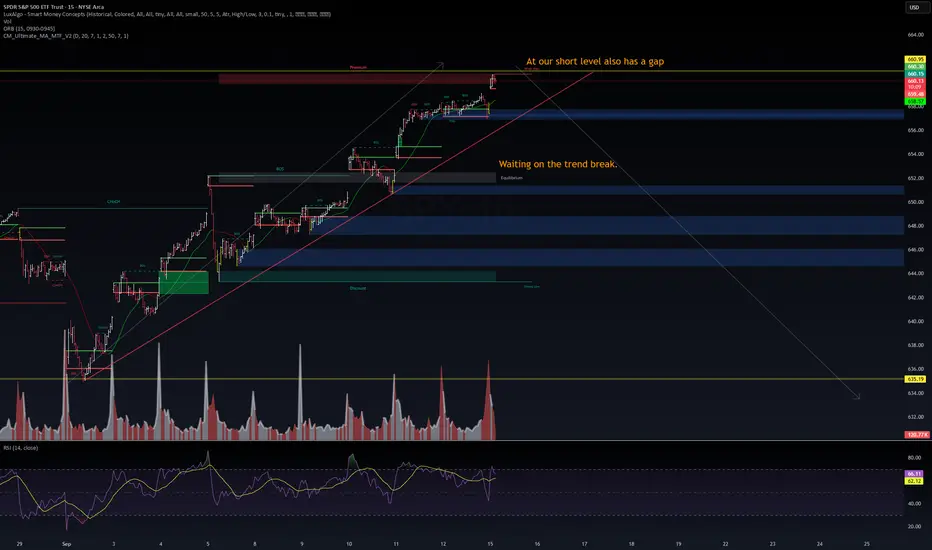
SPY 15m Analysis – Sept 15, 2025SPY is currently at our short level, which also aligns with a gap zone. Price has respected the ascending trendline, but momentum is slowing, and we’re now watching closely for a trendline break.
🔑 Key notes:
Gap + Premium zone tapped → potential reversal area.
Multiple FVGs (imbalances) below at 656 → 648 → 636 that price may revisit.
RSI showing bearish divergence, signaling weakening bullish momentum.
First downside targets: 656 → 648 → 636 if the trendline fails.
📉 Bias: Neutral → Bearish. Confirmation needed on trend break before entering shorts.
SPY Key Channel Test — Trade Setup for September 15* Macro backdrop: U.S. index futures are slightly softer after last week’s rally. Traders await mid-week economic data, leaving SPY in a tight overnight range.
* Sector tone: Tech leadership remains firm, but some rotation into value is evident, which can create intraday swings.
Technical Analysis – SPY
Trend & Structure (1-Hour Chart)
* Price is rising inside a well-defined ascending channel.
* Friday’s session closed just under $658, showing slight consolidation at the upper band.
Key Levels
* Resistance: $658.3 (current channel top), $659.1 (1st Call Wall), $661–663 (next GEX layers).
* Support: $657.2 (pivot / HVL zone), $655.5 (2nd Put Wall), $652.6 (3rd Put Wall).
Momentum & Indicators
* MACD is rolling over from highs, hinting at short-term cooling.
* Stoch RSI is near oversold, leaving room for a bounce if buyers step back in.
* Volume has tapered, which fits a pre-breakout or short pullback.
Options/GEX Insight
* GEX shows highest negative NETGEX at $657 (strong put support) and stacked call walls above $659, suggesting a tug-of-war between bulls and bears.
* IVR 10.7 and IVx avg 13.1 signal low volatility, which could amplify any breakout move.
Trade Scenarios for Sept 15
* Bullish Plan:
* Entry: Hold above $658.3 and break $659.1.
* Targets: $661 → $663.
* Stop: Below $657.2.
* Bearish/defensive:
* Entry: Drop below $657.2 with momentum.
* Targets: $655.5 → $652.6.
* Stop: Above $659.1.
Summary
SPY enters Monday at the top of its channel. A firm break over $659 could ignite a move toward $661–663, while a slip under $657.2 opens a pullback toward the mid-$650s.
Disclaimer: This analysis is for educational purposes only and does not constitute financial advice. Always do your own research and manage risk before trading.
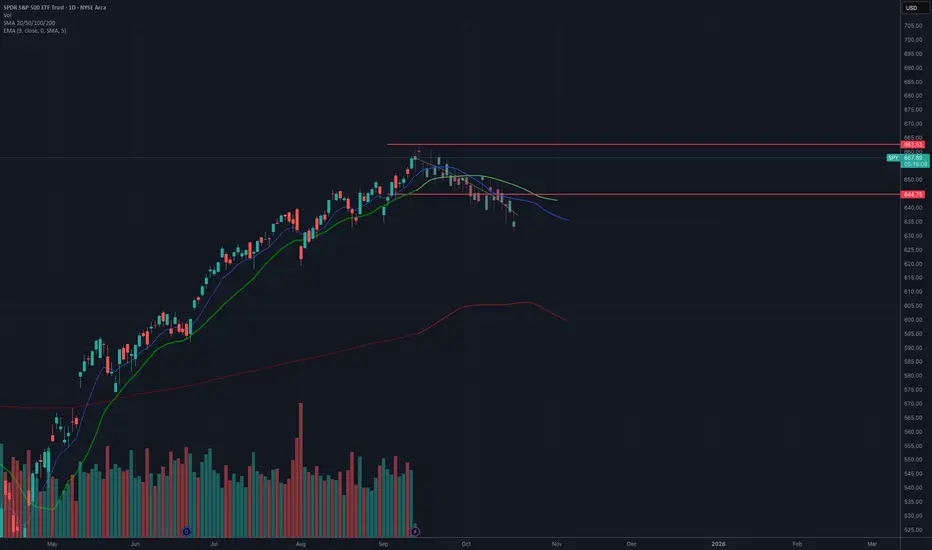
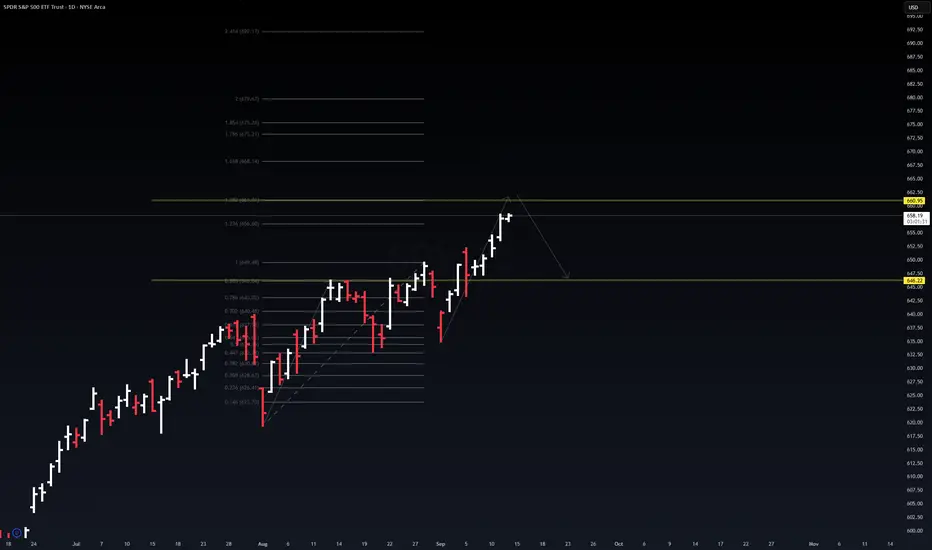
If history repeats itselfSPY continues to grind higher inside a long-term rising channel, but it’s approaching a critical decision point. We’ve already seen one 10% correction earlier this year, and the current structure suggests another possible pullback toward the rising trendline and the 0.38 FIB of the rally from April (my point “C”).
Two paths are on the table:
A short-term correction of ~10% before resuming higher.
Or a melt-up scenario that pushes price toward the 790–800 zone (point “D”) before a larger reversal.
Either way, I believe the next weeks will be decisive. Watch volume and reactions near 657–660 for clues. If support holds, bulls may still have room to run. If it breaks, we could see acceleration lower.
👉 What do you think – correction first or straight to a melt-up?


$SPY / $SPX Scenarios — Week of Sept 15 → Sept 19, 2025🔮 AMEX:SPY / SP:SPX Scenarios — Week of Sept 15 → Sept 19, 2025 🔮
🌍 Market-Moving Headlines
🌐 Global central bank ripple: ECB’s Thursday decision sets tone for USD and cross-asset flows into Fed week.
📉 Positioning tight: After CPI/PPI last week, funds are leaning light into Wednesday’s Fed — volatility risk high.
🍏 Mega-cap overhang: Apple supply chain chatter + tech sector leadership in focus post-launch event.
💵 Dollar + oil watch: Stronger dollar and stubborn crude prices remain headline risk for equities.
📊 Key Data & Events (ET)
Tue 9/16
⏰ 🚩 8:30 AM — Retail Sales (Aug)
Wed 9/17
⏰ 8:30 AM — Housing Starts & Building Permits (Aug)
⏰ 🚩 2:00 PM — FOMC Policy Decision + SEP (dot plot)
⏰ 🚩 2:30 PM — Powell Press Conference
Thu 9/18
⏰ 🚩 8:30 AM — Initial Jobless Claims (weekly)
⏰ 8:30 AM — Philadelphia Fed Manufacturing Survey (Sep)
⏰ 🚩 10:00 AM — Conference Board Leading Economic Index (Aug)
⚠️ Disclaimer: Educational/informational only — not financial advice.
📌 #trading #stockmarket #SPY #SPX #FOMC #Powell #Fed #RetailSales #jobs #economy #bonds #Dollar #oil #AAPL #megacaps
SP500 vs M2 Money Supply & U.S. Debt — The Hidden DriverA long-term monthly chart of the SPDR S&P 500 ETF Trust plotted alongside the M2 Money Supply and U.S. Government Debt.
While the SP500 has risen over 400% since 2000, M2 has grown about 390% and government debt over 560%.
This suggests much of the “market growth” is actually the result of monetary expansion and debt-driven liquidity — not true productivity gains.
What looks like soaring returns may just be a shrinking dollar.

SPY: Expecting Bearish Continuation! Here is Why:
Remember that we can not, and should not impose our will on the market but rather listen to its whims and make profit by following it. And thus shall be done today on the SPY pair which is likely to be pushed down by the bears so we will sell!
Disclosure: I am part of Trade Nation's Influencer program and receive a monthly fee for using their TradingView charts in my analysis.
❤️ Please, support our work with like & comment! ❤️

SPY BEARS WILL DOMINATE THE MARKET|SHORT
SPY SIGNAL
Trade Direction: short
Entry Level: 657.28
Target Level: 646.51
Stop Loss: 664.45
RISK PROFILE
Risk level: medium
Suggested risk: 1%
Timeframe: 4h
Disclosure: I am part of Trade Nation's Influencer program and receive a monthly fee for using their TradingView charts in my analysis.
✅LIKE AND COMMENT MY IDEAS✅

Huge Dark Pools... Will This Time be Any Different?QQQ CME_MINI:NQ1! CME_MINI:ES1! stock market Forecast
Nvidia Stock NASDAQ:NVDA Forecast
Apple Stock AAPL Forecast
Microsoft Stock MSFT Forecast
Google Stock GOOGL Forecast
Amazon Stock AMZN Forecast
Meta Forecast Technical Analysis
Tesla Stock NASDAQ:TSLA Forecast
Magnificent 7 stocks forecast

SPY Buyers In Panic! SELL!
My dear subscribers,
SPY looks like it will make a good move, and here are the details:
The market is trading on 657.41 pivot level.
Bias - Bearish
Technical Indicators: Both Super Trend & Pivot HL indicate a highly probable Bearish continuation.
Target - 650.13
About Used Indicators:
The average true range (ATR) plays an important role in 'Supertrend' as the indicator uses ATR to calculate its value. The ATR indicator signals the degree of price volatility.
Disclosure: I am part of Trade Nation's Influencer program and receive a monthly fee for using their TradingView charts in my analysis.
———————————
WISH YOU ALL LUCK

SPY Broader Market Structure (SPY 15M):
The broader direction has been bullish since the rally off 655, with price steadily making higher highs and higher lows. A BOS at 659.11 confirmed continuation, but now price is stalling near the 659–660 supply zone. This stalling action hints at a potential CHoCH if intraday lows are broken, which would open the door to deeper retracement.
Supply and Demand Zones:
The supply zone at 659–660 has already shown its strength—price tapped it and struggled, producing rejections and hesitation candles. Demand sits at 656–657, where buyers defended strongly before, and the more significant demand base is around 655, which marked the origin of the breakout. If price returns there, it would be a high-probability spot for buyers to re-engage.
Footprint Analysis (Order Flow):
The footprint inset shows heavy absorption and stacked sell imbalances near 660, with large resting sell orders repeatedly capping price. This confirms that sellers are actively defending supply, preventing buyers from pushing higher. On the buy side, earlier volume clusters around 657 show aggressive buyers stepping in with stacked buy imbalances, which aligns with the demand zone. The imbalance shift suggests that sellers currently control the top of the range, but buyers have pockets of strength lower down.
Price Action in the Marked Region:
Price is probing into supply and showing rejection wicks while the footprint confirms sell absorption overhead. The most likely scenario is a pullback toward 657 demand, where we’ll see if buyers can reload. If demand breaks, price should flush into 655, where prior aggressive buying was seen.
Trade Bias & Outlook:
The short-term trade bias is bearish, expecting a pullback into demand. The key invalidation is a clean breakout and acceptance above 660, which would flip bias bullish and open the path to 662–663.
Momentum & Candle Behavior:
Momentum is weakening for buyers—candles are showing wicks and indecision at resistance, while the footprint highlights trapped buyers and strong sell absorption. A confirming signal would be a bearish engulfing candle paired with stacked sell imbalances, showing sellers pressing control.

SPY ShortBroader Market Structure (SPY 15M):
The broader structure shows a recent bullish push that broke short-term resistance, marking a Break of Structure (BOS) at 658.48. However, the move lacks strong follow-through, and a Change of Character (CHoCH) at 657.14 remains a key downside reference point. This combination suggests the market is in a vulnerable spot—still bullish in the immediate sense but showing signs of exhaustion where a short-term pullback could develop.
Supply and Demand Zones:
The closest demand sits just above 657.00, where buyers stepped in earlier and provided a clean rally to new highs. This demand looks moderately strong since it sparked the upward impulse, but it has not yet been retested. Deeper demand is seen around 655.50, where buyers previously drove a much stronger reversal, making it a more significant zone of defense. On the supply side, resistance is forming around 658.50–659.00, where sellers capped the last advance and volume absorption is visible on the order flow chart, indicating pressure at the highs.
Price Action in the Marked Region:
Within the highlighted region, price is stalling near the upper resistance zone and showing rejection candles, suggesting that sellers are stepping in. The arrow drawn indicates expectations of a minor pullback toward the 657.80–657.00 region. If buyers defend this zone, a bounce back toward the highs is likely; however, if the level gives way, deeper testing of 655.50 demand is in play.
Trade Bias & Outlook:
The current bias is short-term bearish for a pullback into demand, with the expectation that price softens into the 657 zone before buyers potentially step back in. The invalidation level for this outlook would be a clean break and acceptance above 659.00, which would confirm buyers have regained firm control and open the path for continuation higher.
Momentum & Candle Behavior:
Momentum currently favors sellers in the very short term as rejection wicks appear at resistance and the upward moves are losing strength. A strong bearish candle close below 657.80 would confirm this pullback scenario. Conversely, absorption of sellers at the highs would negate it quickly.

Options SPY To be or not to beSPY is facing resistance and needs stronger momentum to continue its upward move. The next key target is around $662, followed by a potential pullback toward $645. These price movements are likely to carry strong momentum, influenced by the upcoming interest rate decision on Wednesday, the 17th. The idea lasts approximately 25 days.