AAL | Trend Analysis | Weekly Long idea
Note: Consistent success in financial markets requires a personalized trading strategy
*A method that specifies the type and amount of patience
*Entry and exit points
*Your customized psychology plan
*Risk management program based on your personality
________________________________________________________________________________________
Trading Rules:
Know When to Stop Trading:
There are two reasons to stop trading: an ineffective trading plan, and an ineffective trader.
An ineffective trading plan shows much greater losses than anticipated in historical testing. Markets may have changed, volatility within a certain trading instrument may have lessened, or the trading plan simply is not performing as well as expected. One will benefit from remaining unemotional and businesslike. It might be time to reevaluate the trading plan and make a few changes or to start over with a new trading plan. An unsuccessful trading plan is a problem that needs to be solved. It is not necessarily the end of the trading business.
An ineffective trader is one who is unable to follow his or her trading plan. External stressors, poor habits and lack of physical activity can all contribute to this problem. A trader who is not in peak condition for trading should consider a break to deal with any personal problems, be it health or stress or anything else that prohibits the trader from being effective. After any difficulties and challenges have been dealt with, the trader can resume.
________________________________________________________________________________________
Press Like if you like it
You are welcome to share comment
Hope this is helpful, Thank you for your support, have a great day
Trade ideas

BAC : NYSE 03/16/2020 DAILY REPORT - Trending Bear ModeSDB Select - Proprietary Market Report for...
BAC : NYSE
24.16 : 03/13/2020 : 908 ET Change: 3.65 (15.11%)
Trending Bear Mode
Report Type = Macro, End of Day
SDB Select Categories that are currently turned on:
Data Overview
Market Behavior
Transitions
Standard Analysis
Advice
Natural Attraction
Support / Resistance
SpeedView
Price Projections
ABOUT US
Strategydb's focus is to bring forth key analytics and decision support tools that the entire trading and professional investment community can use, and profit from.
DISCLAIMER
THE RISK OF LOSS IN TRADING CAN BE SUBSTANTIAL! YOU SHOULD THEREFORE CAREFULLY CONSIDER WHETHER SUCH TRADING IS SUITABLE FOR YOU IN LIGHT OF YOUR CURRENT FINANCIAL CONDITION. IN CONSIDERING WHETHER TO TRADE OR TO AUTHORIZE SOMEONE ELSE TO TRADE FOR YOU, REMEMBER THAT PAST PERFORMANCE IS NOT NECESSARILY INDICATIVE OF FUTURE RESULTS.
Market Mode of Behavior: BAC : NYSE : 24.16 : Macro: Eight specific set-ups that dictate the current trading strategy...
Currently, this market meets the Trending Bear Mode criteria. Price is trending lower.
For the entire data set this market has been in Trending Bear Mode 12.24% of the time.
The average number of bars spent in this Mode before transitioning normally = 19. Since the current number of bars in Mode = 5, this Mode of Behavior still has 14 bars to mature before meeting its average and possibly transitioning. Remember that this analysis is being performed on the bar interval.
The average price growth during this behavior is approximately = -2.29. This is compared to the current price growth of -1.55. Based upon the closing price of the most recent bar, price growth has yet to be met.
Back to Top
Transitions & Time: BAC : NYSE : 24.16 : Macro: Background on the current Mode of Behavior...
Transition from Medium Bear Mode occurred 5 bar(s) ago.
According to our signal logic, this transition occurred normally and triggered on the longest time frame.This MBETBE transition occrus infrequently.
Possessing knowledge of the preceding Mode of Behavior as well as the most likely subsequent Mode assists in executing current strategies, exits, and setups for the next trade.
Back to Top
Standard Analysis: BAC : NYSE : 24.16 : Macro: A closer look at the current Mode of Behavior...
The current bar's close at 24.16 demonstrates that prices should continue lower.
Cautionary price levels 20.46% below the market are outside the Average True Range price percentage window of 7.44%, currently lowering the short-term probability of transitioning out of Trending Bear Mode.
The Average True Range price percentage window is simply a function of the 16 bar Average True Range, divided by the underlying's closing price of the last bar. Cautionary price levels are proprietary. Prices in this region indicate possible Mode transitions.
Volatility based on the 30 day standard deviation = 85.07%. Volatility based upon the 30 day Average True Range = 1.80 points, (based upon the underlying's price scale.)
The price change versus 1 week ago = -1.55. The price change versus 1 month ago = -4.34. The price change versus 1 year ago = -11.06.
Back to Top
Advice: BAC : NYSE : 24.16 : Macro: Straight-forward wisdom on how to position for near-term profits...
Alert! Transactions in FOREX, Futures, and Stocks, carry a high degree of risk. No slippage or commissions are included here or in our Statistics tables. Your FCM will charge you a commission.
Trend trade this market from the short side.
During Trending Bear Mode competition is one sided, making buyers scarce. If you like pyramding winners, now may be your chance. (---)
Back to Top
Natural Attraction: BAC : NYSE : 24.16 : Macro: Expected tendencies and targets...
During Trending Bear Mode prices should tend towards a price structure located at 5.54.
Back to Top
Support & Resistance: BAC : NYSE : 24.16 : Macro: Specific trading levels or bands...
SPEEDVIEW TRADING WIDGET
A key level to watch, located at 31.57 is exactly 7.41 points, or 30.7% away.
Trading Band1 Level = 26.41
Trading Band2 Level = 24.61
Trading Band3 Level = 22.81
Trading Band4 Level = 21.02
Trading Band5 Level = 19.22
Trading Band6 Level = 17.42
Back to Top
Price Growth / Decay Projections: BAC : NYSE : 24.16 : Macro: Growth / decay projections...
Target#1=15.67
Distance=8.49
Move=35.1%
Target#2=5.54
Distance=18.62
Move=77.1%
Back to Top
HYPOTHETICAL PERFORMANCE RESULTS DISCLOSURE
HYPOTHETICAL PERFORMANCE RESULTS HAVE MANY INHERENT LIMITATIONS.NO REPRESENTATION IS BEING MADE THAT ANY TRADER OR ACCOUNT WILL OR IS LIKELY TO ACHIEVE PROFITS OR LOSSES SIMILAR TO THOSE SHOWN IN THIS REPORT.IN FACT, THERE ARE FREQUENTLY SHARP DIFFERENCES BETWEEN HYPOTHETICAL PERFORMANCE RESULTS, PUBLISHED DATA MINING STATISTICAL PREDICTIONS, AND THE ACTUAL RESULTS SUBSEQUENTLY ACHIEVED BY ANY PARTICULAR TRADING PROGRAM.ONE OF THE LIMITATIONS OF HYPOTHETICAL PERFORMANCE RESULTS IS THAT THEY ARE GENERALLY PREPARED WITH THE BENEFIT OF HINDSIGHT.IN ADDITION, HYPOTHETICAL TRADING DOES NOT INVOLVE FINANCIAL RISK, AND NO HYPOTHETICAL TRADING RECORD CAN COMPLETELY ACCOUNT FOR THE IMPACT OF FINANCIAL RISK IN ACTUAL TRADING.FOR EXAMPLE, THE ABILITY TO WITHSTAND LOSSES OR TO ADHERE TO A PARTICULAR TRADING PROGRAM IN SPITE OF TRADING LOSSES ARE MATERIAL POINTS WHICH CAN ALSO ADVERSELY AFFECT ACTUAL TRADING RESULTS.THERE ARE NUMEROUS OTHER FACTORS RELATED TO THE MARKETS IN GENERAL OR TO THE IMPLEMENTATION OF ANY SPECIFIC TRADING PROGRAM WHICH CANNOT BE FULLY ACCOUNTEDFOR IN THE PREPARATION OF HYPOTHETICAL PERFORMANCE RESULTS AND ALL OF WHICH CAN ADVERSELY AFFECT ACTUAL TRADING RESULTS.BECAUSE THERE ARE NO ACTUAL TRADING RESULTS TO COMPARE TO THE HYPOTHETICAL PERFORMANCE RESULTS/DATA MINING STATISTICS,REPORT READERS SHOULD BE PARTICULARLY WARY OF PLACING UNDUE RELIANCE ON THESE HYPOTHETICAL PERFORMANCE SUMMARIES.
Strategydb.com</a
Copyright 2019 All Rights Reserved SDB SELECT MARKET REPORTS.

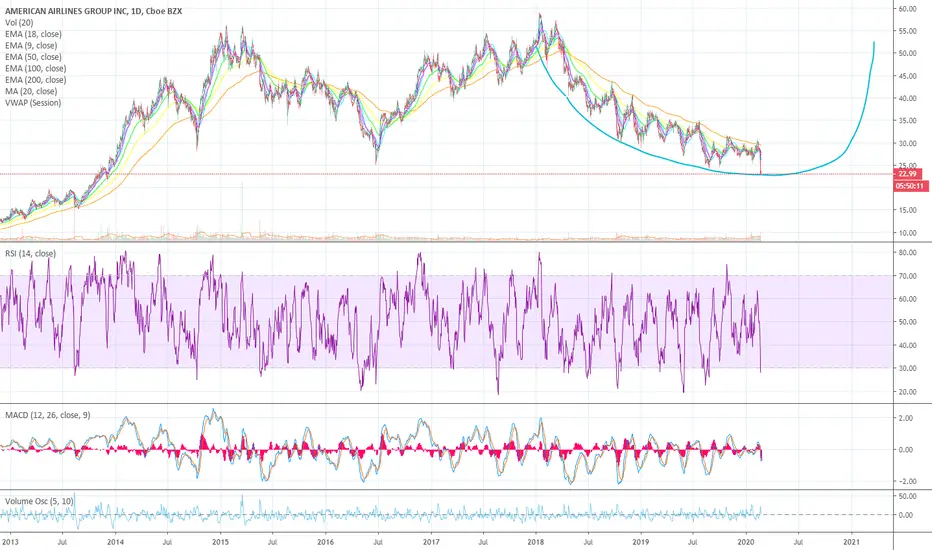
Year end target for American AirlinesLong term hold. The virus crisis will pass and people will still need to fly after.

American Airlines AAL ready to bounce yet?I've never traded airline stocks. I like AAL here though-seeing a potential broadening formation. I might consider a small position and set a target for that unfilled gap. Longer term, airline stocks appear cheap right now although I'm not ready to turn bullish on them yet. I'm just not that familiar with them.. but this looks like it has good potential.


$AAL Iron CondorHaven't posted on here in a bit. Figured I would share some plays that take advantage of the recent spike in volatility.
Airlines have taken an absolute beating, and if you put a gun to my head I would say that will continue. However I don't see it happening at the same pace and we should get a couple green days mixed in. The high IV has provided a very wide profit zone here, a range equal to nearly 50% of the underlying with only 3 weeks til expiration.
Buy: 3/20 24 Call
Sell: 3/20 22 Call
Sell: 3/20 14 Put
Buy: 3/20 12 Put
Net Credit: $52
Max Loss: $148

AAL - Double Top or M is for MurderAs COVID-19 continues to spread, travel will continue to diminish. Long Term, I believe this stock will continue a downward trend towards $10 a share through 2020.

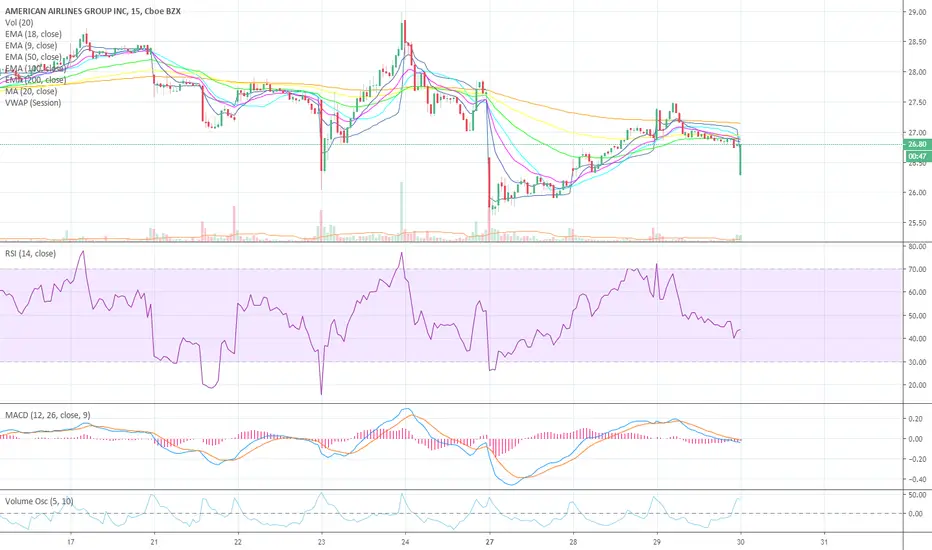
AALAmerican Airlines felt significant drop after flight cancellations and international travel decrease. Currently price is testing below annual lows and out of its previous trading range. MACD is attempting to gain some stability as the price levels attempt to find support in the massive sell off.


Now, you can own AAL for 60% discount !Since the peak almost 3 years back, the price of AAL has been nothing but down ,down , down.
So, if you have the patience to hold for years, you can make such good returns shorting as well.
Now, are we going to witness a breakout soon or will it heads lower ? It is safe to err on the side of caution since the Covid-19 virus has not subside , in fact the flame seems to be getting stronger by the day.
AAL is just one of the travel stocks that got hit though their exposure to Asia travel routes may not be as high compared to Cathay Pacific
This will be one sector that I will be researching more indepth months down the road when the virus is eliminated or a cure is found. Or at least things are much in control and people are feeling safe to travel once more. Imagine global conferences being cancelled , meetings and events business badly affected, so are the hotels, taxi business, F&B, the whole chain that are related. Note that not all events or meetings can be done online, the need for face to face meetings still very much exist in this 21st century.
Imagine the CEOs and executives not able to claim for their 5 stars accommodation and 1st class seat flight along with 3 star Michelin F&B restaurant, what will the world become ? HAHA


American Airlines hit a long term wall Weekly chart hit a long term trend line that goes back to 2018 due to this i m looking to short American Airlines

$AAL - Weekly breakout ou juste continuation de la baisse? Voici mon analyse sur $AAL :
- Actif dans une tendance baissière depuis longtemps (une correction de plus de 50%)
- Point clé au niveau du canal pouvant donner sur un breakout ou continuation pour shorter
- Un niveau short réduit à 16% hier alors que la moyenne générale est 40%
- Un bloc institutionnel important de 9mil à 28.33 (smart money) a été complété pouvant donner une volatilité plus élevé
- Moyenne mobile 200 servant de résistance niveau daily également
- Attendre un signal de breakout confirmé pour la hausse et échec du retest pour continuer la baisse.

AAL BUY (AMERICAN AIRLINES GROUP INC)Hi there.
REASONS TO BUY:
1. On bigger time frame price is forming a continuation pattern to the upside.
2. On weekly time frame price is forming a reversal pattern to change its formation. Watch strong price action at the current price for buy.