The The Great Reset and its consequences The only reason why we have the best team on this planet is to win this series in a playoff race against the worst teams of all the league in baseball! We are going through the same process and the best teams in baseball right here is to lose the game against a playoff game and lose to a playoff game
Apple Inc
No trades
Market insights

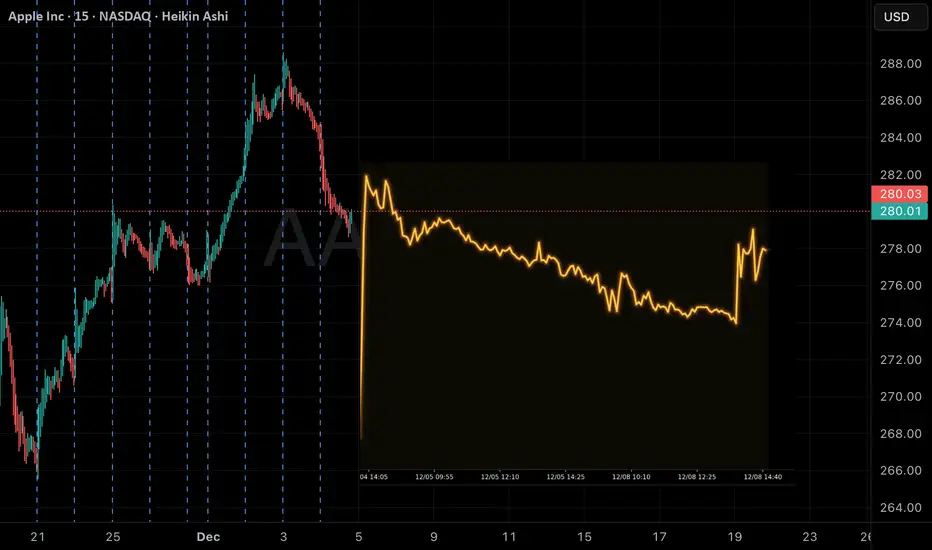
AAPL Broadening BottomWill there be a potential broadening bottom before a Santa Claus rally, or will it fail and fuel a Satan rally?

The Role of Shipping in the World MarketShipping as the Engine of Global Trade
At its core, shipping facilitates international trade by transporting goods between countries and regions. Nations differ in natural resources, labor skills, technology, and capital availability. Shipping allows countries to specialize in what they produce most efficiently and trade with others, following the principle of comparative advantage. For example, crude oil from the Middle East, iron ore from Australia, manufactured electronics from East Asia, and agricultural products from South America all move across oceans through shipping networks. This exchange promotes productivity, lowers costs, and increases the variety of goods available to consumers worldwide.
Shipping also enables large-scale trade that would be impossible through air or land transport alone. Bulk carriers transport coal, grain, and minerals in massive volumes at low cost, while container ships move manufactured goods efficiently through standardized containers. Tankers carry oil, liquefied natural gas (LNG), and chemicals, supporting global energy markets. Each shipping segment serves a specific economic purpose, together forming an integrated system that sustains the world market.
Impact on Global Supply Chains
Modern supply chains are highly complex and international in nature, relying heavily on shipping. Many products are no longer made in a single country; instead, components are sourced from multiple regions and assembled elsewhere. Shipping ensures the smooth flow of intermediate goods and raw materials between production stages. Just-in-time manufacturing, widely used in industries such as automobiles and electronics, depends on predictable and timely shipping schedules.
Disruptions in shipping—such as port congestion, geopolitical conflicts, pandemics, or canal blockages—can have immediate and widespread effects on global markets. Delays increase costs, reduce availability of goods, and contribute to inflation. The COVID-19 pandemic highlighted how critical shipping is, as container shortages and freight rate spikes affected everything from food prices to industrial production. This demonstrated that shipping is not merely a logistical function but a strategic pillar of global economic stability.
Role in Price Formation and Inflation
Shipping costs directly influence global prices. Freight rates are a significant component of the final cost of many goods, especially commodities and low-value, high-volume products. When shipping costs rise due to fuel price increases, regulatory changes, or supply-demand imbalances, these higher costs are often passed on to consumers, contributing to inflation. Conversely, efficient shipping and lower freight rates help keep prices competitive and affordable.
Shipping also plays a role in commodity price discovery and arbitrage. The ability to transport goods between markets allows traders to exploit price differences across regions, which eventually leads to price convergence. For instance, grain or crude oil can be shipped from surplus regions to deficit regions, stabilizing global prices and reducing extreme volatility.
Strategic and Geopolitical Importance
Shipping is closely linked to geopolitics and national security. Major sea routes such as the Strait of Hormuz, the Suez Canal, the Panama Canal, and the South China Sea are critical chokepoints for global trade. Any disruption in these routes—due to conflicts, sanctions, or political tensions—can have serious consequences for the world market. Countries often seek to secure maritime routes and ports to protect their trade interests and energy supplies.
Shipping is also affected by international sanctions and trade policies. Restrictions on shipping insurance, port access, or vessel movements can limit a country’s ability to trade, impacting global supply and prices. As a result, shipping companies, insurers, and governments must constantly assess geopolitical risks when operating in international markets.
Economic Growth and Employment
The shipping industry contributes significantly to global economic growth and employment. It supports millions of jobs worldwide, including seafarers, port workers, shipbuilders, logistics professionals, and maritime service providers. Ports act as economic hubs, attracting industries such as manufacturing, warehousing, and transportation. For developing countries, access to efficient shipping services is essential for integrating into global trade and achieving export-led growth.
Shipping also enables small and medium-sized enterprises (SMEs) to participate in international markets. Containerization and digital logistics platforms have reduced barriers to entry, allowing businesses to ship goods globally without owning vessels or large infrastructure.
Technological Advancements and Digitalization
Technological innovation is transforming the shipping industry and enhancing its role in the world market. Containerization revolutionized trade in the 20th century by reducing loading times and costs. Today, digitalization, automation, and data analytics are improving efficiency, transparency, and reliability. Technologies such as blockchain, electronic bills of lading, and real-time vessel tracking help reduce delays, fraud, and administrative costs.
Automation in ports and the development of smart ships are further strengthening global trade flows. These advancements allow shipping to handle growing trade volumes while maintaining cost efficiency, which is vital for sustaining global economic expansion.
Environmental and Sustainability Considerations
As shipping underpins global trade, it also faces increasing scrutiny over its environmental impact. The industry contributes to greenhouse gas emissions and marine pollution. In response, international regulations and market pressures are pushing shipping toward cleaner fuels, energy-efficient vessels, and sustainable practices. Although environmental compliance may increase short-term costs, it supports long-term stability by aligning shipping with global climate goals and ensuring its continued role in the world market.
Conclusion
The role of shipping in the world market is fundamental and multifaceted. It enables global trade, supports supply chains, influences prices and inflation, and plays a strategic role in geopolitics and economic development. Shipping connects nations, markets, and people, making globalization possible. While the industry faces challenges such as geopolitical risks, environmental pressures, and market volatility, its importance continues to grow alongside international trade. A resilient, efficient, and sustainable shipping sector is essential for the smooth functioning and future growth of the world market.

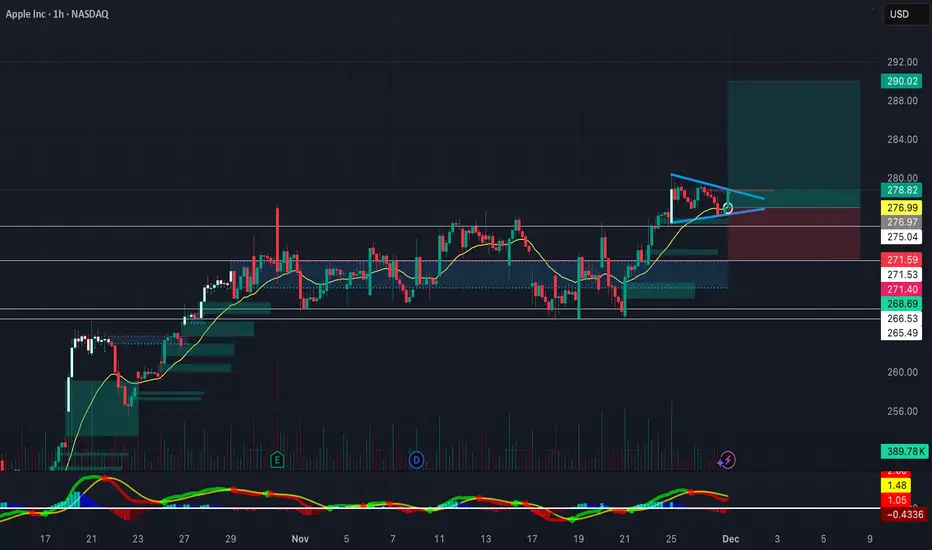
Apple Next MoveApple Index
- Rising Wedge as an corrective pattern in Short Time Frame
- Change of Characteristics
- Completed " 12 " Impulsive Waves
- Break of Structure
- Fibonacci Level - 261.80%

Hello trader, this is the result for AAPL 192.00 #2www.tradingview.com
In the first part, we discussed and marked both bullish and bearish entry points, emphasizing the importance of not anticipating entries. This is the result.

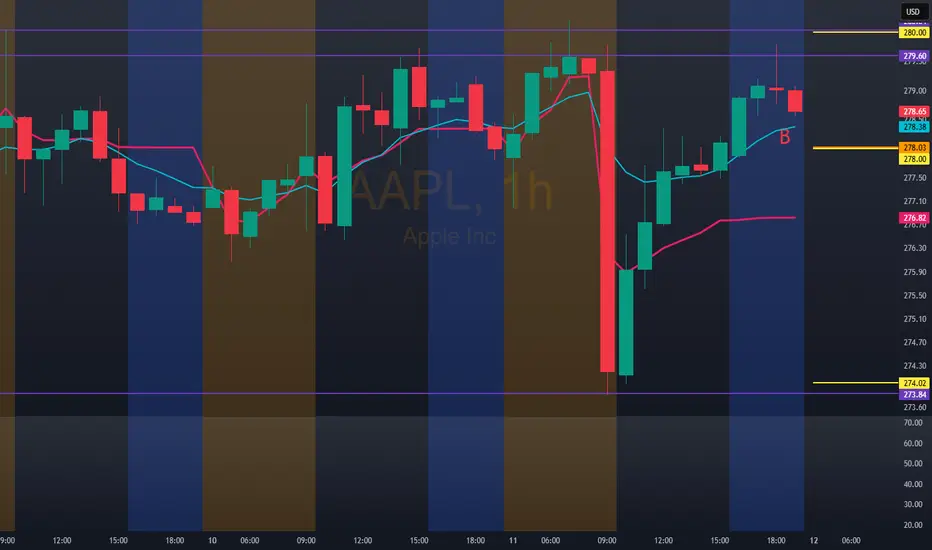
Hello trader, for this Friday we have AAPL at 278.03.After a drop today, we anticipate a bullish entry tomorrow above 282.00/284.00. If this level is reached, we could potentially take profits in the 288.00 area.
The technical bearish entry point could also act as a bounce level, but if the price falls below this point, it would confirm a quick bearish move down to the 274.00 area. If the price continues to fall, the next bearish continuation target would be 272.00/270.00.
New Setup: AAPLTo effectively trade market cycles, we need to focus on aligning with the dominant trend, mastering risk management, utilizing specific technical tools, and maintaining emotional discipline.
I got a 'setup' signal to jump into AAPL if it can breakout and close above 281.00. Keep an eye on the volume, it should be higher than the current volume (Dec.10th).

QuantSiganls V3 AAPL Call Opportunity – Jump on the Momentum!Instrument: AAPL
Direction: BUY CALLS (LONG)
Confidence: 58% (Low-Medium)
Conviction Level: LOW–MEDIUM
Expiry: 2025-12-12 (2–3 days)
Recommended Strike: $277.50
Entry Price: $2.50 (range: $2.48–$2.52)
Target 1: $3.50 (≈40% gain)
Target 2: $4.25 (≈70% gain)
Stop Loss: $1.75 (≈30% loss)
Position Size: 2% of portfolio
Weekly Momentum: NEUTRAL (+0.13% 1-week)
Flow Intel: Bullish (Low P/C Ratio, PCR 0.68)
Risk Level: HIGH – low conviction, short-term expiry, moderate gamma risk
Technical Summary:
Current price ~$278.22 in tight daily range ($276.10–$280.03)
VWAP at $277.66 provides immediate support
Resistance at $280, support at $276.10
Oversold stochastics and bullish MACD divergence signal rebound potential
News / Catalysts:
Positive analyst rating: Citigroup Buy target $330 (+19%)
Apple CEO discussions at Capitol Hill potentially favorable for regulation
Sector news mixed, no major negative catalysts
Options / Flow Summary:
Put/Call Ratio 0.68 → bullish institutional positioning
High call volume at $288 strike, low IV → cheap option premiums
Gamma risk high heading into expiration
Katy AI Notes:
Katy AI: NEUTRAL trend, 50% confidence, slight upside bias
Flow-override trade due to bullish institutional options activity and technical setup
Trading Notes / Risk Management:
Enter near VWAP support
Tight stop loss (30%) to limit downside
Monitor early price action and manage gamma exposure carefully
Consider taking profits at Target 1 if momentum stalls

AAPL 1-Month Projection: Low-Volatility Neutral PatternAAPL QuantSignals Katy 1M Prediction 2025-12-08
QuantSignals Katy AI Stock Analysis
Analyzed 1 stock(s): AAPL
AAPL Analysis
Current Price: $276.54
Final Prediction: $276.97 (+0.16%)
30min Target: $277.86 (+0.48%)
Trend: NEUTRAL
Confidence: 49.3%
Volatility: 5.7%
Summary: Generated 0 trade signals from 1 successful analyses out of 1 symbols.

AAPL BUY OPORTUNITYPrice at all time high supported with favourable iPhone 17 demand surge and rising revenue.This looks bullish in the long term. price target 360

APPL (APPLE) BUY IDEAAPPL (APPLE) BUY IDEA
📊 Market Sentiment
Market sentiment is bullish, driven by expectations of the FED’s potential rate cut in December. In addition, Trump’s likely nominee for the new FED Chair is Kevin Hassett a strong supporter of aggressive rate cuts.
This possibility has pushed markets higher as participants began pricing in earlier and more aggressive cuts for 2026.
📈 Technical Analysis
AAPL remains one of the most bullish stocks in the U.S. market. All higher timeframes are strongly bullish.
We are currently seeing a retracement from recent all time highs, which in my opinion is simply a healthy pullback to build momentum for higher prices.
📌 Game Plan
I have two key Points of Interest for potential long entries. Both support a bullish continuation thesis, and I do not expect a major bearish shift for AAPL anytime soon.
Scenario 1:
Price taps 276.25 and bounces.
I will wait for a daily bullish close to confirm the continuation.
Scenario 2:
Price dips into 271 and bounces.
I will again look for a daily bullish close as confirmation.
Note:
The FED’s rate decision will be released on Wednesday at 2 PM.
Until then, I expect price to potentially move into an accumulation or range phase.
If I see strong movement earlier in the week, I won’t hesitate to take a long position.
💬 For deeper sentiment and strategy insights, subscribe to my Substack free access available.
⚠️ This analysis is for educational purposes only and does not constitute financial advice. Always conduct your own research before trading or investing.

APPLE: Bullish Continuation & Long Signal
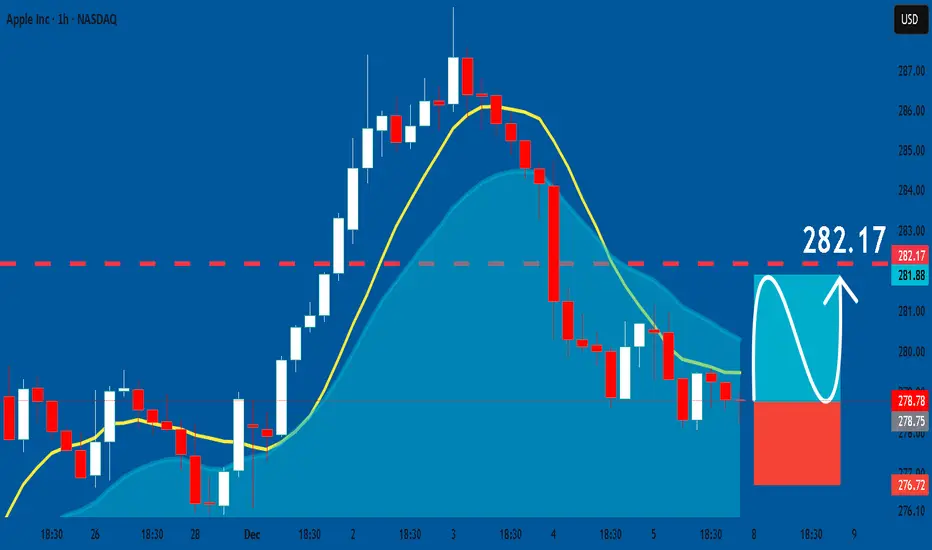
APPLE
- Classic bullish pattern
- Our team expects retracement
SUGGESTED TRADE:
Swing Trade
Buy EURUSD
Entry - 278.78
Stop- 276.72
Take - 282.17
Our Risk - 1%
Start protection of your profits from lower levels
Disclosure: I am part of Trade Nation's Influencer program and receive a monthly fee for using their TradingView charts in my analysis.
❤️ Please, support our work with like & comment! ❤️
Apple - This stock will collapse!🥊Apple ( NASDAQ:AAPL ) is reversing right now:
🔎Analysis summary:
Starting back five years ago, Apple established a major rising channel pattern. Following this channel, Apple recently created a textbook +40% move higher. But with the current retest of resistance, we will certainly see another pullback of -30% in the near future.
📝Levels to watch:
$250
SwingTraderPhil
SwingTrading.Simplified. | Investing.Simplified. | #LONGTERMVISION

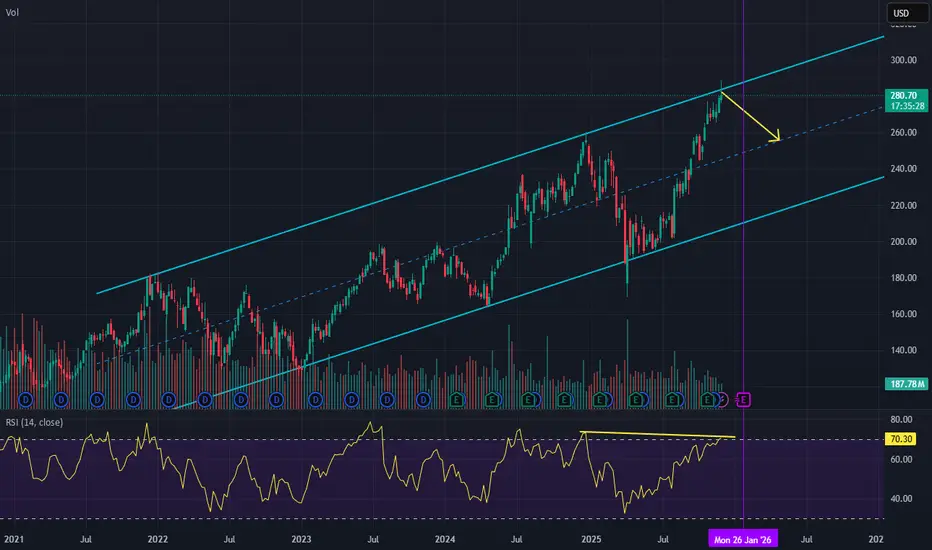
AAPL worth watching into the new yearApple Inc. has been rising steadily recently due to high iPhone demand and strong services growth (among other things), but it just hit the ceiling of a massive channel that goes back multiple years. This stock is worth watching into Christmas and the new year as it is likely to pull back or consolidate into the holidays.

APPLE Just formed its Cycle Top. Best sell opportunity is here.Almost 3 months ago (September 19, see chart below), we gave a buy signal on Apple Inc. (AAPL), which recently hit our final $290 Target:
This week we go back to the long-term 1W time-frame as the Bullish Leg (green) since the April 07 bottom just hit the top (Higher Highs trend-line) of its 4-year Channel Up.
The 2023 Bullish Leg also peaked on its 1.236 Fibonacci extension and eventually corrected back to its 1W MA50 (blue trend-line), hitting its 0.382 Fibonacci retracement level at the same time. The 2022 and early 2025 Bearish Legs even broke below the 1W MA50 and bottomed after a minimum -32.05% decline. The April 2025 bottom even hit the 1W MA200 (orange trend-line).
All of those Channel Up (Cycle) Tops have taken place while the 1W RSI broke above the overbought level (70.00). This has already taken place since last week and we also se the 1W MACD to start reversing, which is something that has also happened every time after a Top.
Based on all the above evidence (1.236 Fib hit, Channel Up top hit, 1W RSI overbought, 1W MACD reversing), we expect Apple to start a long-term correction (Bear Cycle), technically the new Bearish Leg of the 4-year Channel Up and initially make contact with the 1W MA50 and the 0.382 Fibonacci retracement level at $236.00. If the price closes a 1W candle below the 1W MA50, then we expect a second Target to be fulfilled at the bottom of the Channel Up at $200, below the 1W MA200 but still almost -32.00% from the top.
The most efficient long-term buy signal is perhaps given by the 1W RSI again, when it hits the 33.20 Support. Use that to time your buy entry accordingly.
---
** Please LIKE 👍, FOLLOW ✅, SHARE 🙌 and COMMENT ✍ if you enjoy this idea! Also share your ideas and charts in the comments section below! This is best way to keep it relevant, support us, keep the content here free and allow the idea to reach as many people as possible. **
---
💸💸💸💸💸💸
👇 👇 👇 👇 👇 👇

let's buy appleMy analysis is purely technical, supported by multiple factors:
1) We've been within an ascending channel for several months now, specifically since August. This gives us a sense of the market's general trend and allows us to identify potential retracement zones.
2) Subsequently, we can observe a descending structural pattern between October 29th and November 25th, which we can consider an accumulation zone, given the previous bullish performance in the preceding months.
3) The accumulation just described has been stopped numerous times in a specific zone that we consider resistance deriving from a psychological round number (275.00), the area described and the area colored purple.
4) As we can see, our accumulation zone has been broken upward, significantly increasing trading volumes and confirming the breakout.
5) This breakout has continued the momentum started by the November 21 candlestick until the end of the December 3 impulse. This causes a huge imbalance between buyers and sellers.
6) In my opinion, this equilibrium will be restored once a retracement of approximately 61.8% (from the Fibonacci retracement level) is made from the impulse described previously, which coincidentally is in the same zone as the psychological round number, both at the bottom of the main channel and as the last point at the top of the accumulation zone.

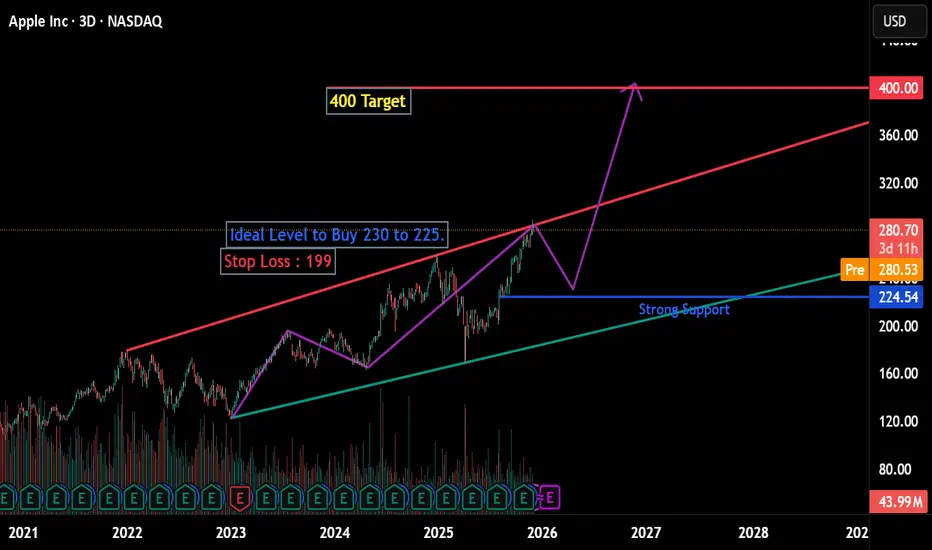
Apple : It is awaiting correctionCurrently it is at head to correction.
according to my chart reading.
ideal buy entry after correction to 225-230 if decline and come to those levels.
Target 400
SL : Below 199.
Manage your Risk .
I don't have anything to see to buy at current price.
And also I am not in favor of Short Sell.
Hitting Channel CeilingPotential downside? APPL is at the top of the range of an ascending channel, with bearish divergence forming in the RSI. Expected pull-back price to be $250s zone.
NOTE: We also have earnings in that period of time, which could further affect price action.
AAPL Alert: High-Risk Short & Explosive Call Opportunities This AAPL Weekly Signals | 2025-12-04
Short-Term Speculative PUT (2-Day Expiry)
Direction: PUT (Short)
Strike: $265.00
Entry: $0.03
Target 1 / 2: $0.05 / $0.08
Stop Loss: $0.01
Confidence: 56% (Low / Speculative)
Momentum: Neutral, bearish bias (-0.02% 1W)
Flow: Bearish, PCR 1.76
Risk: High – very small position (1% max) recommended
Notes: Katy AI shows 71% prediction points below current price, overriding weekly “BUY CALLS” guidance. High gamma risk.
Medium-Term CALL (8-Day Expiry)
Direction: CALL (Long)
Strike: $280.00
Entry: $3.30
Target 1 / 2: $5.00 / $6.50
Stop Loss: $2.00
Confidence: 57% (Low)
Momentum: Neutral (-0.13% 1W), MACD bullish divergence
Flow: Neutral, PCR 0.81
Risk: Moderate – position size 2%
Notes: Katy AI shows consistent upward trajectory to $283–$285 range. Conflict with weekly momentum; tight stop recommended.
02-2025-12-03-AAPL-Uptrend-Long-7.5AAPL:
Long Position with Uptrend
Scorecard: 7.5
S: 276.03
E: 278.20
T: 284.70
Shares: 46.08

Global Market Time Zone Arbitrage1. What Is Time Zone Arbitrage?
Time zone arbitrage refers to exploiting temporary mispricing in financial instruments caused by non-overlapping market hours. For example:
The U.S. market closes when the Asian markets are asleep.
The European market opens before the U.S., but after Asia has already moved.
Commodity futures in the U.S. may reflect global sentiment before Asian equity markets reopen.
These gaps create windows where prices adjust with a delay, allowing arbitrageurs to act quickly and capture profits.
The concept relies on the fact that markets, although globally integrated, respond to information at different times, and liquidity varies across sessions. This gives rise to price distortions that can be exploited for profit.
2. Why Time Zone Differences Create Arbitrage Opportunities
Several factors contribute to these opportunities:
A. Information Lag
When important economic data or geopolitical news is released during the closing hours of one market, the impact may not be priced into another market until it opens. Examples:
U.S. Federal Reserve announcements occur late in Asian hours.
European inflation data releases affect U.S. futures before cash markets open.
Traders who act early benefit from this information time lag.
B. Liquidity Imbalances
Liquidity varies across time zones. For example:
Asian markets often have lower liquidity for U.S.-linked ETFs.
Pre-market and after-hours trading in U.S. equities is less liquid, leading to wider spreads.
European market open tends to see high liquidity as it overlaps with Asian close.
Lower liquidity often leads to temporary distortions in pricing, ideal for arbitrage strategies.
C. Market Sentiment Spillover
Global sentiment travels through markets based on opening times:
Asian sell-offs usually influence the European open.
European movements influence U.S. futures.
U.S. closing trends flow into the next Asian session.
This chain reaction allows traders to anticipate moves and position themselves accordingly.
D. Different Valuation Models Across Regions
Investors in different regions may weigh information differently.
For example:
U.S. tech stocks heavily influence global sentiment, but Asian tech ETFs priced in local currencies may react with a delay.
European energy companies may react differently to U.S. crude price moves than American companies.
These valuation differences create price gaps.
3. Types of Time Zone Arbitrage
1. Cross-Market Equity Arbitrage
This involves using price movements in one market to predict movements in another.
Example:
U.S. NASDAQ falls 3% overnight.
Asian tech-heavy indices like Nikkei or Hang Seng tend to gap down at open.
Traders position themselves early to capture the expected gap.
2. ETF–Underlying Asset Arbitrage
Many global ETFs trade in the U.S., even when their underlying markets are closed.
Example:
The iShares MSCI Japan ETF (EWJ) trades in U.S. hours.
If EWJ falls after the Tokyo Stock Exchange closes, traders anticipate Tokyo will open lower.
Institutions buy or short the ETF after hours, then hedge positions when the underlying market opens.
3. Currency-Futures Arbitrage
Foreign exchange markets operate 24/5, but liquidity shifts across regions.
Example:
Strong U.S. economic data strengthens the USD late in U.S. hours.
Asian markets may adjust sharply at open using this new information.
Futures on currency pairs (e.g., JPY/USD) can show early reactions that are not yet reflected in related equity markets.
4. Commodity–Equity Arbitrage
Commodities like gold, oil, and copper trade nearly 24/7.
Copper price drops in the U.S. session might not immediately reflect in mining stocks in Australia until their market opens.
These mismatches create short-term arbitrage chances.
5. Index Futures vs. Cash Market Arbitrage
Index futures trade almost continuously, while cash equity markets operate only during specific hours.
Example:
S&P 500 futures drop at 2 AM during Asian hours.
Asian markets react immediately.
U.S. cash market does not reflect this drop until the New York open.
This delay produces opportunities for traders watching futures across time zones.
4. Practical Examples of Time Zone Arbitrage
A. U.S. Market Influence on Asia
Let’s say:
U.S. S&P 500 closes down 2% due to weak jobs data.
Asian markets are closed during the news release.
Asia opens and gaps down dramatically.
Traders monitoring U.S. data can pre-position in futures or ADRs (American Depositary Receipts).
B. European Market Influence on U.S. Pre-Market
Suppose:
ECB announces an unexpected rate cut at 12:45 PM CET.
U.S. markets are still hours from opening.
U.S. futures move first, followed by cash markets during the opening bell.
Knowledgeable traders arbitrage these price changes before U.S. markets react fully.
C. Gold Arbitrage Between U.S. and Asian Markets
Gold is priced globally, but miners operate regionally.
Example:
COMEX Gold drops at midnight Indian time.
Indian gold-linked equities and ETFs adjust only at market open.
This lag is a profitable window.
5. Risks In Time Zone Arbitrage
While lucrative, the strategy carries risks:
A. Unexpected News Before Market Open
Markets can reverse due to:
Overnight geopolitical events
Emergency press conferences
Central bank surprises
These can eliminate expected gaps.
B. Currency Volatility
When arbitraging international assets, currency swings can cut or reverse profits.
C. Liquidity Risks
After-hours markets often have:
Low volume
Wider spreads
High slippage
This makes execution tricky.
D. Overcrowding of Trades
Institutions and algorithms aggressively exploit these inefficiencies. When too many traders take the same position, the arbitrage window closes quickly.
6. Why Time Zone Arbitrage Still Exists Today
Despite globalization, arbitrage opportunities persist because:
Not all markets operate 24/7.
Retail sentiment spreads slower than institutional news.
Economic data releases are timed for specific countries.
Policy decisions occur during local business hours.
ETFs allow price discovery even when cash markets are shut.
These structural features ensure that time zone arbitrage will continue to remain relevant.
7. Conclusion
Global market time zone arbitrage is a sophisticated trading strategy that leverages asynchronous market hours, delayed price adjustments, and global sentiment flows. While technology has reduced many inefficiencies, markets still respond locally to global news at different times, and liquidity remains uneven across sessions. By understanding how information travels from Asia to Europe to the U.S. and back again, traders can identify profitable windows where prices have not fully adjusted.
However, success in time zone arbitrage requires speed, precision, risk management, and a deep understanding of global macroeconomics. For well-prepared traders, it remains a valuable tool for capturing short-term profits in an interconnected yet time-segmented financial world.

AAPL FlaggingNASDAQ:AAPL Flagging on the hourly, bouncing right off the 20-day EMA, expecting a push upwards to 280. If bulls can hold 280, looking for a move to the 286+ area. Watching this setup closely for a swing. Until then, some RSI-based supply and demand zones to keep an eye on, watching closely
Apple Stock Setup: Momentum and Patterns Point Toward New ATHA deep dive into Apple’s latest technical setup, analyzing MACD momentum, RSI strength, and emerging chart patterns that signal a potential breakout toward a new all-time high around $290.
