Apple Stock Setup: Momentum and Patterns Point Toward New ATHA deep dive into Apple’s latest technical setup, analyzing MACD momentum, RSI strength, and emerging chart patterns that signal a potential breakout toward a new all-time high around $290.
Apple Inc. Shs Cert Deposito Arg Repr 0.05 Shs
No trades
Market insights

AAPL — WEEK 49 TREND REPORTNASDAQ:AAPL — WEEK 49 TREND REPORT
Ticker: NASDAQ:AAPL — 12/02/2025 @ 286.19$
Timeframe: WEEKLY
This is a reactive structural classification of NASDAQ:AAPL based on the weekly chart as of this timestamp. Price conditions are evaluated as they stand — nothing here is predictive or forward-assumptive.
⸻
1) Current Trend Condition
• Trend Duration: +22 weeks (Bullish)
• Trend Reversal Level (Bearish): 265.7$
• Trend Reversal Level (Bearish Confirmation): 241.24$
• Pullback Support: 237.27$
⸻
2) Structure Health
• Retracement Phase:
Uptrend (operating above 78.6%)
• Position Status:
Healthy (price above both structural layers)
⸻
3) Temperature
Warming Phase
⸻
4) Momentum
Bullish
⸻
5) Market Sentiment
Bullish
⸻
Author’s Note
This analysis is fully reactive, not predictive. Market conditions, trend structure, and behavior are classified as they appear in real time. The objective is to identify where directional shifts first occurred, where structural integrity remains intact, and where it would begin to weaken if key levels were breached.
Predictive analysis projects outcomes that do not exist yet. Without price confirmation, prediction is built on baseless assumptions. This framework avoids that entirely by responding only to verified structural changes and live conditions.
The levels shown simply identify where the current trend structure first shifted and where it would begin to lose integrity if breached. Recognizing these boundaries allows for clearer interpretation of market behavior without relying on forward guarantees, speculative projections, or unsupported assumptions.
⸻
Methodology Overview
This classification framework evaluates directional conditions using internal trend-interpretation logic that references price behavior relative to its structural layers. These relationships are used to identify when price movement aligns with the framework’s criteria for directional phases, transition points, or regime shifts. Visual elements or structural labels reflect these internal interpretations, rather than explicit trading signals or preset indicator crossovers. This framework is observational only and does not imply future outcomes.

Apple May Be AcceleratingApple spent November quietly consolidating, and it may be accelerating in December.
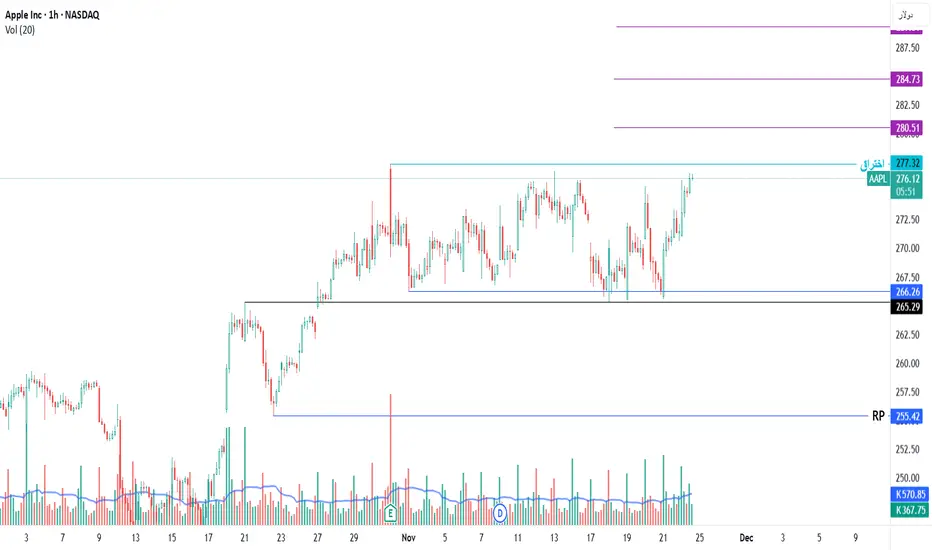
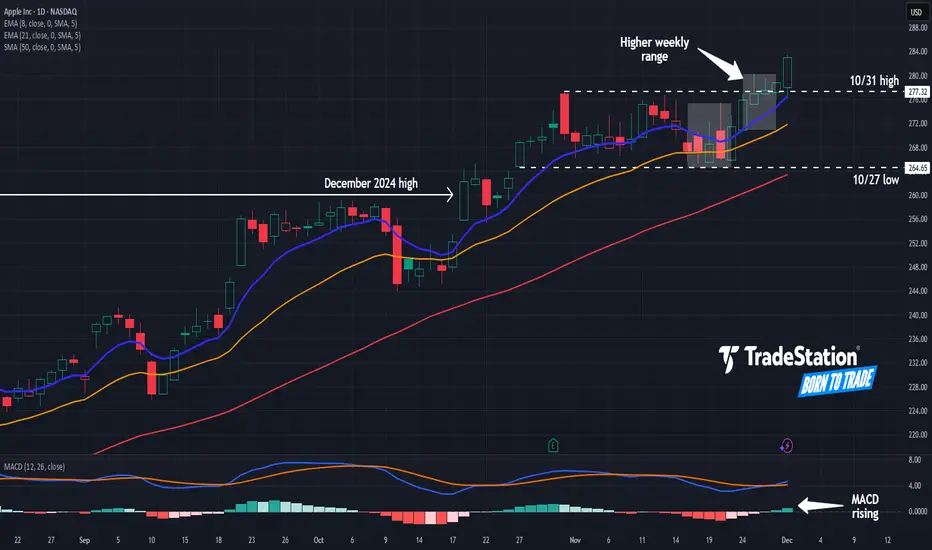
The first pattern on today’s chart is the $260.10 level, a previous all-time high from December 2024. AAPL crossed above that price in late October and has remained there since, which could mean old resistance has broken.
Second, the smartphone giant made a weekly low of $264.65 on October 27. It’s remained above that level since. That may suggest that new support has been established.
Third, last week’s range featured a higher high and a higher low relative to the previous week. The stock also closed above a previous high of $277.32 from October 31.
Such price action is potentially consistent with a gradual breakout.
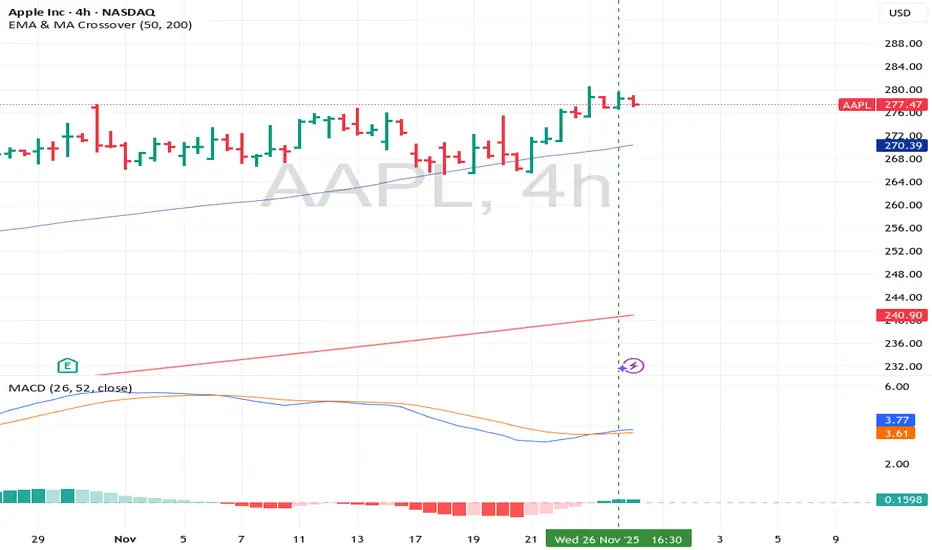
Next, the stock is above its 50-day simple moving average and its 8-day exponential moving average (EMA) is above its 21-day EMA. MACD is also rising. Those signals may reflect a bullish trend.
Finally, AAPL is a highly active underlier in the options market. (Its average daily volume of 808,100 contracts ranks fifth in the S&P 500, according to TradeStation data.) That may help traders take positions with calls and puts.
TradeStation has, for decades, advanced the trading industry, providing access to stocks, options and futures. If you're born to trade, we could be for you. See our Overview for more.
Past performance, whether actual or indicated by historical tests of strategies, is no guarantee of future performance or success. There is a possibility that you may sustain a loss equal to or greater than your entire investment regardless of which asset class you trade (equities, options or futures); therefore, you should not invest or risk money that you cannot afford to lose. Online trading is not suitable for all investors. View the document titled Characteristics and Risks of Standardized Options at www.TradeStation.com . Before trading any asset class, customers must read the relevant risk disclosure statements on www.TradeStation.com . System access and trade placement and execution may be delayed or fail due to market volatility and volume, quote delays, system and software errors, Internet traffic, outages and other factors.
Securities and futures trading is offered to self-directed customers by TradeStation Securities, Inc., a broker-dealer registered with the Securities and Exchange Commission and a futures commission merchant licensed with the Commodity Futures Trading Commission). TradeStation Securities is a member of the Financial Industry Regulatory Authority, the National Futures Association, and a number of exchanges.
Options trading is not suitable for all investors. Your TradeStation Securities’ account application to trade options will be considered and approved or disapproved based on all relevant factors, including your trading experience. See www.TradeStation.com . Visit www.TradeStation.com for full details on the costs and fees associated with options.
Margin trading involves risks, and it is important that you fully understand those risks before trading on margin. The Margin Disclosure Statement outlines many of those risks, including that you can lose more funds than you deposit in your margin account; your brokerage firm can force the sale of securities in your account; your brokerage firm can sell your securities without contacting you; and you are not entitled to an extension of time on a margin call. Review the Margin Disclosure Statement at www.TradeStation.com .
TradeStation Securities, Inc. and TradeStation Technologies, Inc. are each wholly owned subsidiaries of TradeStation Group, Inc., both operating, and providing products and services, under the TradeStation brand and trademark. When applying for, or purchasing, accounts, subscriptions, products and services, it is important that you know which company you will be dealing with. Visit www.TradeStation.com for further important information explaining what this means.
AAPL Listen to the "BRAIN"1. The "Breathing" Cloud (Changing Thickness)
The changing thickness of the White Cloud is the most important visual cue. Think of it as the "Lungs" of the Trend.
Expansion (Thickening Cloud):
What it means: The "Fast Core" (Cyan) is pulling away from the "Slow Core" (Magenta).
Analysis: This indicates Momentum Acceleration. The market is moving faster than its baseline. This is a "High Confidence" phase where you want to be aggressively holding or adding to positions.
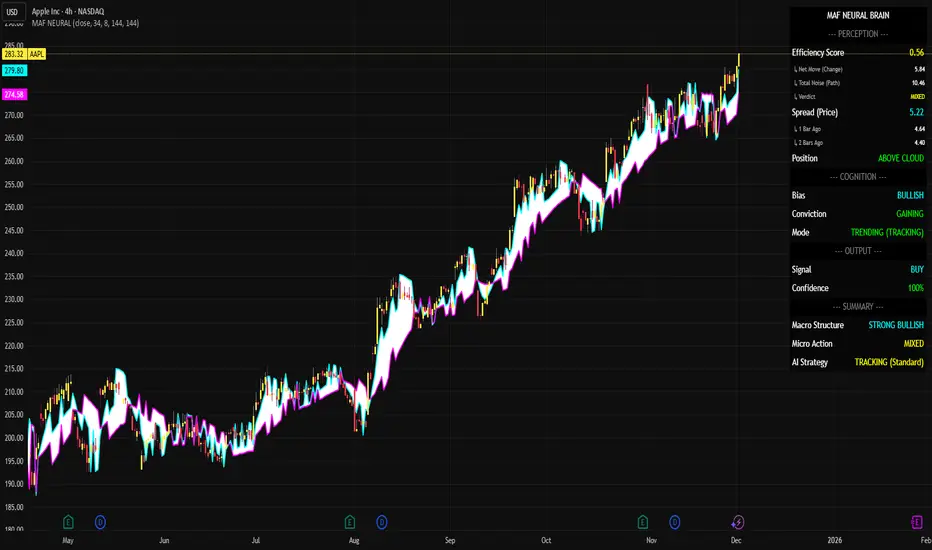
On Chart: You can see massive expansions during the rallies (May, June, Oct). The cloud gets huge, signaling a "Power Trend".
Contraction (Thinning Cloud):
What it means: The cores are converging (pinching together).
Analysis: This indicates Momentum Deceleration or Consolidation. The market is "exhaling" or taking a rest.
On Chart: Notice how the cloud gets very thin before the trend either reverses or explodes again. A thin cloud is a "Decision Point".
2. Dashboard Analysis (The "Brain")
The Dashboard confirms what the Cloud is showing visually:
Spread (Price): 5.77: This is a Wide Spread.
Verdict: The trend is currently Expanded. It is not in a "compression" phase; it is in a "run" phase.
Efficiency Score: 0.56 (MIXED):
Verdict: While the trend is up, the price action isn't a straight line. It's a bit "choppy" or "grinding" (Mixed). It's not a "Clean Trend" (0.8+), but it's not "Noise" (<0.3) either.
AI Strategy: TRACKING (Standard):
Verdict: Because the trend is Strong (Wide Spread) but the action is Mixed, the AI decides the best course of action is simply to Track it. Don't get shaken out by the wiggles, but don't be too aggressive. Just trail your stop.
Summary
Current Status: STRONG BULLISH TREND. Action: HOLD. The Cloud is thick (High Momentum), and the Dashboard is signaling "Strong Bullish". Even though the Efficiency is "Mixed" (some minor chop), the sheer width of the cloud protects you from getting stopped out prematurely. Ride the expansion.
AAPL Weekly Put Play – High-Probability Reversal Setup AAPL Weekly Signal | 2025-12-01
Instrument: AAPL
Signal Type: Weekly Swing
Direction: BUY PUTS (SHORT)
Confidence: 58%
Conviction Level: Speculative
Expiry: 2025-12-05 (4 days)
Recommended Strike: $280.00
Entry Price: $1.24 (midpoint)
Profit Target 1: $2.48 (100% gain)
Profit Target 2: $3.72 (200% gain)
Stop Loss: $0.62 (50% loss)
Position Size: 2% of portfolio (speculative due to low conviction)
Weekly Momentum: NEUTRAL (+0.82%)
Options Flow: Bearish (High Put/Call Ratio, 1.78)
Risk Level: HIGH – low confidence, short expiry, high theta decay, overbought RSI
Analysis Summary:
Katy AI Prediction: Downward trend from $281.12 → $278.32 (-1.05%), with 78% of predictions below current price. Average target $277.71 (-1.21%).
Technical: Extremely overbought (RSI 83.8), VWAP support $277.96, near weekly high (96% range).
News/Market Context: Neutral to slightly negative; Silver squeeze and rising yields create pressure.
Options Flow: Institutional puts heavily bought; maximum volume at $228 put.
Key Notes:
Weekly directional guidance suggested BUY CALLS, but Katy AI shows strong bearish trajectory.
Extreme caution due to low AI confidence (50%) and short expiry.
Consider partial profits at Target 1 to mitigate theta decay.
Stop loss at 50% to limit downside.
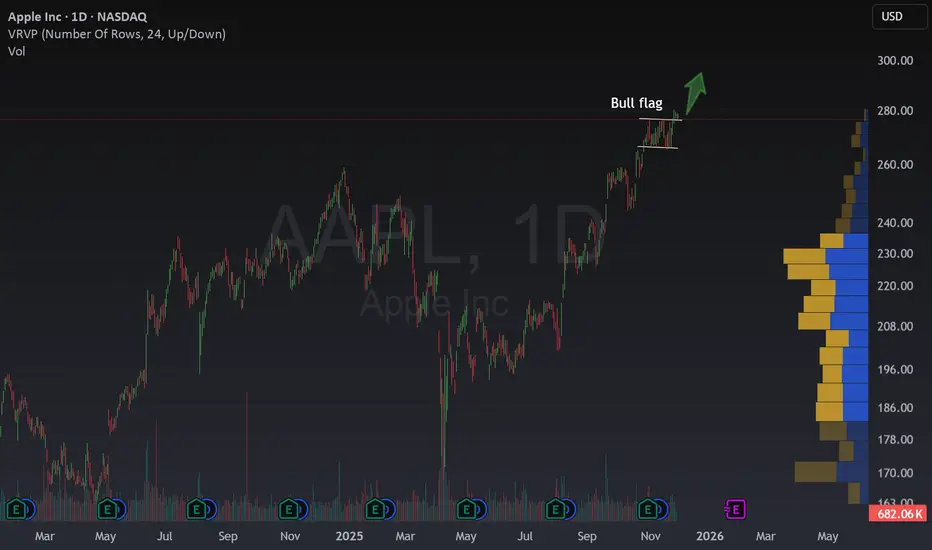
How To Trade a Bull Flag and The AAPL OpportunityHow To Trade a Bull Flag and The AAPL Opportunity
Have you ever felt stuck waiting for the perfect trade?
Apple just gave us a rare gift. After a strong rally, the price stopped and drew two parallel lines, each with two clear touches. This is what we call a bull flag. It looks simple, but it means a lot.
What Does This Pattern Tell Us?
A bull flag warns us that the market paused to take profits . It is a sign the bulls are resting, but planning to push again .
We got confirmation!
Apple made new highs, breaking out in a surprising way. The price pulled back, giving careful traders a low-risk chance to join.
This rarely happens so quickly.
If price drops below the bull flag, that’s a mega bearish sign, and a stop-loss is a must .
Above , there’s no clear limit. If stats play out, the move could be 5% or more in just a few days.
Why Is This Setup Special?
This is not our first bull flag. Recently, NYSE:JNJ flashed one and rallied 7% fast.
NYSE:LLY had an even bigger run, jumping 27% in under a month , and it still hasn’t stopped.
Bull flags are really simple but rare. If you find one, wait for confirmation, manage risk, and be ready to act fast.
In my profile, you will find guides to spot and trade bull flags easily , turning tough moments into real opportunities.
$AAPL to 300The given parallels indicate a rising channel chart pattern, with 7 points, bouncing at the 7th indicating an uptrend breakout, my opinion is bullish.

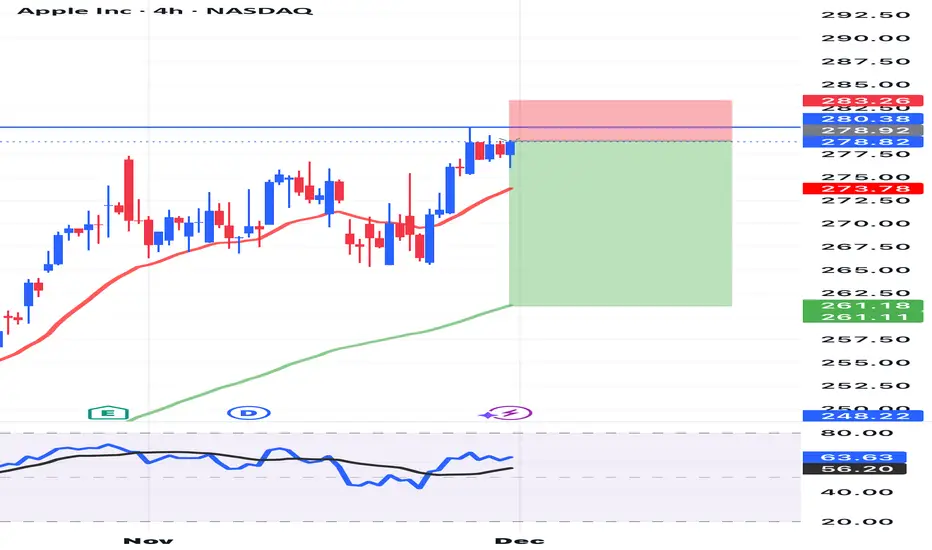
APPLE The Target Is DOWN! SELL!
My dear subscribers,
This is my opinion on the APPLE next move:
The instrument tests an important psychological level 278.82
Bias - Bearish
Technical Indicators: Supper Trend gives a precise Bearish signal, while Pivot Point HL predicts price changes and potential reversals in the market.
Target - 274.28
About Used Indicators:
On the subsequent day, trading above the pivot point is thought to indicate ongoing bullish sentiment, while trading below the pivot point indicates bearish sentiment.
Disclosure: I am part of Trade Nation's Influencer program and receive a monthly fee for using their TradingView charts in my analysis.
———————————
WISH YOU ALL LUCK

AAPLHow to become successful in forex and stock trading: 1.Master fundamentals and technical analysis. 2,Build and follow a solid trading plan. 3.Apply strict risk management (1–2% rule). 4.Stay disciplined—control fear and greed. 5.Record and analyze every trade. 6.Focus on high-quality setups only. 7.Diversify across assets and markets. 8.Keep evolving—study, adapt, and grow daily.
AAPL Outlook — Dec 1 to Dec 5AAPL Outlook — Dec 1 to Dec 5
(Price Action + Multi-Timeframe Story + GEX for Options Traders)
Weekly timeframe
The weekly chart still holds its long-term uptrend, but you can tell momentum is cooling off. The candles are getting smaller as price pushes toward the upper trendline, which usually means buyers are running into an area where profit-taking becomes more attractive. Nothing bearish yet—just a sign that the push is losing steam.
Daily timeframe
The daily view fits that slowdown perfectly. Price is sitting right inside a supply zone that was created during the last big push. Ever since AAPL entered this zone, the market hasn’t shown a strong follow-through candle. Instead, it’s been chopping inside 276–280.
The first little shift in character already appeared, which tells you sellers are at least testing the waters.
The weekly hints “momentum is fading,” and the daily basically confirms, “yes, we’re stuck under some pressure.”
1-Hour timeframe
Dropping into the 1H makes the battle more obvious. Price keeps rejecting the same ceiling near 279–280 again and again. Even though the trendline from below is still supporting the move, the highs are getting slightly lower each attempt. That’s usually the first sign that buyers are defending, but they’re not dominating anymore.
So now all three timeframes are telling the same story:
Uptrend intact → momentum slowing → pressure at the top.
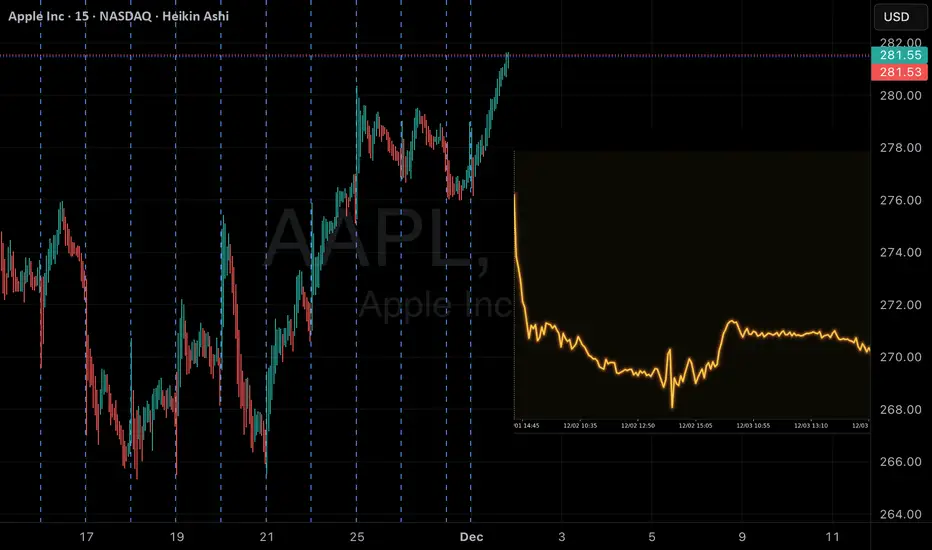
15-Minute timeframe
The 15m chart is where you can really see how tight things have become.
Price is compressing right underneath that ceiling. Volume is tapering off, candles are getting smaller, and every bounce looks weaker than the last.
This kind of behavior usually means the market is coiling up for a move—either a clean breakout above 280 or a release to the downside if the base around 277.50 gives out.
The smaller the timeframe, the more it reveals what the bigger timeframes were already hinting.
Where GEX Fits Into All of This (the real edge)
Now here’s where everything clicks:
All timeframes point to the same resistance near 279–280.
When you overlay the options data, the biggest call wall also sits right there. That’s the level where dealers hedge the most aggressively, which naturally creates resistance—and it just so happens to line up with the zones that the charts have already shown.
Below that, the negative gamma area starts opening up around 276–274.
This means that if price slips under that base, dealers shift into selling hedges, which increases volatility and makes pullbacks move faster.
So the charts show the structure…
GEX shows the “fuel” behind the structure.
That’s why I like combining them: the price action tells the story, and GEX tells you who’s on the other side of the trade.
Trading Bias for the Week (Options + Price Action)
Upside idea
Only valid if 280 breaks clean. If that happens, the next magnet is around 282.5 where the next batch of calls cluster.
Downside idea
If 277.50 cracks, the move usually releases toward 276, then 274.
That lines up with both the lower timeframe CHoCH and the negative gamma pocket.
Final Thoughts
Each timeframe is showing the same thing, just in different levels of detail: the trend is still healthy, but buyers are clearly struggling at the top. GEX reinforces why price behaves that way and gives option traders the roadmap for the week.
Disclaimer:
This is not financial advice. This is just my personal market observation and for educational use only.

What others are not going to tell ou about Bitcoin [weekly analy📉 Bitcoin Correction & Crypto Market Analysis — Dec 2025
YouTubers, I have a channel on Trading View — don’t forget to subscribe! In this video, I share my thoughts on Bitcoin and why I call the recent move a correction, not a meltdown. Many holders are upset, but as I’ve shown in previous videos, Bitcoin formed five Elliott Waves, broke a trend line, and went parabolic — faster than most could catch.
What I Cover:
Bitcoin price testing the SMA & EMA on weekly and daily charts
Why a rising wedge suggests the price could go lower before moving up
Analysis of XRP and its potential double top formation
Overview of major forex pairs, including Euro/USD and Aussie Kiwi
Technical check on S&P 500 & major stocks: Microsoft, Meta, Amazon, Tesla, and Apple
My realistic take on bullish vs. bearish possibilities — 60% bearish, 40% bullish for stocks
Guidance on how to read charts carefully and avoid hype-driven decisions
⚠️ Disclaimer: This is not financial advice. I’m sharing my personal analysis and ideas — do your own research before making any decisions.
Subscribe and stay tuned if you want to learn real market insights and profit from careful technical analysis.

AAPL SELLERS WILL DOMINATE THE MARKET|SHORT
AAPL SIGNAL
Trade Direction: short
Entry Level: 278.86
Target Level: 262.87
Stop Loss: 289.53
RISK PROFILE
Risk level: medium
Suggested risk: 1%
Timeframe: 6h
Disclosure: I am part of Trade Nation's Influencer program and receive a monthly fee for using their TradingView charts in my analysis.
✅LIKE AND COMMENT MY IDEAS✅

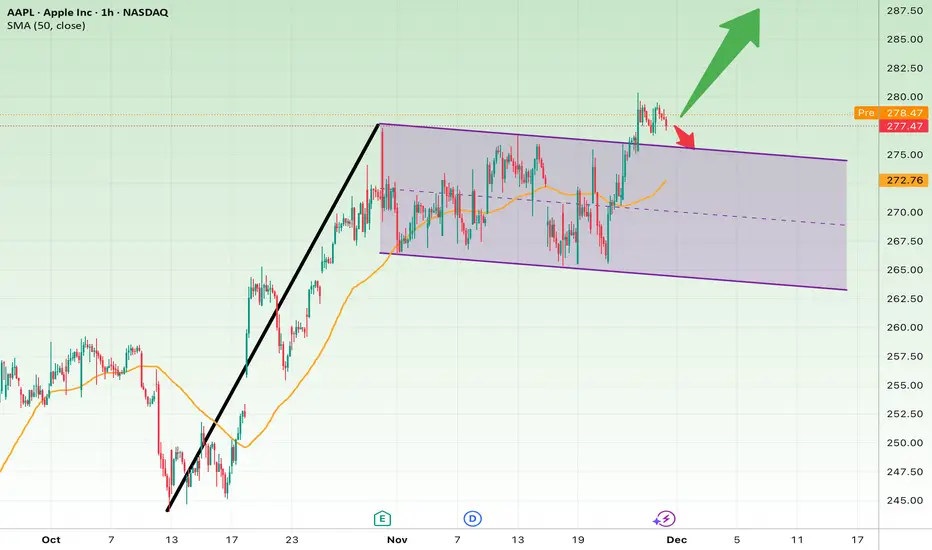
AAPL Breaks Out: Bull Flag Targets Point to $287–$295!After a strong rally (black trendline), AAPL entered a descending corrective channel, which looks like a classic bull flag pattern.
Now the price is breaking above the upper boundary of the channel, suggesting that the correction may be over.
Bullish Scenario (More likely now)
If the price holds above the channel, continuation upward is expected.
Bullish Targets:
• $282
• $287
• $295 (extended target)
Bearish Scenario (Failed breakout)
If price falls back inside the channel, the correction resumes.
Bearish Targets:
• $273
• $268
• $262 (major support)
Stop Loss
• Long: Below $274
• Short: Above $280.50
AAPL - Correction ahead?Bearish Scenario for AAPL (4H Analysis)
AAPL is currently trading at an extended level after a steep multi-week rally. The structure is forming a potential rising wedge, which typically signals trend exhaustion and an increased risk of a corrective move.
Key Breakdown Trigger
A confirmed break below 270 USD (4H close) would invalidate the current short-term uptrend and open the door for a deeper correction.
Downside Levels to Watch
260–262 USD
First major support zone. A retest here would be a normal pullback in the broader uptrend.
248–250 USD
Weekly orderblock + strong horizontal support.
If price reaches this zone, increased buying interest is likely — but if it fails, downside pressure accelerates.
237 USD
High-confluence structural level.
This is the most probable target in a more significant correction.
223–224 USD (Weekly Low)
Only relevant if the market enters a broader risk-off phase.
Bearish Confluence Factors
Sharp overextension from mid-trend support
Momentum weakening after parabolic move
Declining volume while making new highs
Rising wedge structure tightening
Summary
AAPL remains bullish on higher timeframes, but the risk of a larger corrective move is elevated. Losing 270 USD would likely trigger a multi-level retracement toward 260 → 250 → 237.

Overview of Global Financial Markets1. Structure and Types of Financial Markets
Financial markets are broadly classified into capital markets, money markets, and derivatives markets.
Capital markets are designed for long-term funding and include the equity markets, where companies raise capital by issuing shares, and the bond markets, where governments and corporations raise funds through debt instruments. Equity markets, such as the New York Stock Exchange (NYSE) and the London Stock Exchange (LSE), provide platforms for investors to trade shares, influencing corporate governance and investment flows. Bond markets, by contrast, serve as a critical tool for raising long-term financing at relatively lower costs.
Money markets deal with short-term debt instruments, generally with maturities of less than one year. These include Treasury bills, commercial papers, and certificates of deposit. Money markets provide liquidity management tools for governments, financial institutions, and corporations. Their importance is particularly highlighted during periods of financial stress, where central banks often intervene to stabilize short-term interest rates.
Derivative markets involve financial instruments whose value is derived from underlying assets such as stocks, bonds, currencies, or commodities. Derivatives include futures, options, and swaps, which are extensively used for hedging risks or speculative purposes. These markets play a crucial role in risk management but also introduce complexities and systemic risks, as observed during the 2008 financial crisis.
2. Key Components and Participants
Global financial markets comprise a variety of participants, including retail investors, institutional investors, banks, insurance companies, hedge funds, and sovereign wealth funds. Institutional investors often dominate trading volumes and have significant influence over market movements due to the scale of their investments. Central banks, as regulators and participants, shape market expectations through monetary policies, liquidity management, and intervention in currency and bond markets.
Financial intermediaries, such as investment banks, brokers, and asset managers, facilitate market operations by providing liquidity, price discovery, and risk management services. Their role is critical in connecting borrowers and lenders, particularly in capital markets, ensuring efficient allocation of resources.
3. Role of Global Financial Markets
Global financial markets perform several vital economic functions:
Capital Allocation – They enable businesses, governments, and other entities to mobilize resources for productive investments. Efficient allocation ensures that capital flows to the most promising sectors, fostering innovation, economic growth, and employment generation.
Price Discovery – Through the interaction of supply and demand, financial markets determine prices for financial instruments, which reflect market expectations, risk perceptions, and macroeconomic conditions.
Liquidity Creation – Markets provide mechanisms for investors to convert assets into cash quickly, offering flexibility and reducing financial frictions.
Risk Management – Derivative markets allow participants to hedge against adverse price movements, interest rate fluctuations, or currency risks, thus mitigating potential financial losses.
Economic Indicators – Market movements serve as barometers for economic health. Equity indices, bond yields, and commodity prices provide real-time signals about investor sentiment, inflation expectations, and economic stability.
4. Globalization and Interconnectedness
In the contemporary era, financial markets are highly globalized, interconnected, and technologically driven. Events in one region can trigger ripple effects worldwide. For example, a liquidity crisis in the U.S. can influence bond yields in Europe, stock markets in Asia, and currency valuations globally. Cross-border capital flows, foreign direct investments, and multinational financial institutions have intensified this interdependence.
Globalization has brought efficiency and opportunities but also systemic risks. Financial contagion, where crises spread across countries, is a notable concern. The 2008 Global Financial Crisis demonstrated how interlinked markets, complex derivatives, and excessive leverage can transmit shocks globally, emphasizing the need for coordinated regulatory oversight.
5. Technological Advancements
Technological innovation has revolutionized financial markets. Electronic trading platforms, algorithmic trading, and high-frequency trading (HFT) have increased trading speed, liquidity, and accessibility. Retail investors can now access global markets with minimal friction, and data analytics provide insights for better investment decisions.
Blockchain technology and cryptocurrencies represent another transformative trend, introducing decentralized financial systems that operate independently of traditional banks. While these innovations present new opportunities, they also pose regulatory and risk management challenges, particularly regarding security, volatility, and legal frameworks.
6. Regulatory Framework
Financial markets operate under stringent regulations to ensure transparency, stability, and investor protection. Regulatory bodies like the U.S. Securities and Exchange Commission (SEC), European Securities and Markets Authority (ESMA), and the Securities and Exchange Board of India (SEBI) establish rules governing market conduct, disclosure norms, and financial reporting.
Global coordination among regulators is critical, especially in derivative markets and cross-border capital flows, to prevent market manipulation, systemic risk, and financial crises. International bodies such as the International Monetary Fund (IMF), Bank for International Settlements (BIS), and the Financial Stability Board (FSB) facilitate dialogue, set standards, and monitor global financial stability.
7. Current Trends and Challenges
Global financial markets face several emerging trends and challenges:
Rising Market Volatility – Geopolitical tensions, trade wars, and economic uncertainty contribute to unpredictable price swings, affecting investor confidence.
Sustainable and ESG Investing – Environmental, social, and governance (ESG) considerations are increasingly shaping investment decisions. Green bonds, ESG-focused funds, and socially responsible investing (SRI) are gaining prominence.
Monetary Policy Impact – Central banks’ policies, including interest rate changes and quantitative easing, have profound effects on asset prices, liquidity, and capital flows.
Cybersecurity and Fraud Risks – With digitization, financial markets are vulnerable to cyberattacks, hacking, and data breaches, necessitating robust cybersecurity protocols.
Climate and Environmental Risks – Climate change and environmental events can disrupt financial markets by affecting insurance, commodity prices, and investment returns.
8. Conclusion
Global financial markets are complex, dynamic, and interconnected systems that facilitate capital formation, risk management, and economic growth. Their evolution is shaped by technological innovation, regulatory frameworks, globalization, and changing investor preferences. While offering opportunities for wealth creation and efficient capital allocation, they also pose systemic risks, requiring prudent oversight, risk management, and adaptive strategies.
Understanding the interplay of market structures, participants, and external factors is crucial for investors, policymakers, and businesses navigating this intricate landscape. As the world becomes increasingly interconnected, the stability, transparency, and efficiency of global financial markets will remain vital for sustaining economic development and financial resilience worldwide.
#1 Rocket Booster Strategy: Stop the Noise. Catch the Breakouts🚀 The Rocket Booster Strategy: Stop the Noise. Catch the Breakouts. Win Big.
In the markets, real opportunities don’t come from hype.
They don’t come from fake gurus shouting “Buy Nvidia!”
They don’t come from chasing whatever stock is trending on social media.
Real opportunities come from price action, institutional sentiment, and clean structure — not noise.
And that’s exactly why I developed the Rocket Booster Strategy.
🔥 Why Breakouts Matter
When price hits new highs, above the 50 EMA, and above the 200 EMA, something powerful is happening behind the scenes:
👉 Institutions are buying.
Pension funds… hedge funds… asset managers… smart money.
They move the markets — not retail traders.
So when price stays above both major EMAs and pushes to new highs, it signals:
strong momentum
strong sentiment
strong money flow
…and usually a small intraday correction before the next jump.
That’s your opportunity window.
🚫 The Fake Guru Problem
Every day online:
❌ Someone says Nvidia is the “next big buy.”
❌ Someone screams that AI stocks will pump forever.
❌ Someone gives you a hot tip with zero framework.
Let’s be honest:
Nvidia is NOT the magical buy everyone claims.
AI hype is fading.
The cycle is shifting.
You either evolve — or get liquidated with the crowd.
🚀 Enter: The Rocket Booster Strategy
This strategy cuts out noise, hype, and emotions.
It focuses on pure market structure and sentiment accuracy.
✔ Rocket Booster Rules
For a valid Rocket Booster setup:
Price MUST be above the 50 EMA
Price MUST be above the 200 EMA
Price MUST gap up OR break out into new highs
Once these conditions align, you check the 4-hour chart for a clean breakout.
When sentiment is in the right season and the pattern confirms…
you get explosive new-high buying opportunities.
🎯 Why This Strategy Works
Because it follows the truth:
📌 Institutions buy strength.
📌 Uptrends create new highs — not sideways markets.
📌 Breakouts show where money is flowing right now.
📌 EMAs filter out all the noise and hype.
This is not about predicting the future.
This is about following strength while others chase stories.
Rocket boost this content to learn more
Disclaimer:Trading is risky please use a simulation trading account
before you trade with real money
AAPL Stock: 1-Week Trade Setup | Key Levels explainedIn this video, I break down a complete 1-week trade opportunity for AAPL (Apple Inc.) using technical analysis. We look at chart pattern formation, MACD signals, and important support/resistance levels to track. I also provide a clear entry zone, stop-loss placement, and potential upside targets for short-term traders.
Current AAPL chart pattern forming
MACD crossover and momentum analysis
Key support & resistance levels
My entry plan, stop loss, and target zones
Short-term outlook for the next 5 trading days
Risk management tips for Apple stock
📌 Why watch this?
If you’re planning a 1-week trade on AAPL, this video gives you a data-driven plan with clear technical signals.

AAPL long-term TAApple is in good solid uptrend on weekly time frame, but be careful on mid-term there's negative divergence between volumes and price, eventually it may pull back, watch for the support area between $256-266 to hold once correction occurs.

AAPL soon to be $285Double top pattern formation. Target area is 285-286 region.
DONT FORGET STOP LOSS
More info in video

Tim Cooke Moon Boy. Apple UpsideTrenVantage LITE plotting the trends but levels are marked. Apple likely to continue upwards with the AI hype if they have anything in the works. Downside marked if turns around. Monthly levels. Long way down for an overinflated company but likely upside in play.

AAPL Pulled Back After the Morning Spike — TA for Nov 26AAPL Pulled Back After the Morning Spike — Here’s What I’m Watching for Nov 26
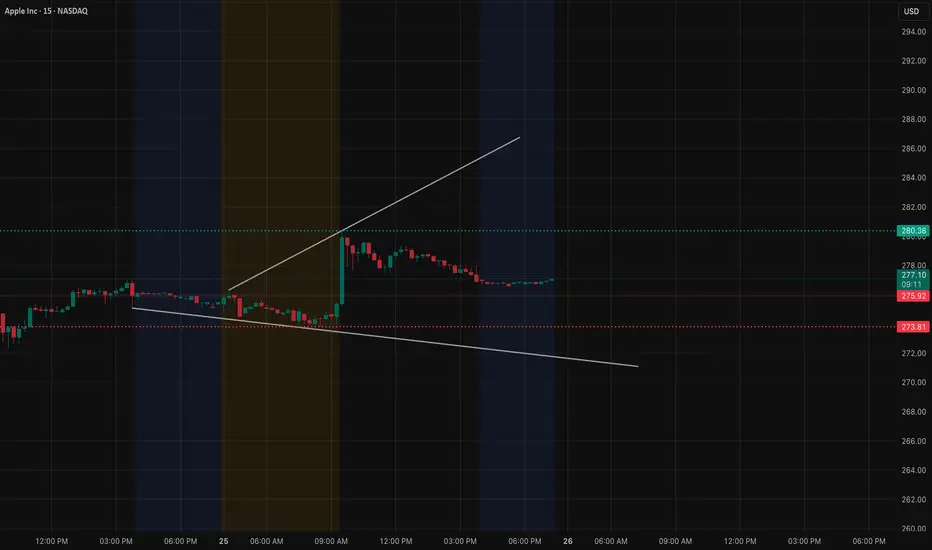
AAPL opened with a strong vertical move this morning, but after that first burst, the stock spent the rest of the day bleeding slowly back down into the mid-270s. You can see it clearly on the 15-minute chart — a sharp breakout that couldn’t find a second leg, followed by a steady drift back toward the rising trendline underneath. This kind of price action usually means the opening drive was driven by short-term momentum players, and once they took profit, the stock settled into a more balanced state.
The candles in the afternoon tell that story pretty well. Volume dropped off, body sizes shrank, and everything tightened into a flat band around 276–277. Nothing about the pullback looks aggressive — it’s more of a cooldown after a big morning run. The trendline beneath price hasn’t been threatened, and AAPL is still trading inside yesterday’s upper range.
Check the 1-hour GEX chart below, you can see the behavior becomes even more logical. The entire 280 area is sitting on top of thick call walls. There’s a stack of hedging resistance between 278.5, 280, and even higher into the 282.5 zone. When a big name like AAPL pushes into a cluster of call walls right after a vertical move, the stock often stalls because market makers hedge against the push.
Below price, there’s a very clean cluster of put support around 272–273, and a stronger cushion down at 267.5. That’s why today’s pullback wasn’t dramatic — there’s option structure acting like a net underneath.
So for Nov 26, here’s what stands out:
If AAPL can climb back above 278 and actually hold it, then the stock has another shot at 280. But 280 isn’t a free level — that’s where the heaviest call resistance sits, so it needs momentum or a catalyst to push through.
If AAPL loses 275 with real conviction, then the drift toward 273 becomes much more likely. And if the broader market is weak, 272–273 is the zone where buyers typically step in because it lines up with both intraday demand and put flow support.
My thoughts on Option trading
Calls only make sense if AAPL reclaims 278 and shows actual strength. That’s where the momentum window opens toward 280.
Puts don’t really make sense unless 275 breaks cleanly. Below that, 273 and 272 are the first magnets, and premiums can expand quicker because there’s less hedging friction in the way. Above 275, put decay will be heavy because the GEX layout still leans slightly supportive.
Disclaimer
This is just my personal read on the chart and options landscape. It’s not financial advice. Always trade your own plan and manage your risk.
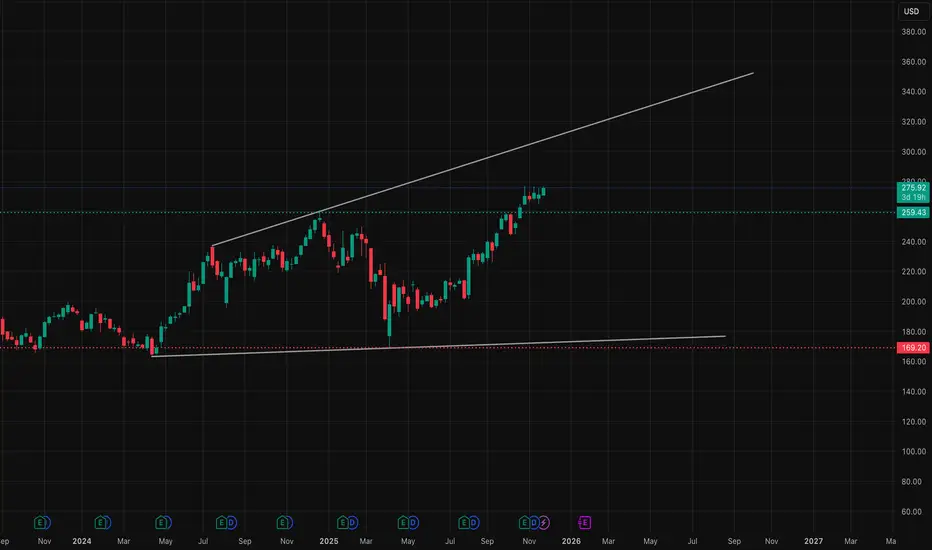
AAPL At a Critical Decision Zone! Breakout or Pullback Coming?Weekly timeframe
AAPL has been grinding steadily higher for months, forming a clean bullish structure with higher lows and higher highs. Buyers have full control on the weekly chart.
But now price is pushing directly into a long-term ascending trendline that has rejected multiple times in the past. Every time AAPL reached this area, momentum slowed and sellers stepped in.
This is late-stage in the weekly move, not the beginning.
If buyers can break and close above this trendline, we could see a strong expansion move. If not, this is the perfect spot for a weekly pullback.
Daily timeframe
The daily still shows bullish continuation with multiple BOS confirmations on the way up. However, price is now inside a supply zone where the last selloff started.
You can already see hesitation candles forming, smaller bodies, and wicks on top. That usually signals exhaustion.
If daily closes weak here, a retracement back toward 270–268 makes sense. If buyers hold above 275 and push out of this supply zone, continuation toward 280+ opens up.
1 Hour timeframe
Very interesting behavior here.
We saw:
* liquidity sweep above recent highs
* a quick rejection
* price stalling under short-term resistance
This is often the “fake first push” before the market decides direction.
For bulls, we need a clean reclaim and hold above 276.
For bears, losing 273 opens the door for 270–268 retest.
Right now, momentum is slowing.
GEX View
GEX levels support this zone as a decision point:
* heavy CALL walls around 280
* strong PUT support around 270–268
* highest positive GEX slightly above current price
That means market makers have incentive to pin AAPL between these levels until direction becomes clear.
A breakout above the 280 GEX wall could trigger momentum.
A breakdown toward 270 would be absorbed by PUT support first.
My thoughts
Trend is still bullish overall, but location is risky for new longs. This is where smart money takes profit or waits for confirmation.
If buyers fail to break this weekly trendline soon, we could see a pullback. If they break it, AAPL has room to run fast because there's very little resistance above.
This week should decide the next bigger move.
Key levels
Bullish above:
276
280
Targets:
282.5
285
Bearish below:
273
270
Targets:
268
265
Conclusion
AAPL is sitting at a major decision zone across all timeframes. Trend favors bulls, but the location suggests caution. Watch 276 and 273 — whichever breaks first likely sets the next move.
Disclaimer:
This analysis is for educational purposes only and does not constitute financial advice. Always do your own research and manage your risk before trading.
$AAPL 275$NASDAQ:AAPL 275$ 💥
18-month prison? EXPLODED past 277.32 & never back 🔥
270-272 = shorts graveyard 🪦
109K dip? Rocket fuel loading 🧨
277.32 about to blow again..
300 in a blink 🎯
Run or cry blood 😈🍏