sell aaplaapl hit upper trend resistance and is currently overbought, overpriced, its time for another major correction that could then even lead to a trendbreak due to increasing risks, it will be very exciting to monitor all further moves and especially price action at highlited trend lines.
other stocks like tsla recently signalled a turn as well as they printed double top patterns, bitcoin momentum is also slowing down, a whole market turn seems very likely.
Trade ideas

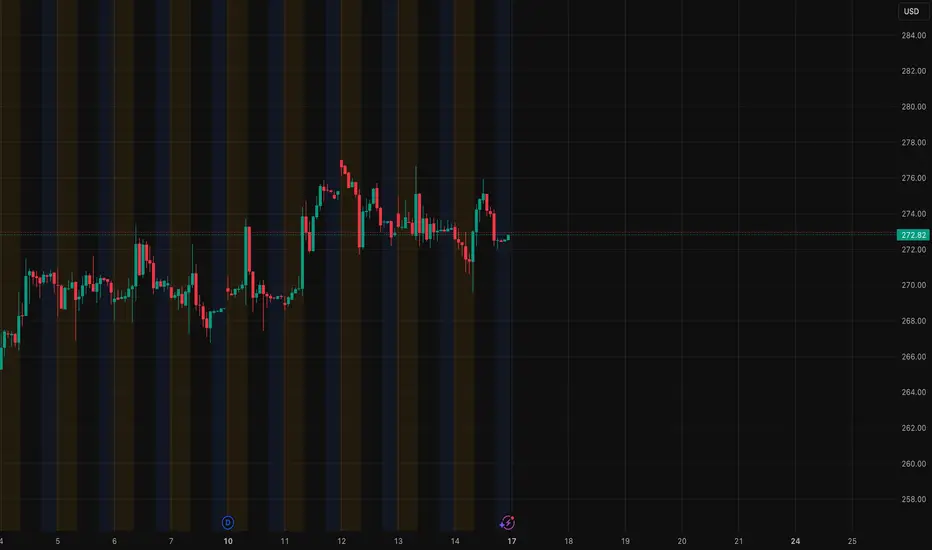
AAPL – Multi-Timeframe Setup Worth Watching (11/17)Over the last few sessions, AAPL has been stuck inside a tight range, but the way the price is reacting around 272–275 is starting to get interesting. When I line up the 1-hour, the 15-minute, and the options/GEX map together, the picture becomes clearer: AAPL is closer to a move than most traders realize.
I’ll walk through the logic the same way I analyze it for myself.
1️⃣ 1-Hour Chart — Market is Coiling
On the 1H chart, AAPL is still respecting the descending channel that has been developing for several days. Lower highs at 277.5 → 275 → 273.8 show sellers leaning on this structure, but the important part is the repeated defense at 272.
Every push into that area gets bought.
The trendline from Friday’s low also hasn’t broken, so instead of a clean downtrend, what we’re seeing is compression. That usually leads to a breakout once one side finally gives up.
So on 1H:
* 273.8 = the line buyers need
* 272 = the line sellers want
Whoever breaks first decides the direction.
2️⃣ 15-Minute Chart — Intraday Map Gets Clearer
The 15M chart fills in the short-term structure that isn’t obvious on 1H.
There’s a nice cluster of demand around 272.20–272.60, where an FVG is still open. That’s exactly where AAPL bounced the last time. On the opposite side, supply sits around 273.30–274, and price gets rejected as soon as it touches it.
The EMAs are still flat, showing indecision, so the 15M reinforces the idea that the real move only starts when one side conquers their zone.
To me, the 15M basically says:
* Don’t get chopped in the middle
* Wait for 274 reclaim or 272 flush
* These two zones are clean and respected
3️⃣ Options/GEX Map — The Part Most Traders Miss
This is where the story gets more interesting.
The GEX map shows very clear magnets and barriers:
Upside:
* 276.70–277.00: First major call wall
* 277.50–278.00: Strongest positive GEX zone
If AAPL can clear 273.8, this is the type of structure that often drags price higher even when the chart looks messy. Market makers hedge into strength, and price tends to gravitate toward these zones.
Downside:
* 270.50–271.00: First real put shelf
* 268.60: Strong put wall
* 266.77: Deep hedge zone (fast moves happen here)
What I like about this GEX setup is how well it explains the hesitation in price. AAPL is literally sitting right in the middle of a balanced hedging zone. Once it breaks out of it, the path becomes clean in one direction.
This is why I always use GEX next to price action—it’s the part of the market structure you can’t see on the chart alone.
(And yes, if you’re new to GEX, this is the kind of situation where it becomes extremely useful.)
🎯 How I’m Planning the 11/17 Session
🔼 Bullish Plan (Only if 273.80 breaks)
If AAPL finally gets above 273.8 and holds it, the upside levels are clear.
Stock Trade Idea:
* Entry: 274–274.20
* Targets:
* 275
* 276
* 276.7 → first GEX magnet
* 278 → main GEX magnet
Options Idea:
* 275C or 277.5C
* Get in after 273.8 holds, not before
* Trim at GEX magnets
🔽 Bearish Plan (If 272 fails)
If sellers break 272, the move down can be quick.
Stock Trade Idea:
* Entry: 271.80
* Targets:
* 270.8
* 268.6
* 266.7
Options Idea:
* 270P or 267.5P
* Expect acceleration once 272 cracks, because that level lines up with options hedging pressure
⚠️ Chop Zone: 272.20–273.50
This is the area I won’t trade. Price has no momentum here and both sides get trapped.
Final Thoughts
AAPL doesn’t look explosive at first glance, but the multi-timeframe behavior and the way GEX levels line up tell a different story. This is the type of setup where the breakout tends to be clean once it finally happens.
When price, structure, and dealer positioning all point to the same key levels, it usually pays to wait for the break and then follow the confirmation.
Disclaimer
This analysis is for educational purposes only and is not financial advice. Always manage risk and do your own research before trading.
AAPL - limited upside potential. Correction risk?hi traders,
AAPL is trading within a well-defined long-term ascending channel. Price is currently approaching the upper boundary of this channel, where it has historically faced resistance.
Trend Structure: The broader trend remains bullish, with higher highs and higher lows consistently forming within the channel.
Current Position: Price is nearing the upper trendline resistance, suggesting a potential exhaustion point for the current upward move.
RSI: The monthly RSI is approaching overbought territory, indicating that upward momentum may be slowing and increasing the probability of a pullback.
Potential Scenario:
A rejection from the channel’s upper boundary could trigger a corrective move.
The projected path shows price pulling back toward the midline or even the lower boundary of the channel, aligning with historical behavior.
🎯 Trading Idea:
Watch for signs of rejection or bearish reversal patterns at the upper trendline. If confirmed, a medium-term corrective move toward the lower channel boundary could provide a high-probability buying opportunity in line with the long-term uptrend.
⚠️ Risk Note:
This idea is based on technical structure only. Always consider macro factors, earnings, and risk management before entering a position.

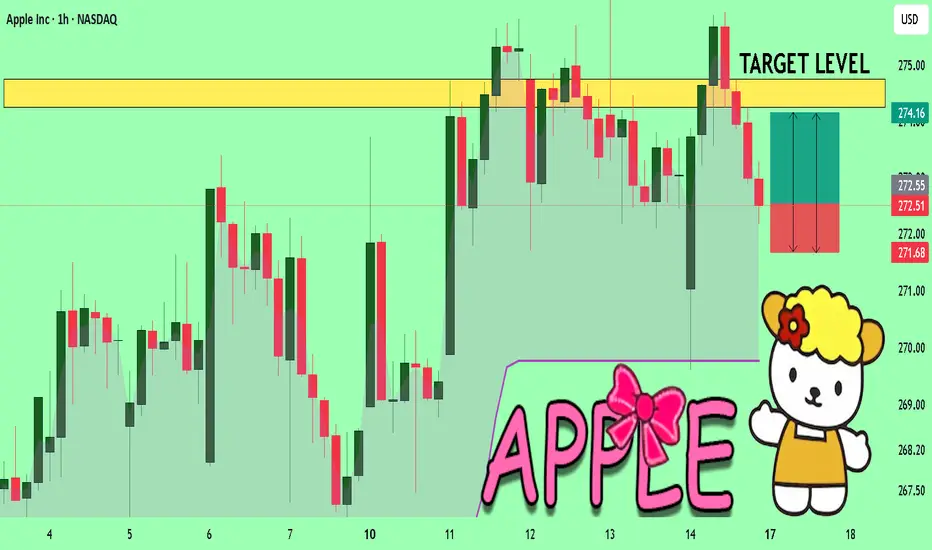
APPLE Will Explode! BUY!
My dear friends,
APPLE looks like it will make a good move, and here are the details:
The market is trading on 272.51 pivot level.
Bias - Bullish
Technical Indicators: Supper Trend generates a clear long signal while Pivot Point HL is currently determining the overall Bullish trend of the market.
Goal - 274.26
Recommended Stop Loss - 271.68
About Used Indicators:
Pivot points are a great way to identify areas of support and resistance, but they work best when combined with other kinds of technical analysis
Disclosure: I am part of Trade Nation's Influencer program and receive a monthly fee for using their TradingView charts in my analysis.
———————————
WISH YOU ALL LUCK
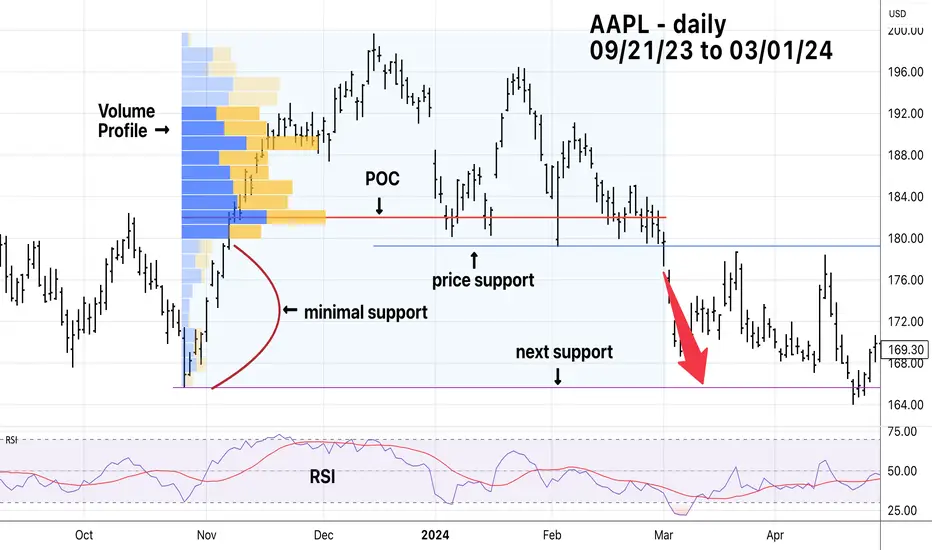
Apple Inc. Breaks Below Important Support Levels.Apple Inc (AAPL) has broken below price support at 179.25, and the widest part of the Volume Profile called Point of Control (POC). Price tends to move towards or away from POC. The downside break of POC could be very bearish.
Note there is minimal support below 179.25. AAPL could quickly move down to its October 2023 bottom.
Apple Longs (Weekly)Ready to shoot off. Retest of key demand zone, and rebounding with bullish upside pressure.
We will break the highs and reach beyond to the 210s.

APPL is done!i see appl has about 7% left to go before we see a potential reversal .we have been in a bullish channel for over 5 years.in as little as 7 months appl has gained over 60% and is now time for a correction as well as the whole market as a whole also we have bearish negative reversal on the 4 week time.it looks like we will find support around the 100 day moving ave.we have all signs pointing to sell this market looks like its about to crash.
Chapter One: What is the Adam Theory?
The Adam Theory is about achieving profits in the market... the principles of profiting in any free market worldwide. The Adam Theory guides you to observe the market in a unique way and instructs you to engage in market operations using a relatively distinctive method. It is the purest, simplest, and easiest method to apply for profiting in market operations... using only the information revealed by the market itself.
The role of the Adam Theory goes beyond this. It also informs traders of the most likely direction the market will take in the future. By employing the predictive techniques of the Adam Theory, traders can estimate and clearly see the path ahead. Then, traders can ask themselves, "Do I want to enter the market?" If the answer is affirmative, they should enter immediately.
The Adam Theory can be applied to any time frame. That is, it can be used on monthly, weekly, daily, or intraday charts. It is a theory based on visual reactions, and a simple candlestick chart can make it very clear without the need for mathematics.
Now, using candlestick charts, return to the question, "Do you want to trade?" If the answer is affirmative, the trader enters the market. The next day, the trader applies the Adam Theory again to discern the most likely path of the market and asks, "Do I still want to trade?" Eventually, the answer will be "no," and the Adam Theory will guide you to exit the market.
When performing the above tasks, the Adam Theory only observes the information revealed by the market itself... never making arbitrary judgments. The Adam Theory is the simplest and purest concept... yet most traders overlook it.
As J. Welles Wilder Jr. stated:
"The Adam Theory is concerned with this question: What are the fundamental principles for profiting in the market?
Or, in other words, how does the Adam Theory complete the following sentence: To succeed in the market, we must ______?
Are there common principles that traders, whether intentionally or unintentionally, apply to win in the market?"
"Please note that theories about how markets operate and develop are different from profiting in the market. The Adam Theory does not primarily discuss the market or how it operates but rather the secret to succeeding in the market. This is a distinction.
The greater the secret, the simpler it is—this is a reasonable statement. This is why the Adam Theory is often overlooked: because it is too simple. The human mind is extremely fond of complexity and difficulty; it likes to challenge itself. As a result, the mind often fails to grasp simple things, asking, 'Is this a great truth? How can it be so absurdly simple?'
The Adam Theory addresses the fundamental truth of things, discussing only what happens. It does not seem novel or complex, but that is its strength. Please note that the Adam Theory does not discuss what should happen or what is impressive. It focuses on one thing only—what truly, factually happens. Everything is simple and not at all difficult to understand.
When thinking about the Adam Theory, the only concern is one thing—what happens? Anything else may be interesting, but it is not important."

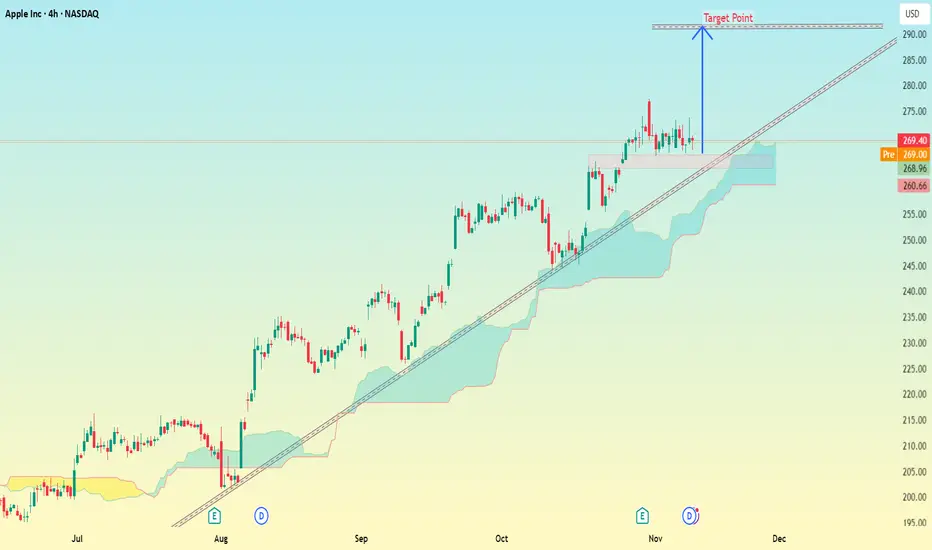
Apple Inc. (AAPL) 4H – NASDAQ chart Pattern...Apple Inc. (AAPL) 4H – NASDAQ chart:
Here’s a detailed read of the setup my drawn 👇
---
🧭 Chart Overview
Current Price: ≈ $269.4
Trend: Strong uptrend (price holding above Ichimoku cloud & rising trendline)
Support Zone: Around $265 – $266 (where price retested the trendline + cloud)
Resistance/Target Box: Marked on my chart as Target Point near the upper trendline.
---
🎯 Target Analysis
My blue arrow points to a resistance zone near the top of the ascending channel.
The Target Point zone is around $285 – $288.
→ That’s roughly +6% to +7% upside from the current level.
---
📈 Summary
Type Level (USD) Notes
Entry (current) 269–270 Price retesting support/trendline
Target 285 – 288 Channel top / bullish target
Stop-loss (recommended) 260 – 261 Below trendline & Ichimoku cloud
---
⚠ Notes
If AAPL closes below $260, this trendline support breaks, and momentum may shift bearish.
But as long as it stays above $265, it looks strong toward $285+.
Watch volume — a breakout above $275 with volume would confirm move to target.
Domestic Market vs. Global Market1. Understanding the Domestic Market
The domestic market, also called the internal or home market, refers to the buying and selling of goods and services within a country’s borders. In this setup, businesses cater primarily to local consumers and operate under the country’s own legal, economic, and cultural framework.
For instance, when an Indian company sells products exclusively within India — like Amul, Haldiram’s, or Maruti Suzuki (domestic operations) — it’s participating in the domestic market.
Key Characteristics of the Domestic Market:
Limited Geographical Scope: Operations are confined to national borders.
Single Currency Usage: Transactions are conducted in the local currency (e.g., INR in India).
Uniform Legal Framework: Businesses follow domestic laws, taxation policies, and trade regulations.
Cultural Familiarity: Companies understand local consumer behavior, preferences, and traditions.
Less Competition from Foreign Players: Though globalization has changed this somewhat, domestic firms often face fewer international competitors.
Advantages of the Domestic Market:
Ease of Entry and Operation: No need to deal with foreign regulations or trade barriers.
Lower Operational Costs: Reduced logistics, tariffs, and compliance costs.
Better Market Understanding: Firms are aware of local culture, income levels, and trends.
Stable Political and Legal Environment: Predictability within familiar systems.
Challenges in the Domestic Market:
Limited Growth Opportunities: Once the local market saturates, expansion becomes difficult.
Economic Fluctuations: Domestic recessions can severely affect business.
Intense Local Competition: Many players target the same customer base.
Dependence on Local Policies: Tax changes or regulations can heavily influence profitability.
The domestic market is often the foundation where companies grow, learn, and prepare to expand into international markets.
2. Understanding the Global Market
The global market (or international market) refers to the worldwide exchange of goods, services, capital, and technology among different countries. It’s a broader and more complex ecosystem influenced by diverse economic systems, political environments, and cultural values.
When companies like Apple, Samsung, Tata Motors, or Nestlé sell across multiple continents, they are active in the global market. Their operations, supply chains, and customer bases span across borders.
Key Characteristics of the Global Market:
Wide Geographical Reach: Operations across several countries and continents.
Multiple Currencies and Economies: Transactions often involve exchange rate risks.
Diverse Regulations: Companies must comply with various trade laws, labor policies, and quality standards.
Cultural Diversity: Marketing and communication strategies must adapt to regional preferences.
High Competition: Domestic companies compete with global giants and multinational corporations (MNCs).
Advantages of the Global Market:
Larger Customer Base: Businesses can reach billions of potential customers.
Diversification of Risk: Economic slowdowns in one region may be offset by growth in another.
Economies of Scale: Large production volumes reduce per-unit costs.
Access to Resources: Firms can source raw materials, labor, and technology globally.
Brand Expansion: Global presence strengthens brand recognition and trust.
Challenges in the Global Market:
Complex Regulations: Varying trade tariffs, customs duties, and compliance requirements.
Currency Fluctuations: Exchange rate volatility affects pricing and profits.
Political Instability: Trade wars, sanctions, and diplomatic tensions can disrupt operations.
Cultural Barriers: Misunderstanding consumer preferences can harm brand image.
High Entry Costs: Global expansion requires significant investment in logistics, marketing, and infrastructure.
Despite the risks, the global market offers enormous opportunities for innovation, growth, and international collaboration.
3. The Role of Technology and Globalization
Over the last few decades, globalization and digital technology have blurred the line between domestic and global markets. E-commerce, logistics, and digital payments have made cross-border trade easier than ever.
Platforms like Amazon, Alibaba, and Shopify allow small domestic businesses to sell globally. Similarly, technology-driven logistics networks enable even regional manufacturers to export with minimal friction.
Additionally, social media has become a global marketing tool. A brand in India can now reach consumers in Europe or Africa through targeted online campaigns.
This digital integration has created what economists call a “globalized domestic market” — a market where local and international competition coexist simultaneously.
4. Strategic Approach for Businesses
Domestic Market Strategy:
Focus on local consumer behavior and needs.
Build brand loyalty and community trust.
Optimize cost and pricing structures for affordability.
Leverage government incentives and domestic supply chains.
Global Market Strategy:
Conduct deep market research before entry.
Adapt marketing, packaging, and communication for cultural fit.
Build partnerships or joint ventures with local companies.
Hedge against currency and political risks.
Ensure compliance with international standards (like ISO or CE).
A company that excels in the domestic market gains a strong base to expand internationally. For example, Tata Group and Infosys started in India but built global empires by leveraging their domestic strength.
5. Impact on the Economy
Both markets are crucial to a nation’s economic development.
The domestic market stimulates local production, job creation, and innovation. It builds self-reliance and consumer confidence.
The global market brings foreign investment, export earnings, and access to advanced technology.
Together, they create a balanced economic ecosystem, where domestic strength supports global competitiveness, and global engagement enhances domestic growth.
6. The Future Outlook
The line between domestic and global markets will continue to blur. With advancements in AI, logistics, and blockchain, cross-border trade will become faster, cheaper, and more transparent.
However, rising geopolitical tensions, trade protectionism, and sustainability demands may reshape how businesses approach globalization. Companies will need to balance “think global, act local” — a philosophy known as glocalization — to succeed in both markets.
Conclusion
In essence, the domestic market provides stability, familiarity, and a strong foundation, while the global market offers growth, diversity, and innovation. Businesses that can master both—understanding local needs while adapting to international challenges—can create enduring global brands.
The world economy thrives on the dynamic interaction between domestic and global markets. As technology continues to connect people and businesses, success will depend not on choosing one over the other, but on how effectively companies blend both to create sustainable, borderless growth.

Apple Inc. Swing Setup – Breakout or Breakdown Ahead?🍎 AAPL | Apple Inc. - Swing Trade Profit Blueprint 💰
NASDAQ: AAPL | Breakout Pattern Setup ⚡
Master the Swing Trade Game 🎯
📊 TECHNICAL OVERVIEW
Currently trading at $268.47 with strong momentum indicators aligning for a breakout scenario. Apple is positioned in a critical decision zone with defined technical levels offering professional risk/reward opportunities.
🎲 Market Structure: Tight consolidation phase with multiple confluences at key resistance and support zones.
📈 SWING TRADE SETUP - DUAL SCENARIO ANALYSIS
SCENARIO 1: BULLISH BREAKOUT 🚀
Entry Signal: Price breaks above resistance with volume confirmation
Entry Zone: Above $272.00 (Daily Close Confirmation)
Initial Target: $290.00 TP1 🎯
Extended Target: $295.00 TP2 (Ultimate Profit Zone) 🏆
Stop Loss: $264.00 (Risk Management Point) 🛑
SCENARIO 2: BEARISH BREAKDOWN 📉
Entry Signal: Price breaks below support with selling pressure
Entry Zone: Below $266.50 (Daily Close Confirmation)
Target 1: $262.00 TP1 🎯
Target 2: $256.00 TP2 (Profit Protection Zone) 🏆
Stop Loss: $276.00 (Risk Management Point) 🛑
🔍 KEY TECHNICAL FACTORS
✅ Momentum Alignment: Multiple timeframe convergence detected
✅ Volume Profile: Above average volume supporting breakout potential
✅ Support/Resistance: Well-defined levels from historical price action
✅ RSI Positioning: Neutral to strong momentum setup
✅ Moving Averages: Key dynamic support levels in play
🎯 SCENARIO CORRELATION PAIRS TO MONITOR
Primary Correlations:
🔗 NASDAQ:MSFT (Microsoft) - Tech sector strength indicator | Tech giants move together | Watch for divergence signals
🔗 NASDAQ:QQQ (Nasdaq-100 ETF) - Broader market direction | If QQQ breaks down, AAPL pressure increases | Use as macro confirmation
🔗 AMEX:VGT (Vanguard Info Tech ETF) - Sector sentiment gauge | Tech rotation plays | Confirms sector health
🔗 AMEX:IVV (iShares S&P 500 ETF) - S&P 500 correlation | Broad market support/resistance | Risk-on/risk-off indicator
🔗 AMEX:GLD (Gold) - Risk sentiment inverse correlation | Gold up = Risk-off = Tech pressure | Macro economic climate
📍 IMPORTANT REMINDERS FOR TRADERS
Your Entry Is Your Choice ✓ Only enter when YOUR checklist is complete
Your Stop Loss Is Your Decision ✓ Set it where YOU feel comfortable with risk
Your Take Profit Is Your Call ✓ Exit when your profit target is achieved or thesis breaks
Every trader's risk tolerance differs. These levels are technical reference points, not personal recommendations.
🎓 STRATEGY NOTES
✨ Best used on 1H-4H timeframes for swing trading
✨ Volume confirmation is CRITICAL before entries
✨ Wait for candle closes above/below levels - no wick trading
✨ Use this alongside your own technical analysis
✨ Market conditions can invalidate setups rapidly - stay flexible
✨ The breakout zone is where patience rewards traders
💡 CORRELATION SUMMARY
Green Lights ✅: When MSFT, QQQ, and VGT all confirm uptrend = Stronger AAPL bullish case
Yellow Caution ⚠️: When divergence appears between AAPL and QQQ = Possible reversal warning
Red Lights 🔴: When GLD spikes & IVV breaks support = Risk-off environment = Tech pressure incoming
✨ If you find value in my analysis, a 👍 and 🚀 boost is much appreciated — it helps me share more setups with the community!
This Time I’m Watching AppleGreetings fellow traders and chart lovers!
Here’s my updated view on Apple’s long term channel, which remains one of the cleanest trends on the NASDAQ. A perfect example of how patience pays in technical analysis.
Apple at the Edge: Key Retest Zone Before the Next Big Move 🍏
Apple Inc. (AAPL) has been moving beautifully inside a rising channel since 2020 respecting both its support and resistance trendlines with remarkable precision.
Price has once again reached the upper resistance zone, where previous rallies have often paused or reversed.
A retest zone between 260–254 now stands out as the short-term decision point.
If this zone holds, the structure could support a bullish continuation toward new highs.
However, a failure to sustain above it might trigger a healthy correction back toward the channel support near the 210–220 region.
This setup highlights how consistently Apple has respected its long-term structure a strong reminder that clean trendlines can often reveal the broader story better than any other thing.
Key Levels to Watch:
🟥 Resistance Trendline: 280–285
🟦 Retest Zone: 260–254
🟩 Support Trendline: 210–220
Idea Type: Educational / Chart Structure
Timeframe: Weekly
Perspective: Neutral-to-Bullish (watching retest reaction)

APPLE The Target Is UP! BUY!
My dear friends,
My technical analysis for APPLE is below:
The market is trading on 268.53 pivot level.
Bias - Bullish
Technical Indicators: Both Super Trend & Pivot HL indicate a highly probable Bullish continuation.
Target - 271.24
Recommended Stop Loss - 266.96
About Used Indicators:
A pivot point is a technical analysis indicator, or calculations, used to determine the overall trend of the market over different time frames.
Disclosure: I am part of Trade Nation's Influencer program and receive a monthly fee for using their TradingView charts in my analysis.
———————————
WISH YOU ALL LUCK

APPLE: Long Trade Explained
APPLE
- Classic bullish pattern
- Our team expects retracement
SUGGESTED TRADE:
Swing Trade
Buy APPLE
Entry - 268.53
Stop - 266.89
Take - 271.30
Our Risk - 1%
Start protection of your profits from lower levels
Disclosure: I am part of Trade Nation's Influencer program and receive a monthly fee for using their TradingView charts in my analysis.
❤️ Please, support
Apple Inc.($AAPL): Morgan Stanley Sees $130B Robotics Potential Apple Inc. (Nasdaq: NASDAQ:AAPL ) stock dipped 0.52% to $268.37 on Friday despite bullish long-term projections from Morgan Stanley. The investment bank’s new report suggests that Apple’s emerging robotics division could generate as much as $130 billion in annual revenue by 2040.
According to the analysts, including Apple specialist Erik Woodring, the company’s early robotics efforts could evolve into a major growth pillar alongside the iPhone, Mac, and wearables. The report envisions humanoid robots and robotic home assistants as part of Apple’s long-term strategy, powered by its AI and hardware integration strengths.
Morgan Stanley based its estimates on Apple’s track record of dominating premium consumer technology segments. With the company’s existing ecosystem—spanning devices, software, and services—Apple is seen as well-positioned to commercialize robotics on a massive scale. The analysts expect the robotics segment to capture roughly 9% of the total global market over the next 15 years.
The potential opportunity builds on Apple’s continued investment in AI and advanced sensors, technologies that would be essential for functional and safe humanoid robots. Analysts note that while Apple has not officially disclosed a robotics project, recent patent filings and talent acquisitions hint at serious development in the space.
Technical View
The AAPL chart indicates a bullish breakout above the $260 resistance level, confirming upward momentum following months of consolidation. Price action suggests a possible retest of this breakout zone before extending higher toward $290 and $300. With strong fundamentals and growing speculation about its next frontier in innovation, Apple’s long-term outlook remains constructive, even as short-term volatility continues.
Whale Activity Tracker - 2025-11-07🐋 Whale Activity Tracker - 2025-11-07
🐋 WHALE ACTIVITY DETECTED - FOLLOW THE INSTITUTIONAL FLOW
AI Analysis of Dark Pool and Large Block Trades
════════════════════════════════════════════════════════════════════════════════
💰 WHALE ACTIVITY SIGNALS
Generated: November 07, 2025 at 12:47 AM
════════════════════════════════════════════════════════════════════════════════
📊 5 Total Opportunities • ✅ 0 Ready to Trade • ⏸️ 5 Monitor
────────────────────────────────────────────────────────────────────────────────
┌─ #1 ⏸️ NASDAQ:AAPL • Score: 40/100 • WAIT
│
│ 📅 DTE: 4-8w days
│ 🔴 Risk Level: High Risk (7/10)
│
│ 📰 Catalyst: 0.8x vol surge, 1 block days, $23297.0M estimated flow, DP score 28
│ 📊 Setup: Whale activity pattern developing - institutional interest building
│ 🎯 Target: 8-15% upside in 3-5 weeks - early whale activity, watch for confirmation
│ 📈 Options: CALL 6-10w out (ITM/ATM) - whale position needs time to develop, $23297M flow
│
│ 💡 Wait - Monitor for stronger whale signals
│ ⚠️ Risk: Overbought (RSI 81) - whale accumulation may be late stage, watch for profit taking
└───────────────────────────────────────────────────────────────────────────────
┌─ #2 ⏸️ NASDAQ:HOOD • Score: 30/100 • WAIT
│
│ 📅 DTE: 4-8w days
│ 🔴 Risk Level: High Risk (8/10)
│
│ 📰 Catalyst: 2.0x vol surge, 0 block days, $0.0M estimated flow, DP score 0
│ 📊 Setup: Volume surge 2.0x with minimal price impact - smart money positioning
│ 🎯 Target: 8-15% upside in 3-5 weeks - early whale activity, watch for confirmation
│ 📈 Options: CALL 3-6w out (slight OTM) - ride 2.0x volume momentum, set tight stops
│
│ 💡 Wait - Monitor for stronger whale signals
│ ⚠️ Risk: Standard whale play risk - set stops below recent support
└───────────────────────────────────────────────────────────────────────────────
┌─ #3 ⏸️ NASDAQ:GOOG • Score: 25/100 • WAIT
│
│ 📅 DTE: 4-8w days
│ 🔴 Risk Level: Hi
Image
gh Risk (8/10)
│
│ 📰 Catalyst: 0.8x vol surge, 1 block days, $13691.9M estimated flow, DP score 0
│ 📊 Setup: Whale activity pattern developing - institutional interest building
│ 🎯 Target: 8-15% upside in 3-5 weeks - early whale activity, watch for confirmation
│ 📈 Options: CALL 6-10w out (ITM/ATM) - whale position needs time to develop, $13692M flow
│
│ 💡 Wait - Monitor for stronger whale signals
│ ⚠️ Risk: Overbought (RSI 78) - whale accumulation may be late stage, watch for profit taking
└───────────────────────────────────────────────────────────────────────────────
┌─ #4 ⏸️ NYSE:BAC • Score: 25/100 • WAIT
│
│ 📅 DTE: 4-8w days
│ 🔴 Risk Level: High Risk (8/10)
│
│ 📰 Catalyst: 1.4x vol surge, 0 block days, $0.0M estimated flow, DP score 27
│ 📊 Setup: Whale activity pattern developing - institutional interest building
│ 🎯 Target: 8-15% upside in 3-5 weeks - early whale activity, watch for confirmation
│ 📈 Options: CALL 4-6w out (ATM) - wait for stronger confirmation, paper trade first
│
│ 💡 Wait - Monitor for stronger whale signals
│ ⚠️ Risk: Overbought (RSI 73) - whale accumulation may be late stage, watch for profit taking
└───────────────────────────────────────────────────────────────────────────────
┌─ #5 ⏸️ NASDAQ:TSLA • Score: 20/100 • WAIT
│
│ 📅 DTE: 4-8w days
│ 🔴 Risk Level: High Risk (9/10)
│
│ 📰 Catalyst: 1.3x vol surge, 0 block days, $0.0M estimated flow, DP score 13
│ 📊 Setup: Whale activity pattern developing - institutional interest building
│ 🎯 Target: 8-15% upside in 3-5 weeks - early whale activity, watch for confirmation
│ 📈 Options: CALL 4-6w out (ATM) - wait for stronger confirmation, paper trade first
│
│ 💡 Wait - Monitor for stronger whale signals
│ ⚠️ Risk: Standard whale play risk - set stops below recent support
└───────────────────────────────────────────────────────────────────────────────
────────────────────────────────────────────────────────────────────────────────
📖 QUICK GUIDE:
✅ ENTER NOW → High probability s
etup, optimal timing, low-medium risk
⏸️ WAIT → Monitor for better entry or catalyst resolution
🟢 Low Risk → Heat 1-3 (stable, far from catalysts)
🟡 Med Risk → Heat 4-6 (moderate volatility)
🔴 High Risk → Heat 7-10 (near catalysts, high volatility)
💎 Position Sizing: 2-5% per trade • Max 2-3 concurrent positions
🎯 Exit Strategy: Take profit at 50% max gain or stop at 2x loss
════════════════════════════════════════════════════════════════════════════════

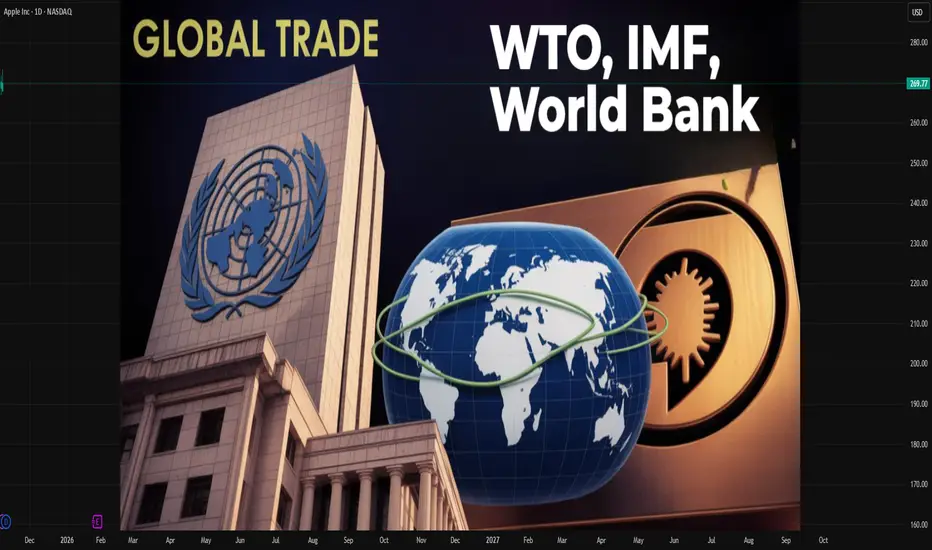
Global Trade: Role of WTO, IMF, and World Bank1. The World Trade Organization (WTO): Guardian of Global Trade Rules
The WTO, established in 1995 as the successor to the General Agreement on Tariffs and Trade (GATT), is the central body overseeing international trade rules. Its main purpose is to ensure that trade flows as smoothly, predictably, and freely as possible among member nations.
a. Promoting Free and Fair Trade
The WTO works to eliminate trade barriers such as tariffs, quotas, and subsidies that distort competition. It encourages member countries to open up their markets and engage in fair competition. By doing so, it promotes economic efficiency, consumer choice, and technological advancement.
b. Trade Negotiations
The organization provides a platform where member nations negotiate trade agreements. These negotiations cover a wide range of areas including goods, services, intellectual property, and agriculture. One of the most notable negotiation rounds was the Doha Development Round, which aimed to address trade imbalances between developed and developing countries.
c. Dispute Settlement Mechanism
A major strength of the WTO lies in its dispute settlement body (DSB). When countries violate trade rules or engage in unfair practices, affected members can file complaints. The DSB then provides a legal framework to resolve disputes through consultations, panels, and appeals, preventing trade conflicts from escalating into political tensions.
d. Monitoring and Transparency
The WTO also monitors trade policies of member nations to ensure transparency. Regular reviews under the Trade Policy Review Mechanism (TPRM) help identify potential violations and encourage best practices.
e. Support for Developing Nations
Recognizing the challenges faced by developing and least-developed countries (LDCs), the WTO offers technical assistance and capacity-building programs. These initiatives help such nations integrate better into the global trading system.
In essence, the WTO acts as the referee of global trade—setting rules, resolving conflicts, and ensuring that trade remains fair and transparent.
2. The International Monetary Fund (IMF): Stabilizing Global Economies
While the WTO focuses on trade rules, the IMF ensures that global financial systems remain stable enough to support trade. Created in 1944 during the Bretton Woods Conference, the IMF’s primary goal is to maintain international monetary cooperation and financial stability.
a. Promoting Exchange Rate Stability
Stable exchange rates are vital for smooth global trade. Fluctuations in currency values can create uncertainty for exporters and importers. The IMF monitors exchange rate policies of its members and offers advice to prevent competitive devaluations that can harm global trade flows.
b. Providing Financial Assistance
Countries sometimes face balance of payments crises—when they cannot pay for imports or service foreign debt. The IMF provides short- and medium-term loans to help stabilize their economies. These loans often come with reform conditions aimed at improving fiscal discipline, reducing inflation, and restoring investor confidence.
c. Policy Advice and Surveillance
Through its Article IV consultations, the IMF regularly reviews member countries’ economic policies. This surveillance helps detect potential risks early and guides countries toward sound economic management. For example, the IMF has played a crucial role in guiding nations through financial crises such as the Asian Financial Crisis (1997) and the Global Financial Crisis (2008).
d. Capacity Development
The IMF assists countries in building strong institutions for monetary policy, taxation, and financial regulation. Through technical training and policy advice, it strengthens countries’ ability to manage economic shocks and engage more effectively in global trade.
e. Supporting Global Financial Cooperation
The IMF serves as a forum for global monetary cooperation. It brings together 190+ member countries to discuss international financial stability, thereby preventing unilateral actions that could disrupt global markets.
In short, the IMF acts as the world’s financial watchdog—ensuring that countries maintain macroeconomic stability, which in turn supports smoother and more predictable global trade.
3. The World Bank: Financing Development for Trade Growth
The World Bank, also established in 1944, complements the IMF by focusing on long-term economic development and poverty reduction. It plays a key role in helping countries build the infrastructure and institutions needed for effective participation in global trade.
a. Financing Development Projects
The World Bank provides low-interest loans, grants, and credits to developing countries for projects in infrastructure, education, healthcare, energy, and agriculture. Infrastructure such as ports, roads, and telecommunications directly supports trade by improving connectivity and reducing logistics costs.
b. Encouraging Private Investment
Through its affiliate, the International Finance Corporation (IFC), the World Bank promotes private sector development by offering investment and advisory services. This helps attract foreign investment, create jobs, and strengthen export capabilities.
c. Policy Advice and Institutional Reform
The World Bank offers expertise in designing policies that promote trade competitiveness, good governance, and efficient resource allocation. It also encourages structural reforms—such as liberalizing trade policies and improving business environments—to help nations integrate into global markets.
d. Poverty Reduction and Inclusive Growth
Trade alone cannot guarantee equitable growth. The World Bank ensures that the benefits of globalization reach vulnerable populations by funding programs in education, healthcare, and social protection. These initiatives build human capital, making countries more resilient and competitive in international trade.
e. Global Partnerships and Knowledge Sharing
The World Bank also acts as a knowledge hub—sharing best practices and research on development and trade-related issues. Its global partnerships with regional banks, the WTO, and the IMF enhance coordination and ensure a holistic approach to economic development.
In essence, the World Bank provides the financial and developmental foundation upon which global trade can thrive.
4. Interconnected Roles: A Cooperative Framework
While the WTO, IMF, and World Bank have different mandates, they often work together to achieve common goals:
WTO sets and enforces trade rules.
IMF ensures monetary and financial stability.
World Bank promotes development and infrastructure for trade.
For example, during global crises—such as the 2008 financial collapse or the COVID-19 pandemic—these institutions coordinated efforts to support economies. The IMF provided liquidity and macroeconomic stability, the World Bank funded recovery and health initiatives, and the WTO advocated against protectionism to keep trade flowing.
5. Criticisms and Challenges
Despite their contributions, these institutions face criticism.
The WTO is often accused of favoring developed countries and being slow to reform trade rules that disadvantage poorer nations.
The IMF has been criticized for imposing strict austerity conditions on loans, which can harm social welfare.
The World Bank has faced backlash for funding projects with environmental or social consequences.
Moreover, rising protectionism, trade wars, and global inequality present new challenges that require these institutions to adapt and modernize their policies.
6. Conclusion
The WTO, IMF, and World Bank form the backbone of the global economic order. Together, they promote fair trade, financial stability, and sustainable development—key pillars of a prosperous global economy. While their roles differ—rule-making, stabilizing, and financing—they are interdependent and complementary.
As globalization continues to evolve, these institutions must work collectively to address new issues such as digital trade, climate change, and inequality. Their continued cooperation will determine not only the stability of international trade but also the economic well-being of nations across the world.
In summary, the WTO ensures fairness in trade, the IMF safeguards financial stability, and the World Bank empowers nations to grow—forming a triad that underpins global economic progress.
AAPL speculative swings, based on Quallamagie's 10/20/50.Where-ever AAPL would have good technical momentum swings. Should coincide with speculative, risk on periods. Think BTC rallies, etc. And they do.

AAPL: Uptrend intact, but rich valuation—Is it worth the risk?AAPL: Uptrend intact, but rich valuation—Is it worth the risk?
Technical Analysis
1. AAPL is climbing within an ascending channel, forming series of higher swings with diverging multi-period EMAs, signaling a strong uptrend.
2. However, as price approaches the channel’s upper boundary, a pullback is possible, especially with a Bearish Divergence signal between the price and RSI. Any further upside may be limited in the near term.
3. If AAPL extends higher, resistance sits near 284.00 at the channel top.
4. If AAPL pulls back, the first key support is the previous resistance around 260.00 which will become support. A drop below the EMA200 would signal a bearish reversal.
Fundamental Analysis
Based on fundamentals following the Q3 performance release, Apple has several support factors, including:
5. Apple beat in Q3 FY25, with revenue of $102.47B (+8% y/y) and EPS of $1.85 (+13% y/y), beating analyst consensus, and diluted EPS came in at $1.85 (up 13% year-over-year, and above expectations).
6. Record services revenue and a 6% YoY rise in iPhone sales powered the quarter.
Guidance was upbeat, pointing to December-quarter sales of about 137.97 bln USD (+11% y/y), signaling firm demand for iPhone 17 and other products.
7. Shifting production beyond China, strong brand loyalty, and a growing services ecosystem are core long-term growth drivers, bolstering resilience against regulatory and supply-chain risks.
8. However, some analysts flagged the stock as “expensive” relative to historical valuation multiples (P/E ~36)
Analysis by: Krisada Yoonaisil, Financial Markets Strategist at Exness

Apple at Historical ResistanceThe Apple (AAPL) daily chart shows that after a strong rally from around $220, the stock has now reached a major resistance zone near $260, where heavy selling pressure has appeared. How the price reacts to this level will likely determine the next medium-term trend.
Short-Term Outlook (next few days to weeks):
In the short term, the $259–$260 zone is a key support/resistance area. If the price manages to hold and close above it, a continuation toward $280–$290 is likely.
However, if it fails to sustain this level and breaks below $259, a short-term correction toward $250–$245 (around the 50-day SMA) could follow.
• Bullish short-term target: $280–$290
• Bullish stop loss: Below $258
• Bearish short-term target: $250–$245
• Bearish stop loss: Above $265
Long-Term Outlook (1–3 months):
The broader trend remains bullish, supported by an upward-sloping 50-day moving average and consistent higher highs. A confirmed breakout and close above $260 would likely fuel a new leg higher toward $300–$310.
On the downside, if the stock loses support around $245, a deeper pullback toward $230 could occur.
• Bullish long-term target: $300–$310
• Long-term stop loss: Below $245
In summary, Apple is at a critical decision point — sustained strength above $260 could launch a new rally phase, while a breakdown below it might trigger a healthy short-term correction toward the 50-day moving average.

Apple - Long -290Apple has shown the potential to hit the levels of 290.
The price might see the levels of 230 or even 205 before moving the higher levels.

AAPL Pullback: 10-EMA Bounce with RS Line at New HighAnalysis:
▪ Price has pulled back to the 10-EMA, presenting a potential entry point.
▪ Closing range at 60%, indicating controlled consolidation rather than aggressive selling.
▪ Excellent relative strength compared to the broader market.
▪ Relative Strength (RS) Line has been hitting new highs consistently over the past several weeks, signaling outperformance and bullish momentum.
Trade Idea:
▪ Long Entry: Near current levels or on a bounce from 10-EMA.
▪ Stop Loss: Below recent low or 10-EMA for risk management.
▪ Target: Recent high at $277.
▪ Risk/Reward: Aim for 1:2 or better; monitor for volume confirmation.

APPLE First correction signals in 7 months start to emerge.Almost 1.5 month ago (September 19, see chart below), we gave a buy signal on Apple Inc. (AAPL), which recently hit our $273 Target:
This time we go back to our long-term perspective and view Apple on the 1W time-frame, as the Bullish Leg (green) since the April 07 bottom, is approaching the top (Higher Highs trend-line) of the 4-year Channel Up.
The previous Bullish Leg peaked just below the 1.236 Fibonacci extension, so we can't rule out one final push to round $285 but on the long-term, a technical pull-back is favored.
The 2023 Bullish Leg eventually corrected on the 1W MA50 (blue trend-line), hitting its 0.382 Fibonacci retracement level at the same time. Even the smaller April - July 2024 Leg pulled-back to he 0.5 Fib.
All of those Channel Up tops have been also met with a 1W RSI break above the 70.00 oversold level, which is something that hasn't taken place yet. Similarly the 1W MACD hasn't started to reverse on the levels of most of previous tops.
In any case, we expect to see Apple hitting $236 at least on the long-term, which is its 0.382 Fib and marginally below the 1W MA50.
-------------------------------------------------------------------------------
** Please LIKE 👍, FOLLOW ✅, SHARE 🙌 and COMMENT ✍ if you enjoy this idea! Also share your ideas and charts in the comments section below! This is best way to keep it relevant, support us, keep the content here free and allow the idea to reach as many people as possible. **
-------------------------------------------------------------------------------
💸💸💸💸💸💸
👇 👇 👇 👇 👇 👇
