AAPLD trade ideas

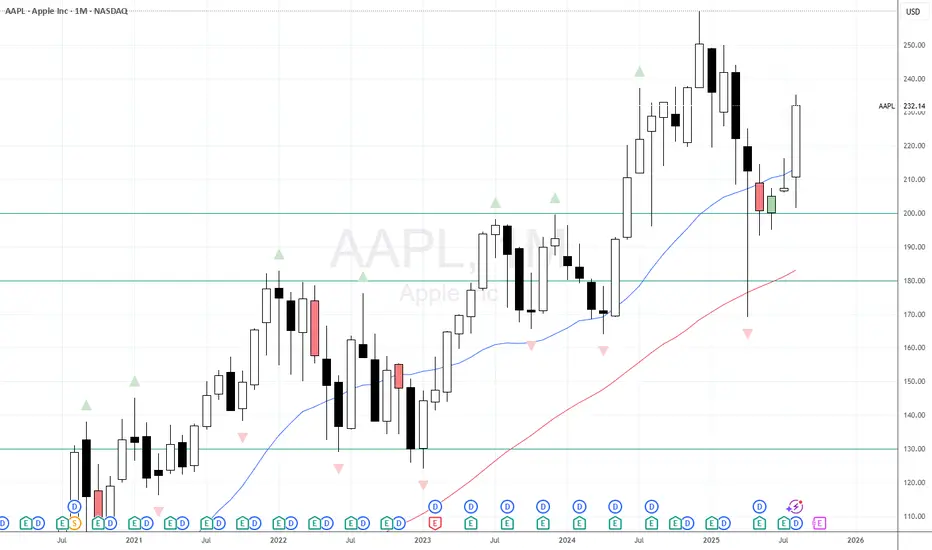
AAPL STRONG MONTHLY BULLISH REVERSALA very strong August for AAPL. My previous view had been for price to drift lower to $200 support over the quiet summer weeks. I was wrong. Strong bullish reversal on the monthly chart. Does it have what it takes to climb back to previous highs and beyond? Will watch September price action.
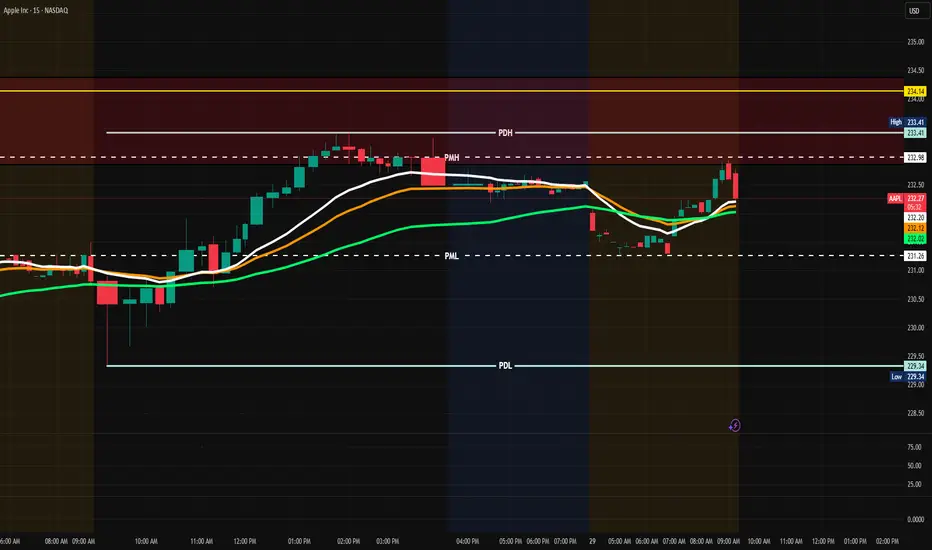
APPL Premarket setupAAPL Setup:
Bias: Bullish → Needs confirmation
Watching price action after open (first 15m candle)
CALL Setup
Break & Hold Above: 233.41 (PDH)
TP1: 234.14
SL: 232.40
Additional Confirmation: 9 & 21 EMAs stays above 50 EMA
No-Trade Zone:
Between 232.76 (PMH) and 231.26 (PML)
Expect chop / fakeouts here — wait for clean break & retest
PUT Setup
Break & Close Below: 231.26 (PML)
TP: 230.59 (200 EMA)
SL: 231.60
Additional Confirmation: 9/21 cross back below 50 EMA
Wait for structure. First 15m sets tone.
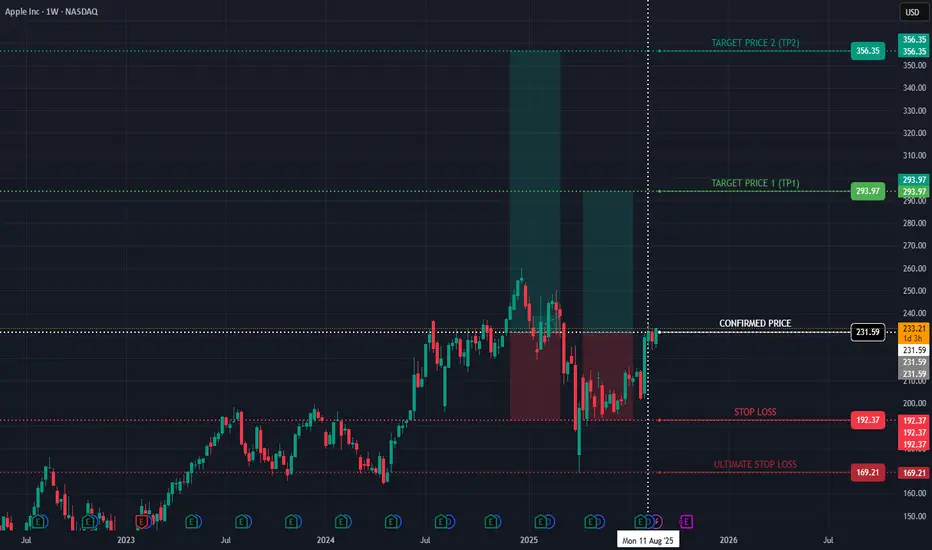
AAPL Bullish Stock Going UP and Confirmed!Hello,
Ayrfolio trade ideas are based on weekly charts and momentum, so remember to be patient! No day trades here unless the stock soars up intraday. Today we’re covering:
COMPANY: Apple Inc
STOCK SYMBOL: AAPL
POSITION: Long
TP1 Risk-Reward Ratio: 1.59
TP2 Risk-Reward Ratio: 3.18
Stop Loss: must wait AFTER daily candle closes to exit trade (regular candle, NOT Heiken Ashi)
Ultimate Stop Loss: can exit IMMEDIATELY if price reaches this level during any trading hours
EXPLANATION: Weekly momentum increased and confirmed on Monday 8/11/25 at $231.59/share. Although the stop losses are listed on the chart, if momentum has been lost then we can exit before the price reaches the stop loss.
DISCLAIMER: Please do your own due diligence before making any decisions.
P.S. - Stocks can soar. YOU can soar. Soaring is possible!
-Ayrfolio
AAPL ShortBroader Market Structure (AAPL 15M):
The broader trend recently shifted after a sustained bearish leg that produced consecutive lower lows. A Change of Character (CHoCH) occurred at $235.12, signaling a potential reversal as price broke through prior supply and disrupted bearish order flow. However, despite the temporary bullish rally, the last confirmed Break of Structure (BOS) to the downside at $223.78 remains significant, keeping the higher timeframe structure bearish unless price can sustain above $235.12. This leaves the market in a corrective phase where short-term upside rallies may serve as liquidity grabs before continuation lower.
Supply and Demand Analysis:
The supply zone around $233–235 has acted as a ceiling where price previously dropped sharply, showing strong selling pressure. Buyers stepped in with strength near $224–226, creating a demand zone that supported the recent rally, but since price already retested parts of this zone, it is moderately weakened. Deeper demand levels around $222–223 remain stronger, as buyers drove a strong impulsive reaction from there during the last reversal attempt.
Price Action Within Marked Region:
Currently, price is trading inside the prior supply zone and pressing into resistance with diminishing momentum. The projection suggests a rejection from this zone, aligning with the expectation of a move back toward demand levels. If price respects supply, the next likely path is a retracement into $226–224. Should that area hold, buyers could attempt another bounce, but if it fails, continuation into $222–223 becomes the probable scenario.
Current Trade Bias & Outlook:
The bias is bearish at this stage, with sellers favored at supply. Expected direction is down toward $226–224 initially, with a potential extension lower. The invalidation level for this bearish outlook would be a clean break and sustained hold above $235.12, which would flip the structure into a stronger bullish continuation.
Momentum & Candlestick Behavior:
Momentum currently favors sellers, with wicks appearing on the upside rally suggesting absorption of buying pressure. No strong bullish engulfing or continuation candles are forming at supply, reinforcing the idea of exhaustion at these levels.

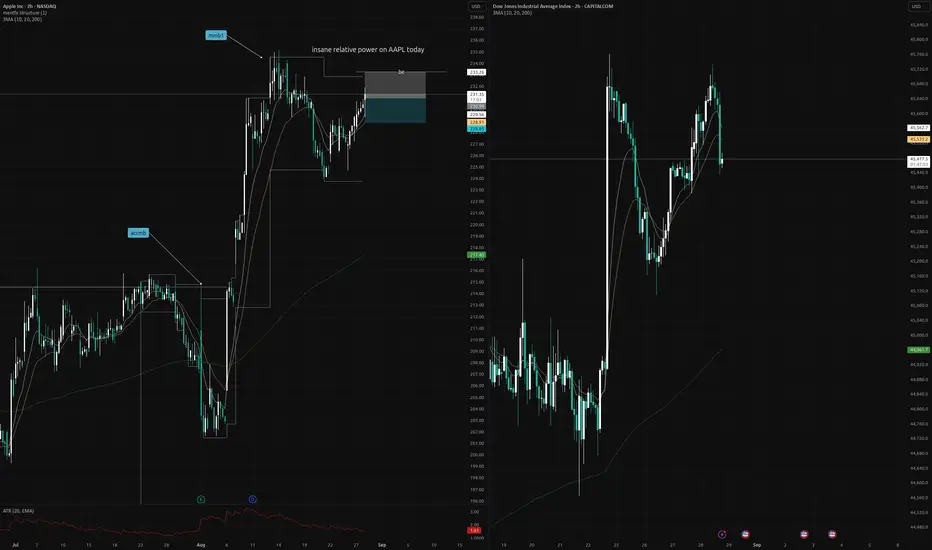
AAPL relative strength to US30 today Because APPLE is going up but US30/US2000 is falling like crazy, we can say that APPLE is one of the strongest stock in comparison with the overall stock market in US
What you think about this trade?
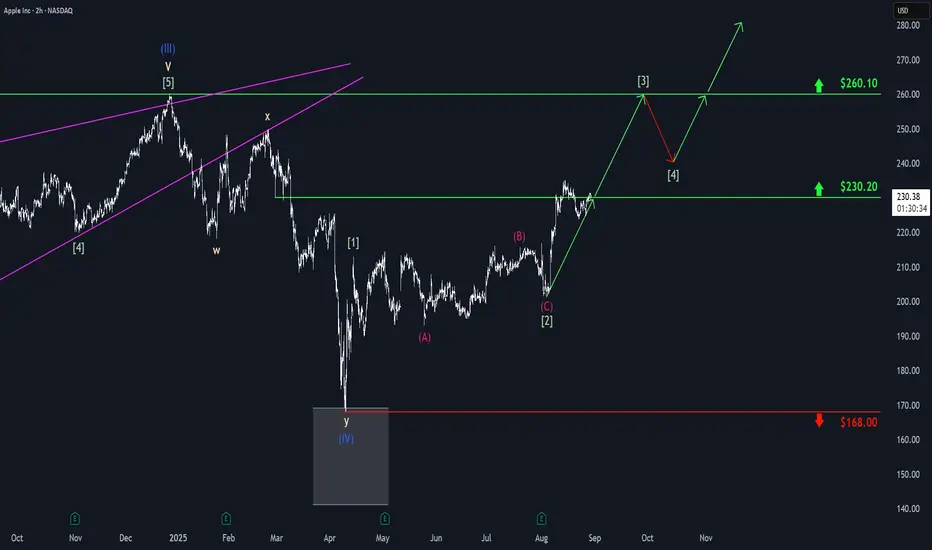
Apple: Another Run at Key ResistanceApple shortly dipped back below the $230.20 mark but has since begun another push higher. We expect the stock to soon break through the $230.20 level sustainably and – as part of the green wave – move up toward the next major resistance at $260.10. The following wave pullback should remain above $230.20, allowing the broader green upward trend to continue gaining momentum.
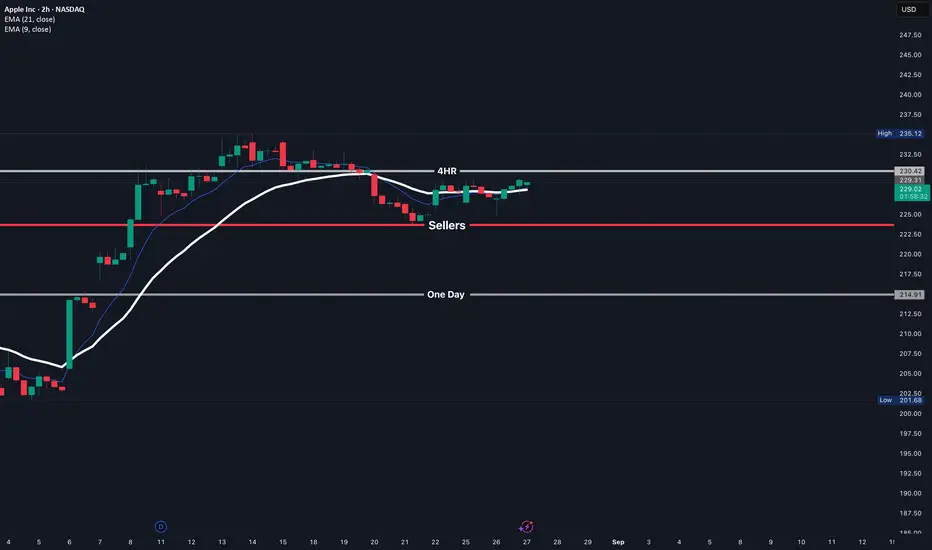
AAPL – Three Scenarios for (Aug 28, 2025)Keeping it tight and tactical. AAPL is setting up in a clear zone with 3 outcomes based on how it reacts to 227–231. Here's the full map:
1. Bullish Scenario – Buyers Step In
Condition:
* Holds 229 support
* Reclaims 231 with volume
* QQQ green, VIX fading
Price Action:
* Buyers absorb sellers at 229–230
* Break over 231 opens 233, possible 235 (call wall)
Game Plan:
* Long bias above 231
* Trim at 233
* Runner target = 235
* Stop = under 227
---
2. Sideways Scenario – Range Holds
Condition:
* Can’t break 231
* But holds above 227
* Low volume and compressed ATR
Price Action:
* Ping-pong between 227–231
* Wicks both sides, indecision candles
Game Plan:
* Stay out unless there's edge
* Scalps only:
* Long 227 to 229
* Fade 231 to 229
* Small size, quick exits
3. Bearish Scenario – Breakdown
Condition:
* Loses 227 clean
* QQQ red, VIX above 15.5
Price Action:
* Sellers take control
* Push into 224 zone
* Maybe retest 223.5 (double bottom area)
Game Plan:
* Short under 227
* Cover partial at 224
* Hold runners for 223.5
* Stop = reclaim of 229 with volume
Bias: Neutral. Will react to what AAPL does at the 229–231 zone.
If 227 breaks, I’m hunting shorts.
If 231 reclaims, I’ll ride the long side with defined stops.
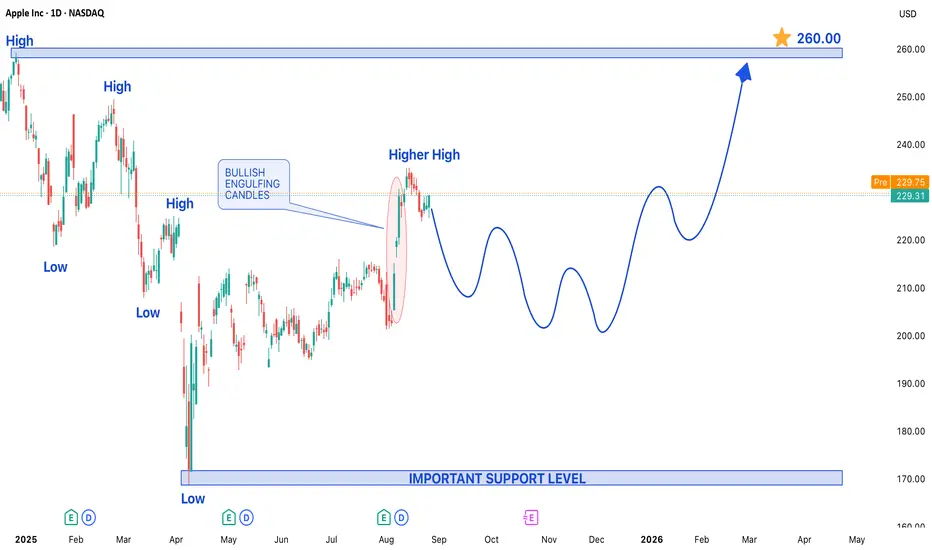
APPLE INC SHIFTED TO BULLISH TREND STRUCTURE IN DAILY CHARTTechnical Analysis: Apple Inc. (AAPL) Shifts to Bullish Daily Trend
A significant technical development is underway for Apple Inc. (AAPL), as its daily chart has conclusively shifted into a bullish trend structure. This critical change in market posture indicates that buyer momentum has successfully overwhelmed previous selling pressure, setting the stage for a potential sustained upward move. The emergence of this new trend is characterized by a clear pattern of price action that signals growing confidence among buyers.
The primary evidence for this bullish shift is the formation of a higher high. This occurs when the price surpasses a previous significant peak, breaking the sequence of lower highs that defines a bearish or corrective phase. This achievement demonstrates that buyers are not only active but are also willing to bid up the price to new interim levels, establishing a new upward trajectory. This price-based evidence is powerfully confirmed by a key candlestick pattern: the **Bullish Engulfing candle. This pattern materializes when a large bullish candle completely "engulfs" the real body of the preceding bearish candle. It represents a decisive victory for the bulls within a single trading session, marking a clear shift in sentiment from selling to aggressive buying and providing strong confirmation of the underlying strength.
Given the confluence of this new bullish trend structure, the higher high formation, and the potent Bullish Engulfing candlestick pattern, the expectation is for AAPL's price to remain bullish in the upcoming trading sessions. The path of least resistance appears to be firmly to the upside, with momentum favoring the buyers.
Key Levels to Watch:
Upside Target: Based on this technical structure, the price is projected to aim for a target level of $260.00 on the higher side. This objective will likely serve as a key profit-taking zone and a significant psychological resistance level that the market will test.
Downside Support: While the outlook is bullish, it is prudent to identify key risk management levels. On any pullback, the support level of $170.00 is expected to act as a crucial floor. This level should hold to keep the newly established bullish structure intact. A decisive break below this support could invalidate the current bullish thesis and signal a return to a neutral or bearish consolidation phase.
In summary, the technical evidence for AAPL has turned convincingly positive. Traders and investors may look for opportunities on the long side, targeting the $260.00 level, while using any moves toward $170.00 as a potential value area, always with appropriate risk management strategies in place.
250 by eoy or soonerThis thing just touched tips w a weekly fvg and broke out of a wedge. Its not gonna stop anytime soon. Load up on Jan calls.
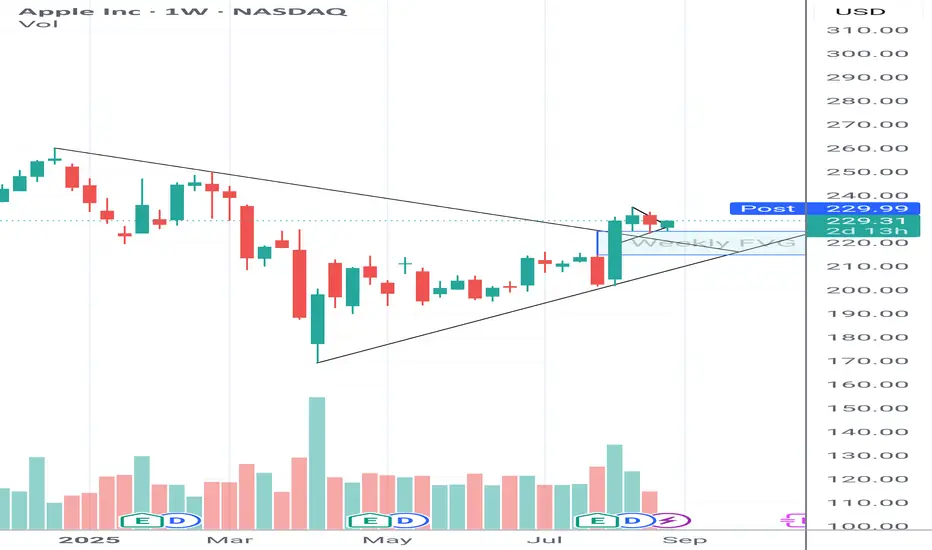
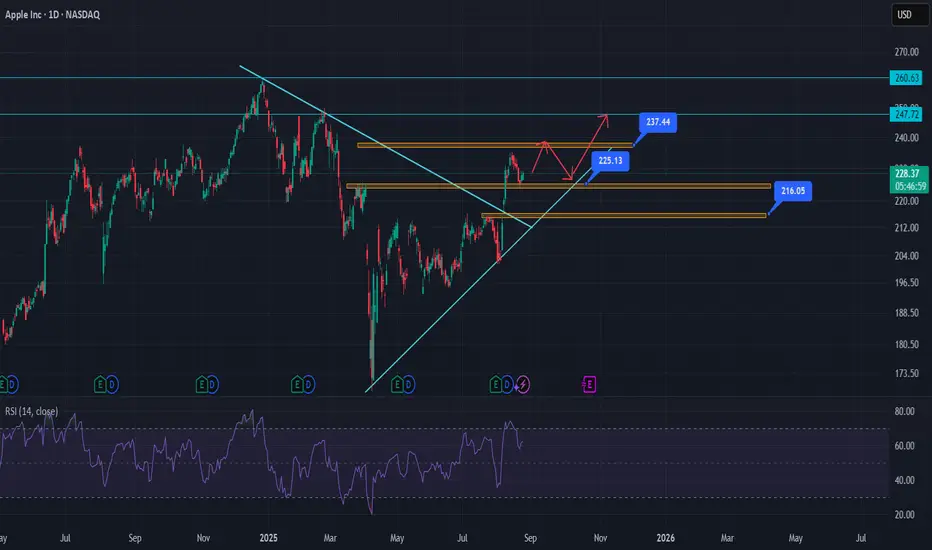
APPL striking for 247$; First 237$ must be brokenAfter breaking the top line of symmetrical triangle, APPL has surpassed 225$ and is heading toward the next resistance line at 237$. As it can be seen on the chart, It's probable that 237$ can be broken and APPL can reach 247$ on daily timeframe.
But first I believe it will bounce back from 237$ to 225$ and its bullish trendline to start the major bullish trend.
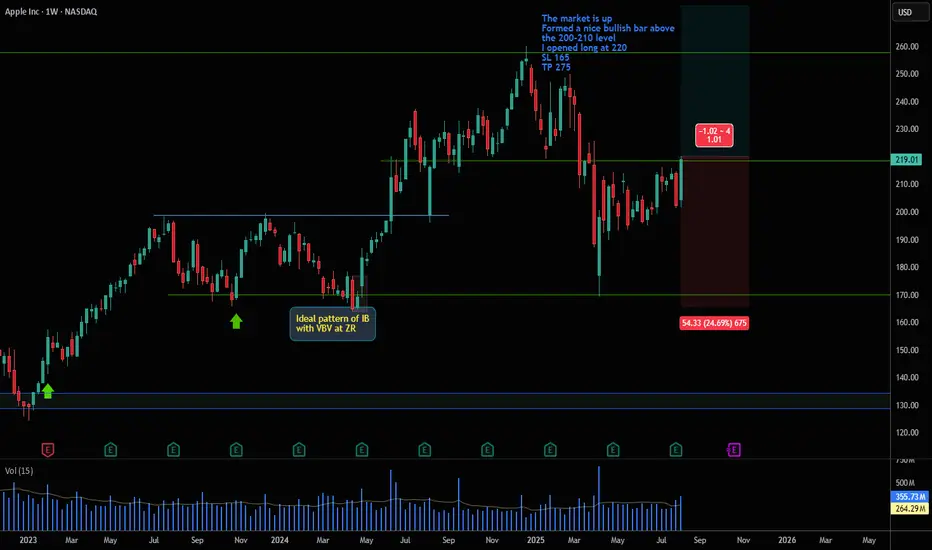
Buy Apple at the break of 200-210 levelI opened long at the BRO the level 200-210
by a strong bullish bar
with a very good Volume and after the EPS
this market is in up trend
Long at 220
SL 165
TO 275
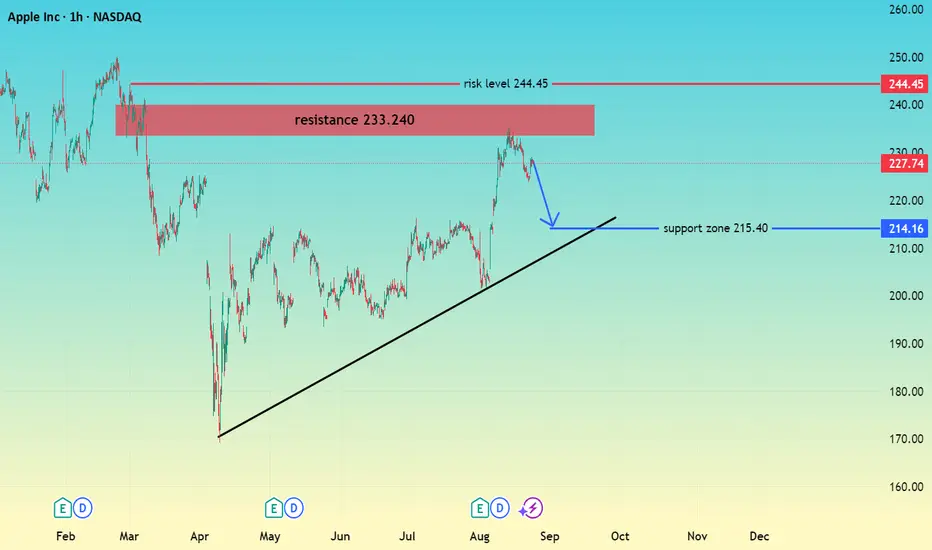
AAPL RESISTANCE 233VS SUPPORT 215 hi trader's
Apple price is testing a major resistance zone around 233 – 240.
If sellers hold this resistance, a retracement toward the 215.40 support zone and trendline is possible.
A sustained break above the 244.45 risk level would invalidate this bearish view and may open the way for higher prices
Resistance Zone: 233 – 240
Support Zone: 215.40
Risk Level ( 244.45
don't forget to like comment and follow
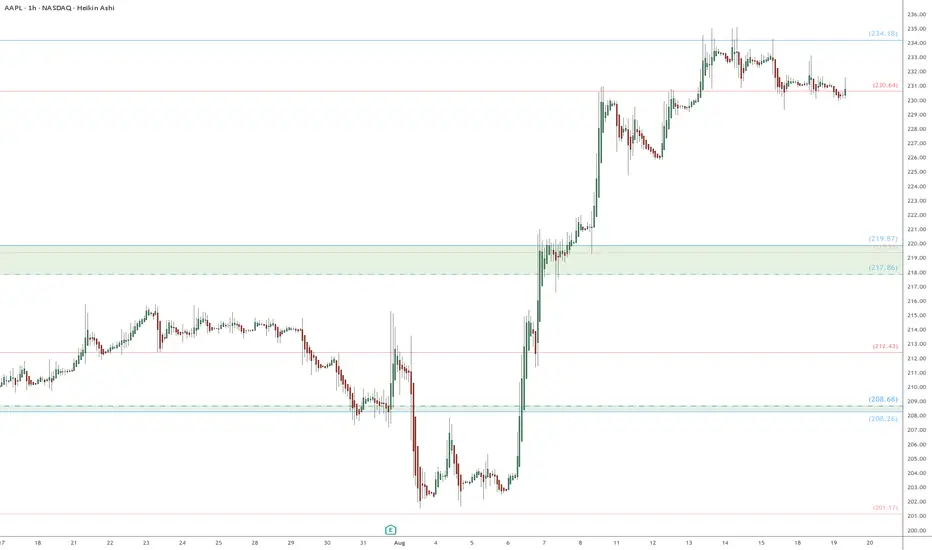
AAPL eyes on $230-234: Major fibs that could paint a Lower High AAPL has been coming back furiously on AI news.
Fighting a couple of major fibs at $230.64 and 234.18
Expecting a dip, maybe the green zone $217.86-219.87
.
See "Recent Publications" for previous EXACT plots.
Such as the TOP call from last year:
Hit BOOST and FOLLOW for more such PRECISE and TIMELY charts.
=========================================================
.
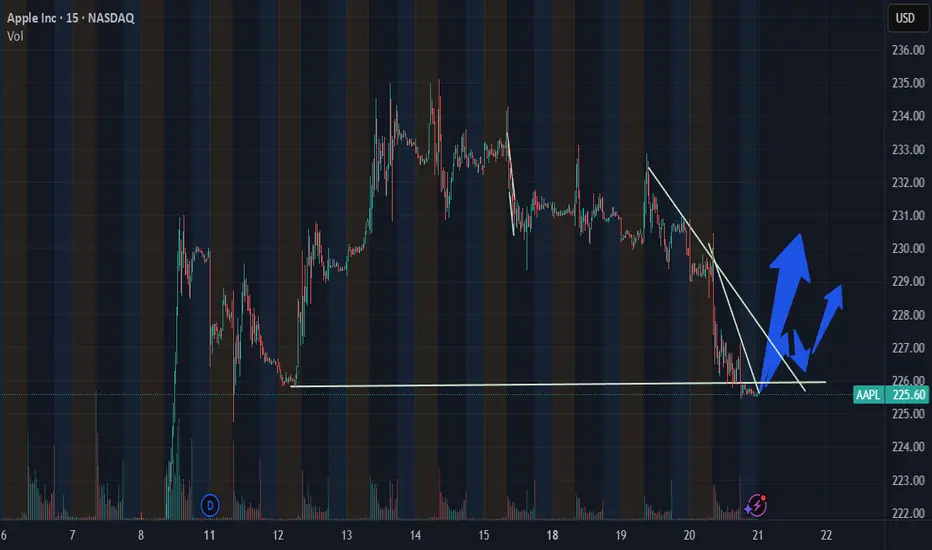
Bullish - Price Retesting price supportIt looks like price is about to go up. The price is being retested. The last time it tested this price it went up
AAPL Long HereSetups here for longs
This looks good for an entry at market on open but flat of lower would be preferred

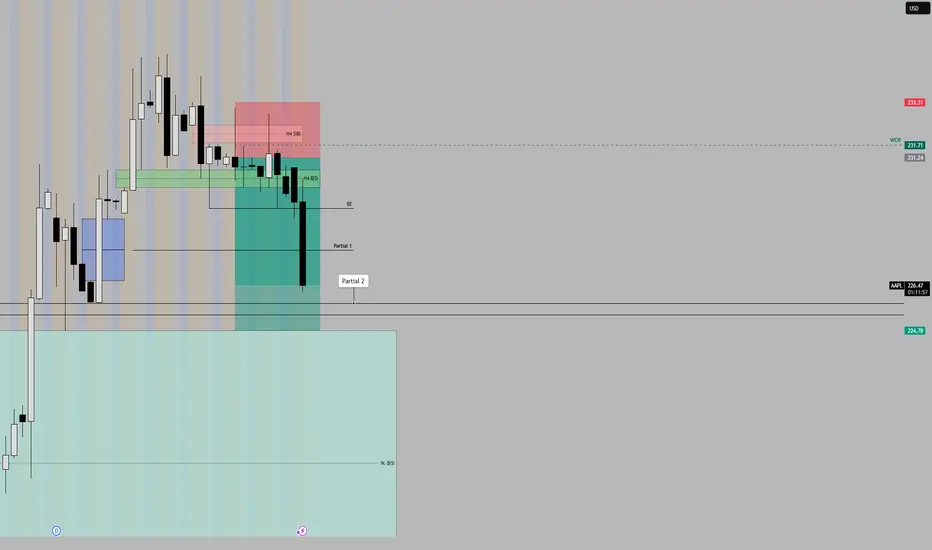
APPL ShortsEntered in this trade beginning of the week and similar narrative on the weekly and H4. Didn't have the best fill and had to stay in drawdown yesterday. But got partials and am Risk free on this trade.
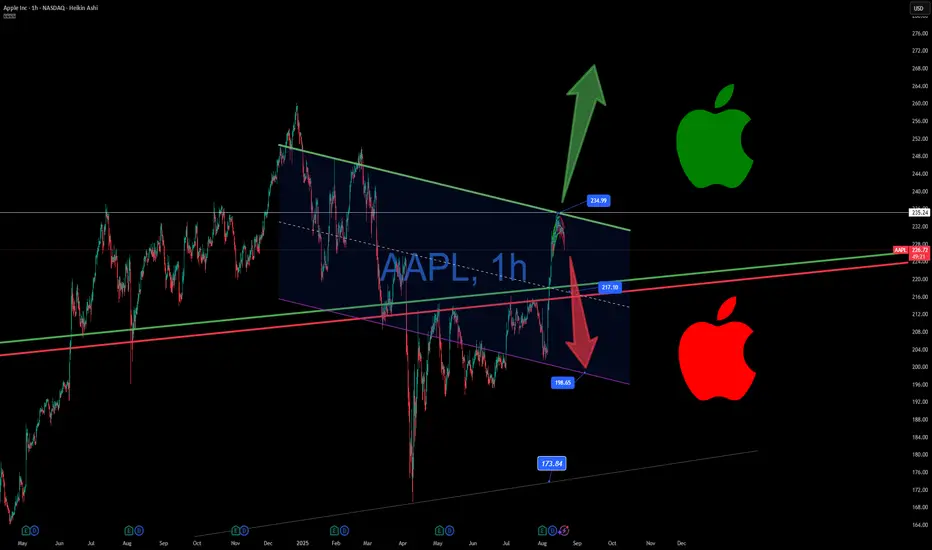
Apple Hits the Ceiling – Breakout or Rejection Next? 🍏📉 Apple Hits the Ceiling – Breakout or Rejection Next? ⚖️🚀
Apple just tagged the top of a long-standing descending channel — 234.99 was the technical ceiling, and price has paused right beneath it. The bulls have done the work to push it here… but confirmation is still missing.
📊 Here's what I’m watching:
🟢 Breakout zone: Clean move over 235 = trigger for continuation
🔴 Rejection risk: Failure here opens downside toward 217, then 198
⚠️ Big picture: This range has been in play for nearly a year — high stakes now
Apple is not just another stock — it's a pillar of U.S. markets, ETFs, and passive portfolios. And in the current Trump-era macro chaos, every breakout or breakdown carries systemic implications.
So while Bitcoin reclaims structure and S&P 500 flirts with resistance, AAPL sits at the edge of a decision.
🧠 My plan?
No FOMO.
✅ Long only on confirmed breakout
❌ Avoid chasing inside the range
We wait, we watch, we act — when price confirms.
One Love,
The FXPROFESSOR 💙
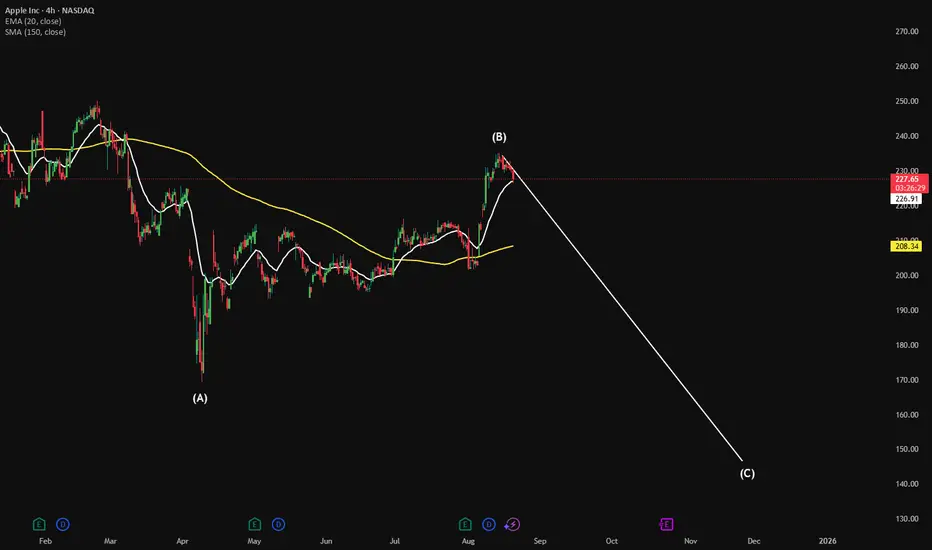
Tim Apple Heading LowerApple wave C should carry to 148ish in a zig zag, Apple completed a higher degree wave 3 at 260
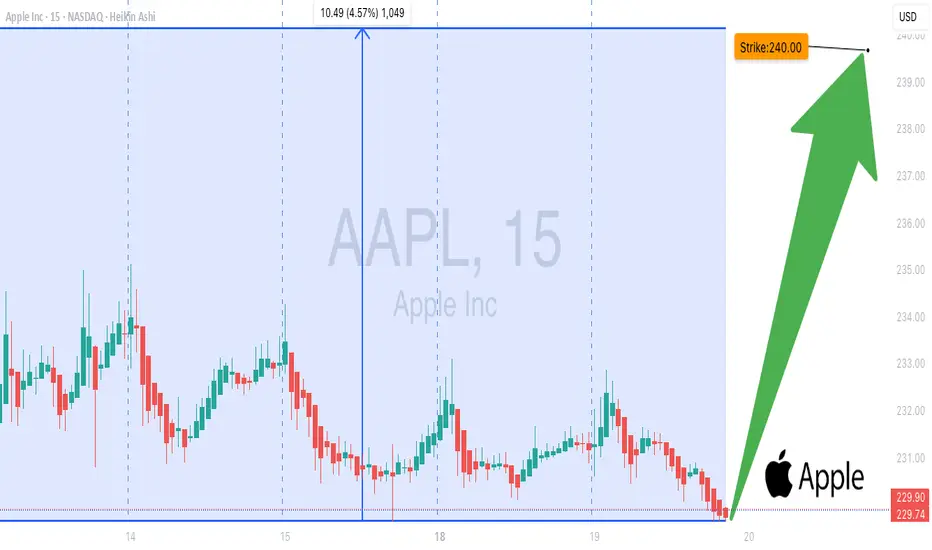
AAPL Weekly Options: $240 Call in Play!
# 🍏💥 AAPL \$240 Call Weekly Trade Setup (Aug 18, 2025) 🚀🔥
### **Market Snapshot**
📊 **Daily RSI / Weekly RSI:** Falling → Neutral ⚖️
📉 **Volume:** Weak (0.6x vs last week) 🚨
🔥 **Options Flow:** Strong bullish calls (1.84 C/P ratio) 💎
✅ **Volatility:** VIX \~15 → Favorable conditions 🌈
💡 **Overall Bias:** Moderate Bullish (but cautious on volume & momentum)
---
### **Model Highlights**
* **Agreement:**
* Weak institutional volume 📉
* Strong call buying sentiment 🔥
* Falling RSI → caution ⚠️
* **Disagreement:**
* Some lean **moderate bullish** 📈
* Others advise **no trade** due to weak confirmations ❌
---
### **💥 Trade Recommendation**
🎯 **Strategy:** Naked Call
* 🍏 **Instrument:** AAPL
* 💵 **Strike:** \$240 Call
* 🗓️ **Expiry:** Aug 22, 2025
* 💰 **Entry Price:** \$0.63
* 🎯 **Profit Target:** \$1.22 (up to 100%)
* 🛑 **Stop Loss:** \$0.37
* ⏰ **Entry Timing:** Market Open
* 📈 **Confidence:** 65%
⚠️ **Risks:**
* Momentum exhaustion 💤
* Weak volume = fragile bullish setup 🚨
* Gamma risk moderate ⚖️
---
### **Trade JSON**
```json
{
"instrument": "AAPL",
"direction": "call",
"strike": 240.00,
"expiry": "2025-08-22",
"confidence": 0.65,
"profit_target": 1.22,
"stop_loss": 0.37,
"size": 1,
"entry_price": 0.63,
"entry_timing": "open",
"signal_publish_time": "2025-08-18 14:38:09 UTC-04:00"
}
```
📊 **Quick Trade Recap:**
🎯 CALL \$240 | 💵 \$0.63 → 🎯 \$1.22 | 🛑 \$0.37 | 📅 Aug 22 | 📈 65%
AAPL SELL + Stalling out or consolidating?AAPL has had 4 red daily candles volume and strength are slowing It needs to break $230 then we should see $218 in coming weeks before possibly making another run for highs. The run, though I not only predicted and lost money on was for BS reasons, AAPL is lagging in AI and seemingly has no plan there as of yet. The move from $202 to $232 was epic and congrats for those who has the correct expiration on their calls as I did not.....
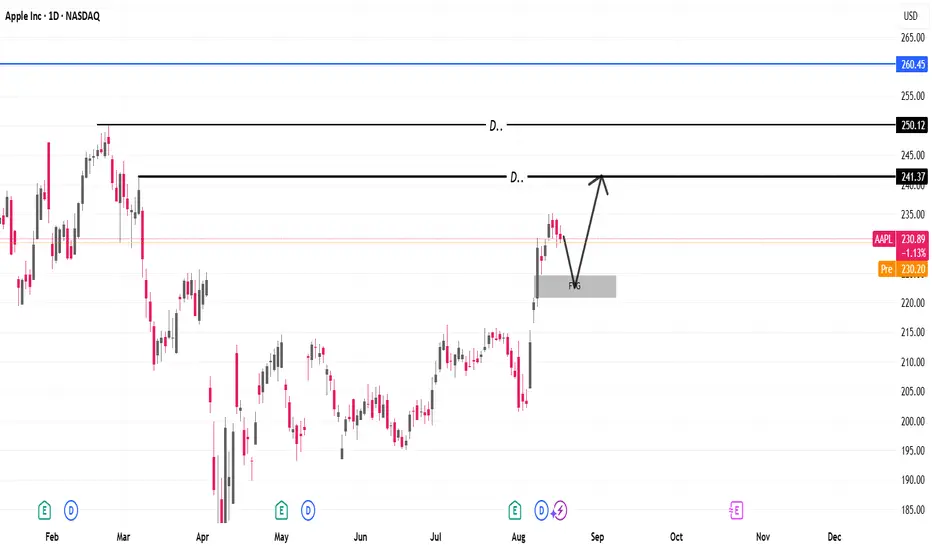
Apple stock analysisApple shares are waiting for a correction of the price gap in the daily and then after that we are heading to the level of 241.37 , after which we can continue to the level of 250.12
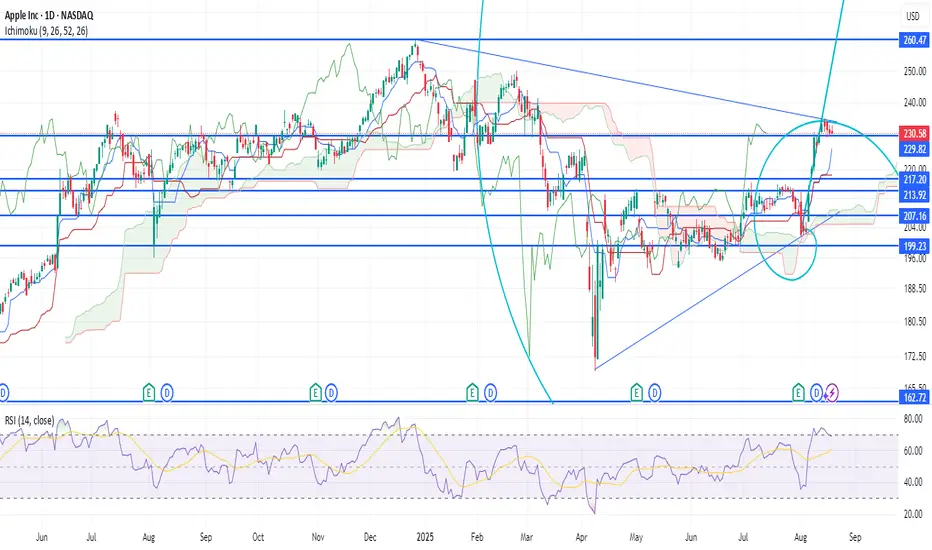
AAPL Headed for Breakdown? Bears Eye $182 Support🍎 AAPL Weekly Chart Analysis — Bearish Outlook
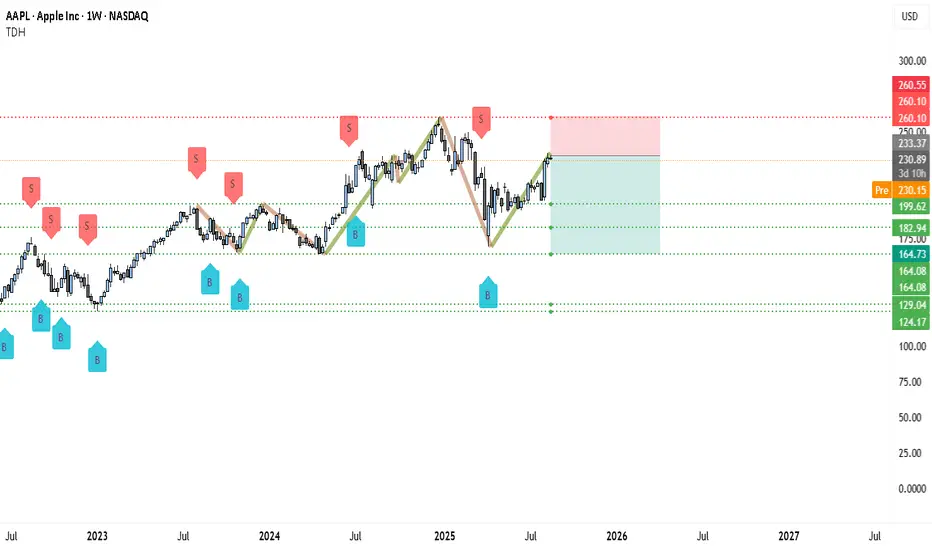
Apple (AAPL) is trading near $230–233 on the weekly chart after staging a rebound from early 2025 lows. The chart, however, shows a clear double-top pattern around the $260.10–260.55 resistance zone (red dashed line), which has repeatedly acted as a ceiling. Each test of this zone has been followed by sharp corrections, and the most recent “S” (sell) marker confirms this rejection area as a strong supply zone.
The latest rally has brought price back toward resistance, but structure-wise AAPL is printing lower highs and lower lows since mid-2024. The bounce into $230–233 looks more like a relief rally within a larger corrective phase rather than a fresh bullish trend.
________________________________________
🔎 Bearish Justifications
• Double/Triple Resistance Layer: $260 has capped price multiple times. Without a clear weekly close above it, bears remain in control.
• Trend Structure: From July 2024 peak to early 2025 lows, price made a decisive lower low. The current rally has failed to reclaim that structure.
• Volume Trap: Weekly candles show waning momentum on rallies—less aggressive buying versus prior uptrends.
• Clean Downside Ladder: The chart highlights green dotted support zones at $199 → $182 → $164 → $129 → $124. If $230–233 fails to hold, price could unwind quickly toward these levels.
________________________________________
🔴 AAPL Short Setup (Weekly Chart)
• Entry Zone: $230–233 rejection area (current price)
• Stop-Loss: Above $260.55 (strong invalidation level, beyond supply zone) ❌
• Target 1: $199 (psychological + technical support, book partial profits ✅)
• Target 2: $182.94 (major mid-term support, lock more gains 🔒)
• Target 3: $164.73 (deeper corrective target if selling accelerates 📉)
• Stretch Target: $129–124 if broader market weakness hits tech
________________________________________
⚠️ Risk & Trade Management
Given that this is a weekly timeframe setup, swings will be larg6e and volatile. Position sizing should be smaller than usual because stops and targets are wide. Booking partial profits at $199 and $182 is essential — this way, you reduce risk exposure and can let the remainder run. If AAPL surprisingly pushes above $260 and closes strong, the bearish thesis is invalid and shorts should exit rather than hold against trend.
✅ In summary, AAPL looks heavy under $260, with the current bounce likely a retracement rally rather than fresh bullish strength. Unless bulls can flip $260 into support, the chart favors a short bias with targets at $199 → $182 → $164.