$ABBV looking to come up on the right side of its base!Notes:
* Great earnings track record
* Very strong up trend on all time frames
* Pays out dividends
* Coming up on the right side of its base after ~4 months
* Has been in a tight range of ~3.8% for the past 3 weeks
Technicals:
Sector: Healthcare - Drug Manufacturers - General
Relative Strength vs. Sector: 1.91
Relative Strength vs. SP500: 1.54
U/D Ratio: 1.76
Base Depth: 26.75%
Distance from breakout buy point: -13.75%
Volume 8.02% above its 15 day avg.
Trade Idea:
* You can get in now as the price is very close to its 50 day line and has been using it as support for the past 3 weeks
* If you want to be safe you can wait for the breakout from this tight range with a break above 154.07
* This stock usually has local tops when the price closes around 10.96% above its 50 EMA
* Consider selling into strength if the price closes 10.76% to 11.16% (or higher) above its 50 EMA
* The last closing price is 0.11% away from its 50 EMA
Trade ideas


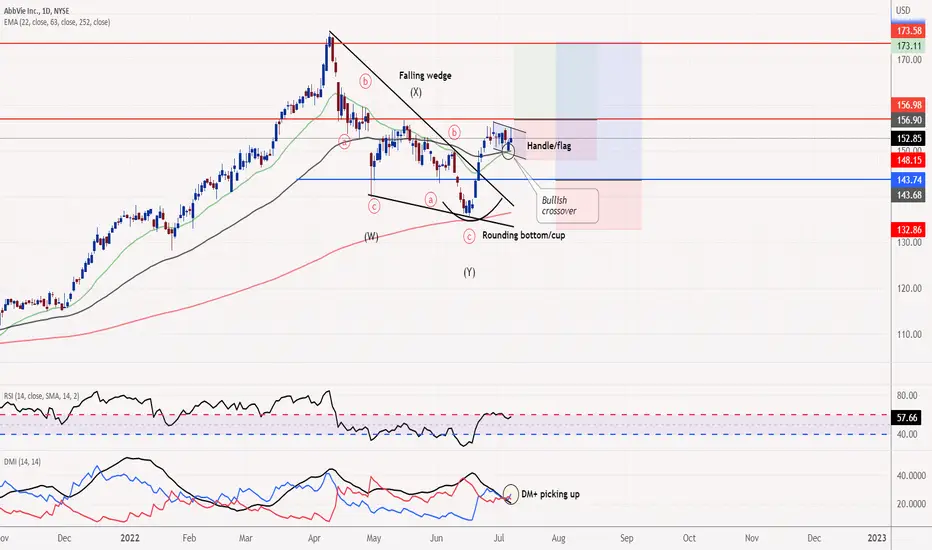
Two strategy approach to ABBV, buy on throwback or a break outABBV has broken out of the falling wedge and with that, it confirmed the terminal end of the correction. With the recent cup and handle formation, we think that a bullish upside may come however, Friday's shooting star is a concern and as such, we will place the buy order at US$156.90 to confirm the breakout trade. Another strategy we have in mind is to wait until prices retrace to their nearest support at US$143.74 to anticipate a rebound.
ABBV - FUNCHARTS - Follow the TrendNote: Funcharts are interesting charts I have found that offer a potentially unique perspective on a stock. Sometimes I’ll throw something out there that you might find controversial or wrong headed. If that’s the case your 2 cents worth is most welcome.
Abbvie (ABBV) listed on the US market sets up nicely as a Trend Following stock. If you are in Tradingview insert the Supertrend Strategy and change the inputs to a 50 period ATR length with a factor of 2 times ATR trailing stop.
The strategy will buy when the daily closing price closes above the ATR trailing stop and go short when the price closes below the ATR trailing stop (shown in blue and red on the chart).
A look at the performance summary for long trades shows 44% winning trend with a win:loss ratio of 2.22 with a profit of over 109% through the period. Whilst buy and hold was the best strategy overall the drawdown was much lower for the trend following strategy and almost as much money was made. Stock like this that trend nicely, whilst allowing you to manage downside risk can be used with a certain amount of leverage as it follows the age old mantra of letting profits run and cutting losses early.
As with all trend following strategies, a low win rate but high win:loss ratio is to be expected.

$ABBV #supertrend #breakout#ABBV Breakout 🚀 in 1h Chart - Target 170$ 🧲
All Entry Criteria have been met:
1. Price above 10, 20 & 50 EMA ✅
2. Consolidation Phase in Uptrend ✅
3. Breakout on above average Volume ✅

potential double top in play 🔔should see a move lower after this rejection from resistance/rejection from overbought RSI zone.
stop loss above resistance and targeting 150.49-143.35-135.71

ABBV Still continuing its breakout from that Trend Line.ABBV - Still going if you like to play the 8/21 EMA cross up using Renko Charts & Ripster EMA Clouds. Also solid continuation once the Green Clouds crossed above the Yellow Clouds and broke the TL up.

ABBV 4.618 Rejection After Steep RisePreviously a rising wedge led to a bullish break out which touched the 1.618 Fibonacci circle level
As of current a rising wedge has pushed price way up to 4.618 similarly to the earlier scenario
And also similar to the first situation we will see a bearish move following this steep rise
The rejection has already begun

24/5/2022 NYSE (ABBV)Short (Entry Price) below the black line and exit (Stop Loss) above the red line. Can take profit at the suggested Target Price.
Entry Price: $150.52
Target Price: $147.52
Stop Loss: $153.52

Potential Break Above Or Below Structure On AbvieA potential break above or below major structural levels on ABBV will indicate what direction it will be headed for the coming weeks, for now we can only wait and see what price does.

$ABBV with a Bullish outlook following its earnings #Stocks The PEAD projected a Bullish outlook for $ABBV after a Negative Under reaction following its earnings release placing the stock in drift D with an expected accuracy of 100%.

ABBV - Zero To Five Count And Broken TrendlineOn this monthly chart we see the 0-5 count.
In my framework, the framework of the pitchfork, a 0-5 count means, that whenever 5 is reached, there is a high potential for a turn in the opposite direction, starting a new 0-5 count.
On the monthly chart we also see that the CL was reached, and price seems to get rejected. So far a nice combination with the 0-5 count.
Further more, the Trend line on the daily chart was broken with higher volume, three days in a row. A good confirmation of the move.
Against a short is the fact, that ABBV is in a strong phase compared to the overall market. And the monthly Stochastic has not broken it's average yet.
And because of this AND earnings ahead, my position will be smaller than usual, and I'm loading the boat if after earnings we see more decline in price, combined with price action.
#besmartdonttradeafart

will it make it back above or break the trend support ? ABBV broke below trend support but trying to climb back above! make or break it area!
above 165.15 we can target 170.51-175.88, below 156.47 we can target 152.21-145.95

$ABBV Epic Short in the MakingABBV has been on an epic blast higher and is Vertical off the monthly moving averages. Looking for a round number 180, 200 or into the extreme extension above 210. Shorts should be looking to build a nice position on this with time as it continues to extend. Short back down to the Discount zone.

ABBV due for a major pullbackABBV has benefited from institutional investors plowing into it while they force the rest of the market to fall...My guess is this will fall while they pull their money and buy quality tech at massive discounts. Today's candle looks like a top. Adding puts 3 weeks out.

Abbvie Inc possible reversalThe Abbvie might give a possible bearish pattern so previous buyers can take profit right now. The strategy for short sellers is given in the chart. In case these levels hold and an increase in the price is seen then the buyers can buy it at a later price of 154.

AbbVie | ABBV | Due for a CorrectionAbbVie ( NYSE:ABBV ) looks weak at resistance and may be due for a drop in the coming weeks. Pretty strong bearish divergence. Insiders selling almost $16 million worth of shares in the past month at an average of $147.87 (source: OpenInsider). If this starts to drop, support points are the 50 EMA (yellow line), $135-$136, and then the support lines / 200 EMA. Small gap to fill between $145.70 and $145.76.
New drug approvals or positive company outlook could change this forecast.

$ABBV with a Neutral outlook following its earnings #Stocks The PEAD projected a Neutral outlook for $ABBV after a Negative over reaction following its earnings release placing the stock in drift C with an expected accuracy of 100%.

$ABBV ToppingWe broke out of an ascending wedge to an even steep ascending wedge and the RSI even on the monthly chart is oversold.
I see us falling soon, likely to test resistance turned support on the top of the channel at around 120.

2/3/2022 NYSE (ABBV)Buy (Entry Price) above the black line and exit (Stop Loss) below the red line. Can take profit at the suggested Target Price.
Entry Price: $148.09
Target Price: $149.49
Stop Loss: $145.76


Top of the channel.Buffet just released their 13F. The fund dropped all their shares on ABBV and BMY. Both are at the top of the channel. Yellow line is my prediction.

$ABBV - DO NOT FOLLOW JOE TERRANOVA @CNBCJoe just recommended ABBV. Great company, way over valued and he would more likely be selling into your buying. Do not follow these fools.
