Massive Upside Ahead: Top 5 Stocks With Big 2026 Potential📌 Top 5 Stocks for 2026 (Monthly Chart Setups)
I just published a new breakdown focused on multi-month / multi-year moves — not short-term noise. Using the monthly timeframe, I walk through structure + momentum to find the next potential 2x–10x runners.
Names covered:
• NYSE:ZETA – cup & handle developing, holding key MAs + volume shelf, momentum turning
• NYSE:ONTO – monthly reversal structure + bullish momentum setup building
• NYSE:UNH – “left for dead” reset → reclaim + room back to key MAs
• NASDAQ:ONDS – rounded bottom breakout structure, momentum box intact, multi-target roadmap
• NASDAQ:ADBE – extreme oversold reset, bullish reversal potential from long-term support
Question for you:
Which one has the cleanest monthly setup right now — and what ticker should I chart next?
Adobe Inc. Shs Cert Deposito Arg Repr 0.02272727
No trades
Market insights

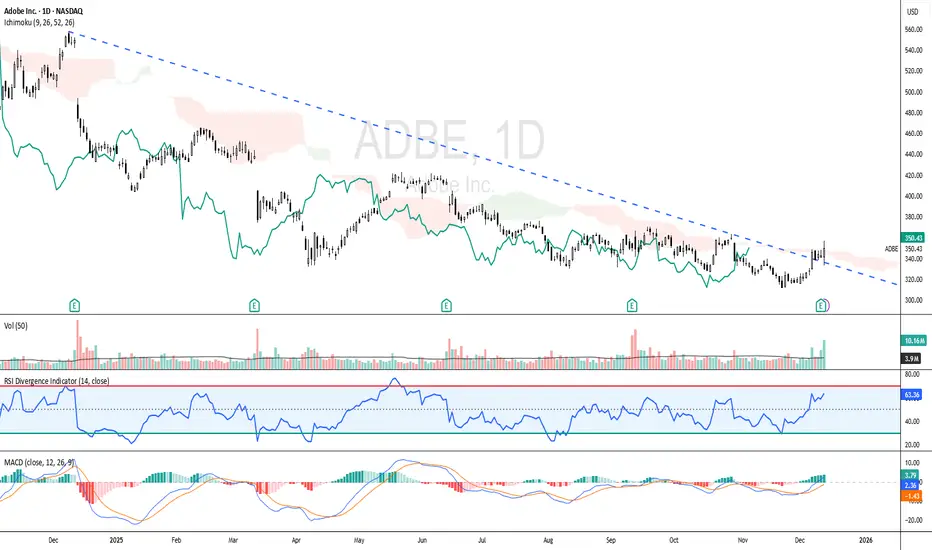
ADOBE - Short-term Bullish SetupADBE - CURRENT PRICE : 350.43
🔼 Short-term bullish outlook as price breaks above the downtrend line, signalling a potential trend reversal. 💪 RSI remains bullish above the mid-line, while MACD shows a positive crossover 📈, strengthening the upside momentum. ☁️ The Ichimoku Chikou Span (green line) is now above past candlesticks, supporting a shift toward bullish sentiment. Increasing volume on the breakout indicates strong buyer participation. If momentum continues, upside targets are at 170 and 190, with 130 as the key support to monitor.
ENTRY PRICE : 348.00 - 350.43
FIRST TARGET : 170.00
SECOND TARGET : 190.00
SUPPORT : 130.00
ADBE: Spring/Shakeout confirmedADBE:
.
Spring/Shakeout confirmed.
Accumuation range swing and bottom is being confirmed. Waiting for a comeback way like this.
.
US STOCKS- WALL STREET DREAM- LET'S THE MARKET SPEAK!


Breaking: Adobe Forecasts Annual Revenue Above EstimateAdobe (NASDAQ; ADBE), forecast fiscal 2026 revenue and profit above Wall Street expectations on Wednesday, signaling strong demand for the Photoshop maker's design tools and increasing monetization for its artificial intelligence offerings.
Since the launch of ChatGPT in 2022, Adobe has made heavy bets on generative AI with its Firefly tool, which can be integrated across the company's Creative Cloud suite to create images and videos, in an attempt to draw users in.
Adobe is seeing strong growth in AI adoption, with monthly active users for its freemium offerings increasing 35% year over year to over 70 million, Says CFO Dan Durn.
"We're seeing significant strength in Creative Cloud Pro, Photoshop, Lightroom," he said, adding that natively embedding generative AI into these products is paying off.
In its push into the ad market, last month, Adobe said it would acquire Semrush (SEMR.N), opens new tab for $1.9 billion to help marketers better understand how their brands are seen by online consumers through searches on websites and GenAI bots such as ChatGPT and Gemini.
Technically, NASDAQ:ADBE stock is in a Diamond-like pattern characterised by a widening and then narrowing price range, creating a shape similar to a diamond. These pattern often provide us with a hint of market reversal points in the financial markets.
With RSI at 58 s little thrust from NASDAQ:ADBE stock to break the ceiling of the diamond could resort to a bullish reversal pattern in the long run.
Analyst Summary
According to 23 analysts, the average rating for ADBE stock is "Buy." The 12-month stock price target is $453.48, which is an increase of 32.16% from the latest price.
About ADBE
Adobe Inc. operates as a technology company worldwide. Its Digital Media segment offers products and services that enable individuals, teams, and enterprises to create, publish, and promote content; Document Cloud, a cloud-based document services platform; and Creative Cloud, a subscription service that allows subscribers to use its creative products and applications (apps) integrated with cloud-delivered services across various surfaces and platforms

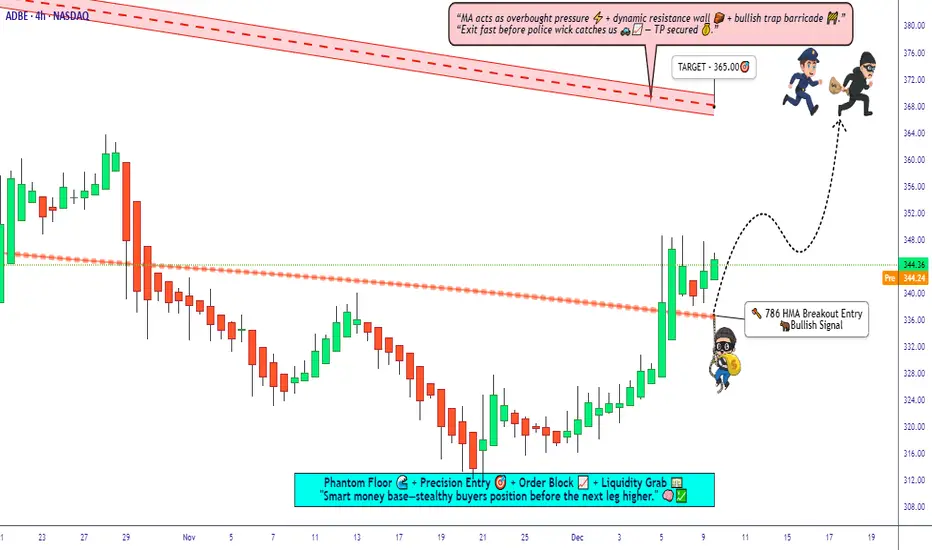
ADBE Setup • HMA ⇧ Breakout with Structured Swing Targets🧨 ADBE – Adobe, Inc. | NASDAQ 🔥 “Stock Market Profit Playbook” (Swing Trade)
HULL Moving Average Breakout • Bullish Momentum Setup 💹😎
**📘 Plan Overview — Bullish Setup Confirmed
The bullish structure is validated by a Hull Moving Average (HMA) breakout, signaling upward momentum building across the swing-trade timeframe. 📈✨
This setup follows the Thief Strategy style — a multi-layered limit order approach designed to average into strong breakout conditions.
🎯 Entry Plan — Thief Layer Strategy (Limit Order Stacking)
Using the Thief layering concept, entries are placed across multiple price levels to scale into strength.
Suggested entry layers (you may increase based on your own risk plan):
🟢 325.00
🟢 330.00
🟢 335.00
🟢 340.00
(This is a layered style entry — NOT a recommendation. Please adjust based on your own risk-to-reward model.)
🛑 Stop-Loss — Thief SL Plan
Stop Loss: 🔻 315.00
Note: Dear Ladies & Gentlemen (Thief OG’s) — this SL is not a recommendation.
It’s your choice, your risk, your money. Manage it as you see fit. 💼⚠️
💰 Target — TMA Resistance + Overbought Trap Zone
Take Profit: 🎉 365.00
Why?
🔷 Triangular Moving Average (TMA) acting as dynamic resistance
🔷 Market showing overbought conditions
🔷 Trap zone potential — so taking profits is wise
Note: Dear Ladies & Gentlemen (Thief OG’s) — this TP is also not a recommendation.
Secure your profits based on your personal plan! 💵🔥
📡 Correlated Watchlist — Related Pairs to Monitor
Here are correlated tickers worth watching for sentiment, sector strength & cross-market validation:
🎨 Adobe Sector / Tech Momentum Checks
NASDAQ:MSFT — Cloud + enterprise software correlation; strong tech flows often lift ADBE.
NYSE:CRM — Software sector sentiment gauge; similar earnings-reaction behavior.
NASDAQ:AAPL — Large-cap tech risk-on/off mood setter.
NASDAQ:GOOGL — Digital services & ad-ecosystem performance can indirectly influence ADBE flows.
📈 Key Points
Tech sector strength → supports ADBE upside momentum
If NASDAQ:QQQ is strong → ADBE breakout probability increases
If volatility spikes → layered entries help control AVG price
If US10Y yields rise → tech stocks may temporarily pull back
Keep these in your radar to validate strength or weakness across the broader tech ecosystem. 🔍⚡
✨ “If you find value in my analysis, a 👍 and 🚀 boost is much appreciated — it helps me share more setups with the community!”
Disclaimer: This is thief style trading strategy just for fun. 😄🕵️♂️
#ADBE #Adobe #SwingTrade #ThiefStrategy #HullMA #BreakoutTrading #StockMarket #NASDAQ #TechnicalAnalysis #TMA #LayeredEntries #TraderLife #PriceAction #ChartAnalysis #RiskManagement #USStocks #QQQ #TechSector #TradingView
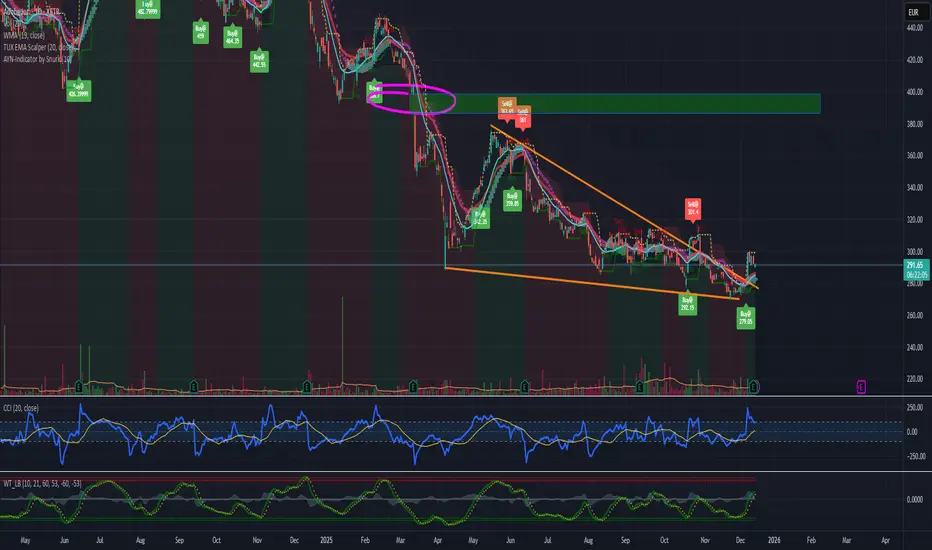
ADBE📌Revenue for the first six months of FY2025. Year-end revenue: $11.587 billion (up 10.4% y/y)
Net profit for the first six months: $3.502 billion (an impressive 60% y-o-y growth)
Q4 expectations (reported December 10): revenue of $6.075 - $6.125 billion, marking the company's first quarter with revenue exceeding $6 billion.
We're currently seeing a large triangle forming, and we're currently near its lower boundary...📊

(ADBE): Navigating the AI Creative FrontierAdobe Inc. (NASDAQ: ADBE), the global leader in creative software, has delivered a resounding vote of confidence in its strategic direction by issuing robust financial guidance that surpasses Wall Street expectations. On December 10, the company projected fiscal year 2026 revenue to land between $25.90 billion and $26.10 billion, eclipsing the consensus estimate of $25.87 billion. Similarly, its adjusted earnings per share forecast of $23.30 to $23.50 topped the anticipated $23.34. This optimistic outlook is a direct signal of the powerful underlying demand for Adobe's core design tools and, more critically, the accelerating monetization of its comprehensive suite of artificial intelligence offerings.
Since the paradigm-shifting launch of OpenAI's ChatGPT in late 2022, Adobe has aggressively positioned itself at the forefront of the generative AI revolution. Its flagship AI engine, Firefly, has been deeply integrated across its industry-standard Creative Cloud suite, empowering users to generate and manipulate images and videos with unprecedented ease. This strategic bet is designed to both retain its vast existing user base and attract a new generation of creators. The results are beginning to materialize impressively: monthly active users for Adobe's freemium offerings have surged 35% year-over-year to surpass 70 million. CFO Dan Durn attributed this growth to "significant strength" in flagship products like Creative Cloud Pro, Photoshop, and Lightroom, affirming that embedding generative AI natively into these applications is a decisive commercial success.
However, Adobe's dominance is being tested in an era of AI proliferation. The very technology it is leveraging is simultaneously lowering barriers to entry, enabling nimble rivals and new startups to rapidly innovate and challenge its market position. In response, Adobe is executing a multi-pronged strategy to fortify its ecosystem. Beyond creative tools, the company is pushing deeper into the digital marketing and advertising sphere. Its recently announced $1.9 billion acquisition of Semrush is a strategic move to equip marketers with superior competitive intelligence, helping them understand brand perception across traditional search engines and, vitally, within generative AI chatbots like ChatGPT and Google's Gemini.
A particularly significant and forward-looking development is Adobe's pioneering integration directly into the ChatGPT interface itself. This move represents a masterstroke in distribution and user acquisition. By placing streamlined versions of Photoshop, Acrobat, and Adobe Express inside ChatGPT, Adobe gains direct exposure to over 800 million weekly users of the world's most popular AI chatbot. This transforms ChatGPT from a mere conversational tool into a potent discovery and onboarding channel for Adobe's creative suite. Users can now perform essential tasks—such as adjusting image properties in Photoshop, designing simple graphics in Express, or managing PDFs in Acrobat—without ever leaving the chat interface. While this initial integration is deliberately streamlined (lacking advanced features like Generative Fill), it serves as a low-friction gateway. It is strategically designed to capture the interest of beginners, students, and casual creators who might have found Adobe's professional tools intimidating or inaccessible, gently guiding them toward the full, native applications when more complex needs arise.
From a financial restructuring perspective, Adobe has also announced plans to recalibrate its forecast and reporting segments starting in fiscal 2026. The new framework will sharpen focus on subscription revenue streams across distinct customer groups and emphasize year-end Annual Recurring Revenue (ARR). This shift underscores the company's transition to a more predictable, subscription-dominated business model and provides clearer metrics for investors to gauge the health and growth of its core SaaS operations.
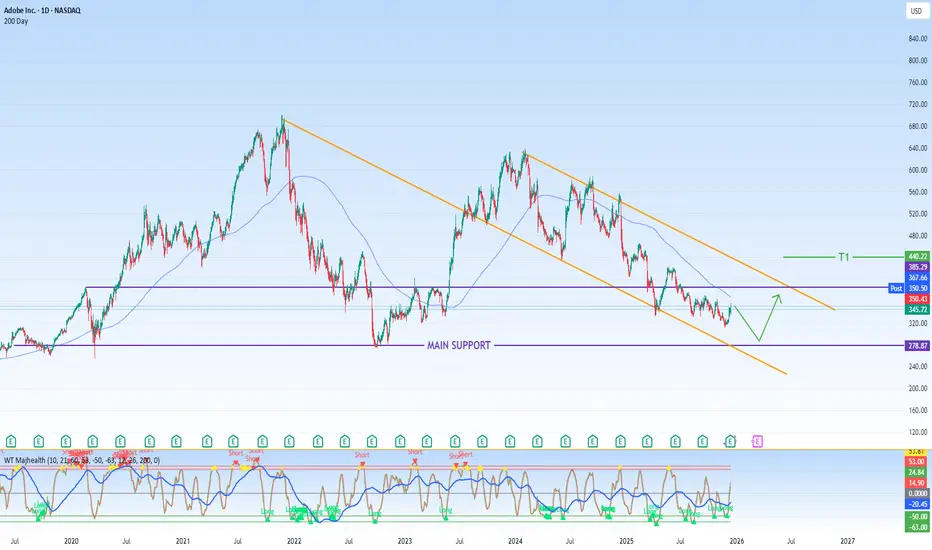
Technical and Investment Framework:
In light of this strong fundamental and strategic positioning, a clear technical and investment framework emerges for Adobe's stock.
Primary Support Zone: $280 - This level represents a major consolidation area and a foundation of long-term investor confidence. It aligns with a valuation that respects Adobe's mature, cash-generative business while pricing in its successful transition and growth in the AI era. A hold above this support would affirm the underlying bullish thesis.
Take Profit Target: $440 - This upward target reflects the anticipated rerating potential as Adobe's AI monetization gains further traction and its strategic initiatives—including the ChatGPT integration and Semrush acquisition—begin to yield measurable contributions to top-line growth and market share expansion. Achieving this level would signify a successful market recognition of Adobe's evolution from a traditional software giant into a central player in the AI-powered creative and marketing economy.
In conclusion, Adobe is navigating a competitive landscape with strategic acumen, leveraging its immense scale, trusted brand, and deep integration of AI to drive growth. Its bold guidance for 2026, coupled with innovative distribution partnerships and strategic acquisitions, paints a picture of a company not just adapting to the AI wave but aiming to shape it. While competition is intensifying, Adobe's latest moves position it to widen its moat, expand its user base, and unlock new revenue streams, supporting a constructive outlook for patient investors.
$ADBE. Should hit $400+ in the next weeks/months. GM, still holding $ADBE. Should hit $400+ in the next weeks/months.
Why?:
- Stretched downtrend
- At major support
- In the next years they will buy back $25 billion in shares.

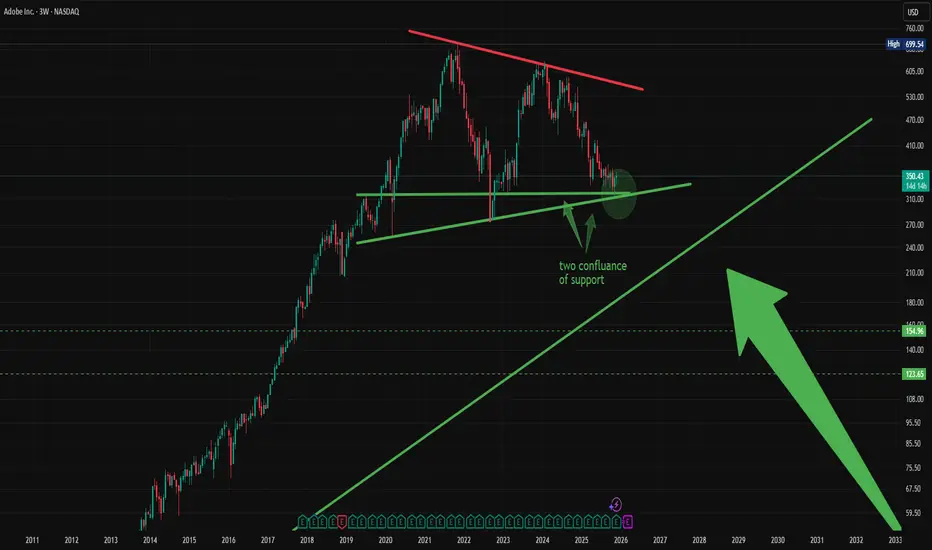
adobe wakening up adbe has been patiently consolidating in a wedge for 5 years .. we are now getting conformation of a breakout..as you can see we have not one but two confluence of support that gives us a very high probability of a reversal and now we can enter with confidence.
ADBE | Breakout Play After Earnings | Eyes on $360 and $390Adobe NASDAQ:ADBE has finally cleared the $350 volume wall, a level that’s acted as firm resistance for months. The breakout was backed by strong earnings, signaling momentum could continue as bulls step in. This move opens the door for a potential rally continuation, especially if the broader tech sector remains strong.
📉 Trade Setup:
I'm watching for a retest of support around $330–$335 — a former resistance zone that could now act as a solid base for the next leg up. A clean bounce from this area could offer a high-probability long entry.
🎯 Targets: $360 (initial), $390 (extended)
❌ Stop Loss: Below $310 to protect against deeper pullbacks

ADB reaching its bottom?Hi,
Just a note for myself.
Clear bottom structure, long term disembarking.
Profitable company, industry leader.
Estimated revenue and profits -> growing.
EPS growing.
Additionally have clear buy signals and falling triangle breakout.
My expectation is to see 450 in 2026.
BUY!
AG
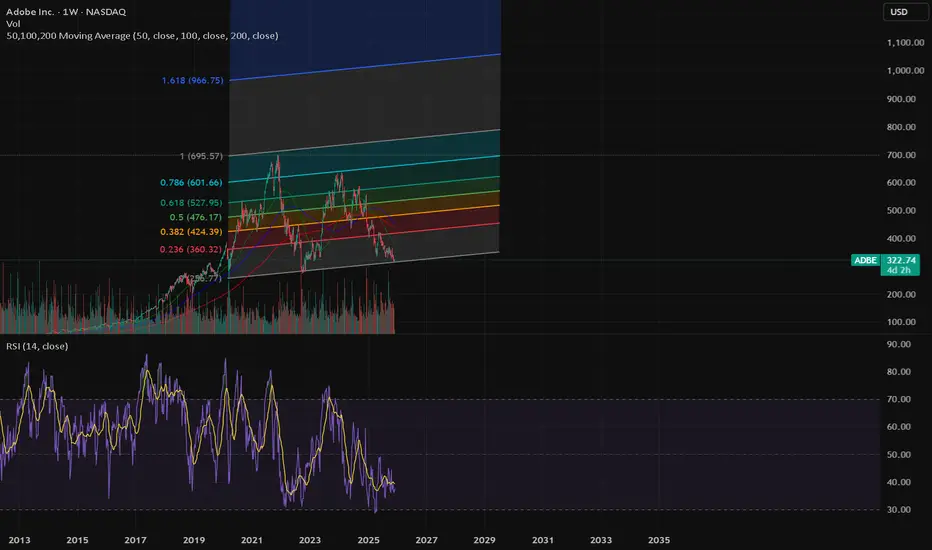
ADOBE CYCLEProjection for the Next Growth Cycle
The chart suggests that ADBE stock has just emerged (or is emerging) from its eighth correction/consolidation cycle (the one lasting 19 bars/579 days).
If a new growth cycle were to start from the recent low (which is around $316.11, as indicated by the data from the last monthly candle):
Scenario Percentage Gain
Price Projection (Starting from $316.11)
Minimum Upside (42%) ~ $449
Medium Upside (89%) ~ $597
Maximum Upside (143%) ~ $767

ADBE Earnings Signal: Bullish Momentum With High-Risk UpsideADBE Earnings Signal | 2025-12-10
Signal Quality: Medium (58% confidence)
Risk Level: High
Model Alignment: ⚠️ Partial Conflict
LLM: Buy Calls
Katy: Neutral summary, but time-series shows bullish spikes
Flow: Bullish (PCR 0.53)
Market Conditions:
Pre-earnings dip: –0.96% (24h)
Support: $338.06
Resistance: $350.22
MACD bullish; Stochastics overbought (81.6)
Multi-timeframe trend: 100% Bullish
Volume light (0.5× average) → low conviction ahead of earnings
Fed decision today = added volatility
Why This Trade Leans Bullish:
Katy AI time series targets $348–$351 (up to +2.78%)
Strong institutional call interest (PCR 0.53)
Unusual call activity at $402 strike
Upward earnings expectations from Wall Street
Adobe’s historical 75% beat rate
Risks to Watch:
Overbought technical conditions → short-term pullback risk
Light volume reduces reliability of breakout attempts
Fed decision could override earnings-related movement
Very short expiry (2 days) increases theta + volatility impact
Best Use Case:
Small, speculative call play based on bullish flow + bullish AI spikes, while respecting risk from overbought conditions and macro catalysts.
Position Guidance:
Size: 2% of portfolio
Entry: $11.80
Target: $17.70
Stop: $9.45
Strike: $342.50 Calls
Expiry: 12/12/2025
Bottom Line:
Momentum, options flow, and Katy’s upper targets support a bullish call setup, but overbought indicators and the Fed meeting require tight risk management and smaller sizing.

Incoming Years of Sucess?Bullish bat harmonic pattern spotted on the weekly time frame; no confirmation yet, but as soon as it hit the .886 retracement it reacted positively. We can also see that the third leg of the W formation was completed by forming a higher low.

Adobe Is Down 20%+ YTD. What Its Chart Says Ahead of EarningsAdobe NASDAQ:ADBE plans to release fiscal Q4 results this week at a time when shares of the creative-software giant and former "Cloud King" are down more than 20% year to date. What do ADBE's chart and fundamental analysis say ahead of the report?
Let's take a look:
Adobe's Fundamental Analysis
ADBE expects to unveil its latest earnings after the bell on Wednesday, with the Street looking for $5.40 in adjusted earnings per share on $6.11 billion of revenue.
That would represent a 12.3% gain from the $4.81 in adjusted EPS that Adobe reported in the same quarter last year, as well as 9% growth from its $5.6 billion of sales in fiscal Q4 2024.
Sales growth has actually been a problem for Adobe in recent years, leaving the stock with a valuation of less than 21x forward earnings. That's below the forward price-to-earnings ratio for the S&P 500 as a whole.
A top-line print like what Wall Street is expecting this week won't help matters, as Adobe has posted 10%-11% year-over-year revenue growth for seven consecutive quarters. A 9% gain this time around would represent the first sub-10% growth over the past two years.
Still, Wall Street's community of sell-side analysts appears unfazed.
Of the 31 analysts that I know of that cover ADBE, 26 have boosted their earnings estimates for the upcoming release since the quarter began, while just one lowered their guidance. (Four have made no changes.)
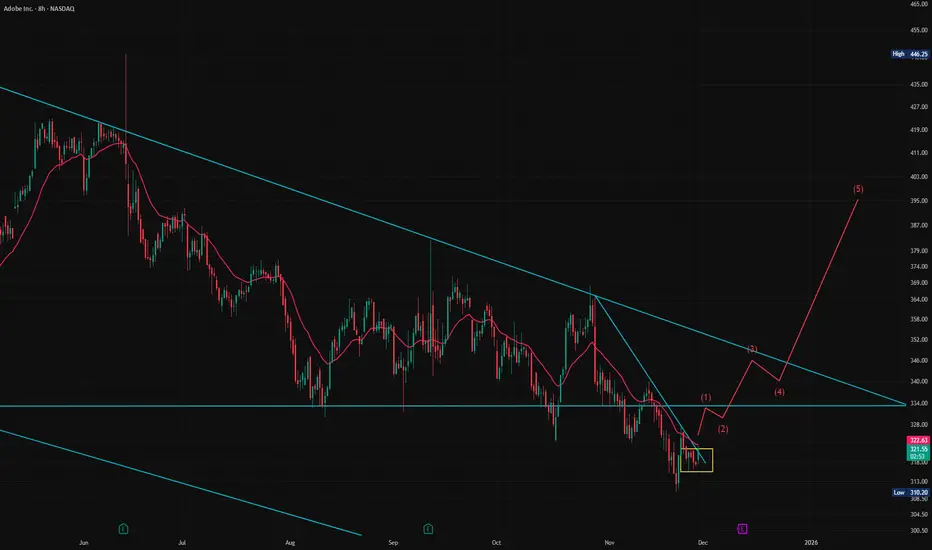
Adobe's Technical Analysis
Now let's see what ADBE's chart looks like going back some eight months and running through Tuesday morning:
Readers will see that Adobe shares fell out of bed after completing a double-top pattern of bearish reversal back in June (as marked with "Top 1" and "Top 2" boxes at the chart's left).
The stock then went on to develop a descending-triangle pattern of bearish continuance that lasted into October (as marked with thick blue diagonal lines at the chart's center).
That formation appeared to work like a charm at first, but then ADBE found support in the $311 area.
In fact, this all might just be a big inverted head-and-shoulders pattern of bullish reversal, but it's too early to be sure.
Meanwhile, Adobe rose 5%+ Friday to a $346.26 close, retaking its 21-day Exponential Average (or "EMA," marked with a green line above) despite no official company news. Holding that line would likely re-engage the swing crowd.
An even bigger test would be if ADBE can hold its 50-day Simple Moving Average (or "SMA," marked with a squiggly blue line), which I see as Adobe's upside pivot. The stock took that level on Friday.
As for Adobe's other technical indicators, they're looking rather mixed.
The stock's Relative Strength Index (the gray line at the chart's top) has exited a period of weakness and is now neutral.
Similarly, Adobe's daily Moving Average Convergence Divergence indicator (or "MACD," denoted by black and gold lines and blue bars at the chart's bottom) is showing some life as well.
The histogram of the 9-day EMA (the blue bars) is now above zero, which is a short-term bullish signal.
The 12-day EMA (the black line) has likewise crossed above the 26-day EMA (the gold line). That's bullish as well -- but both of those lines remain below the zero-bound, which weakens the bullish signal.
An Options Options
Adobe's implied volatility as I write this is calling for a roughly 8% move in the stock's price in response to Wednesday's earnings.
With the stock trading at about $341 Monday afternoon, that would represent about a $27.20 move.
Experienced options traders who aren't averse to risk might choose to employ what's called a "short strangle" in this scenario. That's non-directional strategy used when the trader believes the stock won't move as much as expected.
It's established by selling both a call and put that are out of the money (or "OTM") and have the same expiration dates, while still accounting for implied volatility (or "IV").
Here's an example:
-- Short one ADBE call with a $350 strike price and a Dec. 12 expiration (i.e., post- earnings). This cost about $9 at recent prices.
-- Short one ADBE Dec. 12 $330 put for $7.80 at recent price levels.
Net credit: $16.80.
With a $16.80 net credit, ADBE would either have to trade below $313.20 or above $366.80 at expiration for the options trader to lose money on this set-up.
Should the shares close anywhere between $313.20 and $366.80 at expiration, the options trader would keep the entire $16.80 net credit in the example above.
However, the sale of uncovered options carries significant risk. Shares could trade all the way down to zero or infinitely upward following an earnings release, making the theoretical maximum loss unlimited.
(Moomoo Technologies Inc. Markets Commentator Stephen "Sarge" Guilfoyle had no position in ADBE at the time of writing this column.)
This article discusses technical analysis, other approaches, including fundamental analysis, may offer very different views. The examples provided are for illustrative purposes only and are not intended to be reflective of the results you can expect to achieve. Specific security charts used are for illustrative purposes only and are not a recommendation, offer to sell, or a solicitation of an offer to buy any security. Past investment performance does not indicate or guarantee future success. Returns will vary, and all investments carry risks, including loss of principal. This content is also not a research report and is not intended to serve as the basis for any investment decision. The information contained in this article does not purport to be a complete description of the securities, markets, or developments referred to in this material. Moomoo and its affiliates make no representation or warranty as to the article's adequacy, completeness, accuracy or timeliness for any particular purpose of the above content. Furthermore, there is no guarantee that any statements, estimates, price targets, opinions or forecasts provided herein will prove to be correct.
Options trading is risky and not appropriate for everyone. Read the Options Disclosure Document ( j.moomoo.com ) before trading. Options are complex and you may quickly lose the entire investment. Supporting docs for any claims will be furnished upon request.
Options trading subject to eligibility requirements. Strategies available will depend on options level approved.
Maximum potential loss and profit for options are calculated based on the single leg or an entire multi-leg trade remaining intact until expiration with no option contracts being exercised or assigned. These figures do not account for a portion of a multi-leg strategy being changed or removed or the trader assuming a short or long position in the underlying stock at or before expiration. Therefore, it is possible to lose more than the theoretical max loss of a strategy.
Moomoo is a financial information and trading app offered by Moomoo Technologies Inc. In the U.S., investment products and services on Moomoo are offered by Moomoo Financial Inc., Member FINRA/SIPC.
TradingView is an independent third party not affiliated with Moomoo Financial Inc., Moomoo Technologies Inc., or its affiliates. Moomoo Financial Inc. and its affiliates do not endorse, represent or warrant the completeness and accuracy of the data and information available on the TradingView platform and are not responsible for any services provided by the third-party platform.

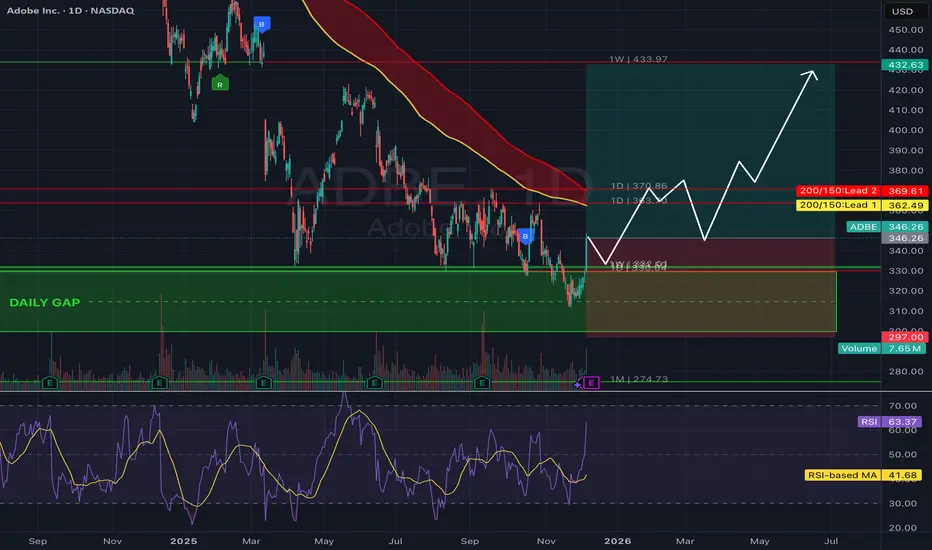
Rendering a ReboundAdobe is currently testing the bottom of a key weekly gap near the $315 level, an important support zone that has historically marked major reversal points. A clean breakout above the $365 level would confirm renewed bullish momentum and open the path toward the $432.63 resistance, which aligns with prior supply zones and the upper range of the long-term channel.
ADBE is showing signs of stabilization after a significant pullback, and with sentiment shifting, the stock appears ready for a bounce. With a well-defined stop loss at $297, this setup offers a strong risk-to-reward ratio, giving traders a favorable upside while tightly managing risk.
Adobe remains a leader in digital creativity, AI content creation (Firefly), and enterprise software—all of which continue to generate long-term growth catalysts. This combination of technical structure and strong fundamentals supports a compelling bullish case.
ADBE Pre-Earnings Call Signal — Strong Rally, Elevated Risk📈 ADBE Trading Info — Earnings Signal (2025-12-09)
BUY CALLS
Confidence: 50% (Medium Conviction)
Risk Level: High — Katy conflict detected
🔢 Options Setup
Strike: $347.50
Expiry: 2025-12-12 (3 days)
Entry Range: $11.75 – $12.25 (Mid: $12.00)
Target 1: $18.00
Target 2: $24.00
Stop Loss: $8.40
Position Size: 2% of portfolio
📊 Market Snapshot
Current Price: $345.65
24h Move: +5.77%
Implied Move: $25.78 (7.5%)
Volume: 0.7× average
PCR: 0.78 (Neutral)
Earnings Date: Dec 10, 2025
🤖 Katy AI (Conflict Warning)
Trend: Neutral
Confidence: 50%
Predicted Move: -1.71% (PUT bias)
Target Price: $340.92
⚠️ KATY–LLM Conflict: LLM bullish / Katy bearish
📰 Sentiment Overview
Mixed analysts (Stifel Buy but lower PT)
Strong fundamentals:
6230% revenue growth
75% beat rate history
Unusual bullish activity at $392C
Pre-earnings rally indicates institutional accumulation
⚠️ Key Notes
High risk due to AI conflict & earnings volatility
Strong run-up increases likelihood of post-earnings whipsaw
Tight stop-loss recommended
Watch price reaction to earnings guidance immediately after release
Small position size required
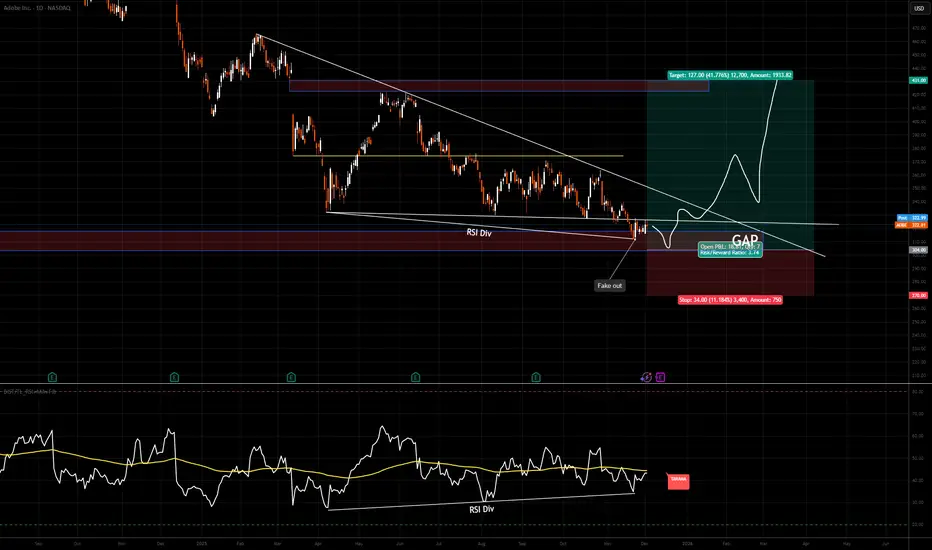
ADBE Fake Out Fill the Gap Descending Wedge PatternI want to start buy from here.
When AI trend end, ADBE will be one of the first stocks that rise.
I'll wait till fill the GAP.
If I'll see "Day Close" above bottom line of the "Descending Wedge Pattern", I'll buy again
My first targe will be GAP at top but I'm expecting more than that.
$ADBE — WEEK 49 TREND REPORT NASDAQ:ADBE — WEEK 49 TREND REPORT
Ticker: NASDAQ:ADBE — 12/02/2025 @ 323$
Timeframe: WEEKLY
This is a reactive structural classification of NASDAQ:ADBE based on the weekly chart as of this timestamp. Price conditions are evaluated as they stand — nothing here is predictive or forward-assumptive.
⸻
1) Current Trend Condition
• Trend Duration: +6 weeks (bearish)
• Trend Reversal Level (Bullish): 337.64$
• Trend Reversal Level (Bullish Confirmation): 365.70$
• Structural Support (38.2%): 424.90$
⸻
2) Structure Health
• Retracement Phase:
Breakdown (establishing price beneath 38.2%)
• Position Status:
Unstable (price below both structural layers)
⸻
3) Temperature
• Cooling Phase
⸻
4) Momentum
• Bearish
⸻
5) Market Sentiment
• Bearish
⸻
Author’s Note
This analysis is fully reactive, not predictive. Market conditions, trend structure, and behavior are classified as they appear in real time. The objective is to identify where directional shifts first occurred, where structural integrity remains intact, and where it would begin to weaken if key levels were breached.
Predictive analysis projects outcomes that do not exist yet. Without price confirmation, prediction is built on baseless assumptions. This framework avoids that entirely by responding only to verified structural changes and live conditions.
The levels shown simply identify where the current trend structure first shifted and where it would begin to lose integrity if breached. Recognizing these boundaries allows for clearer interpretation of market behavior without relying on forward guarantees, speculative projections, or unsupported assumptions.
⸻
Methodology Overview
This classification framework evaluates directional conditions using internal trend-interpretation logic that references price behavior relative to its structural layers. These relationships are used to identify when price movement aligns with the framework’s criteria for directional phases, transition points, or regime shifts. Visual elements or structural labels reflect these internal interpretations, rather than explicit trading signals or preset indicator crossovers. This framework is observational only and does not imply future outcomes.

$adbe Adobe long positionAdobe Inc. (NASDAQ: ADBE), the dominant player in creative software and digital experience solutions, has faced headwinds in 2025, including investor skepticism around AI monetization and competitive pressures from AI-native rivals like Google's Gemini tools. However, as of December 1, 2025, the stock is trading at approximately $320—near its 52-week low of $311.58—presenting a rare entry point for long-term investors. This positions ADBE at a crucial bottom, with technical indicators signaling a potential reversal and fundamentals underscoring undervaluation.
$ADBE at major supportBought NASDAQ:ADBE
Why?:
- Stretched downtrend
- At major support
- In the next years they will buy back $25 billion in shares.
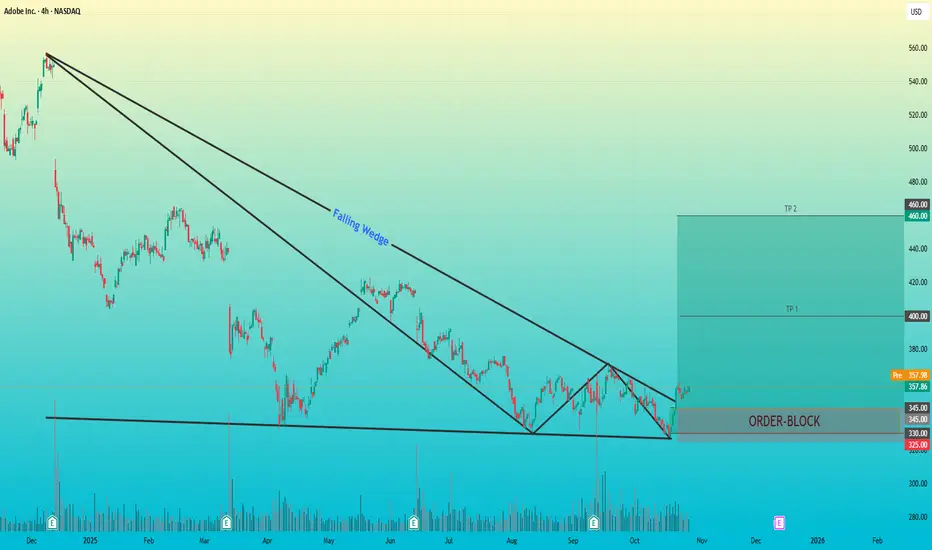
Adobe Inc.(ADBE) – Falling Wedge Breakout + Bullish Order BlockAdobe Inc. (ADBE) – Falling Wedge Breakout + Bullish Order Block
Timeframe: 4H
Pattern: Falling Wedge
Key Zone: Bullish Order Block (325 – 345 USD)
After an extended downtrend, Adobe formed a falling wedge pattern, signaling a potential bullish reversal.
Price recently broke the upper trendline with a clear Change of Character (ChoCH), confirming strength from buyers.
The order block around 325–345 USD acts as a strong demand zone where institutional buying interest is likely to be present.
A successful retest of this area could trigger a continuation move toward the next major resistance around 460 USD.
Trade Outlook
Entry Zone: 335 – 345 (Order Block Retest)
Target: TP 1-- $400
TP 2-- $460
Stop Loss: Below 325
Risk–Reward Ratio: 1 : 3, 5
Bias: Bullish