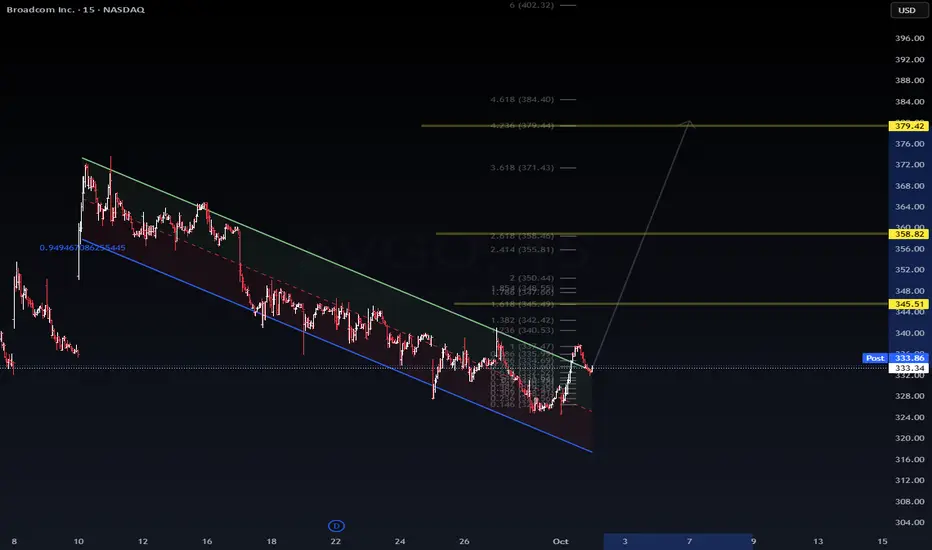
AVGO OCT 2025AVGO (4H): Rejected at 350–345 and still trading under the descending trendline. Distribution overhead persists into 370 where heavy sell programs hit. If buyers can absorb above 345, momentum can shift; otherwise, watch the 316 gap and the 300–290 base for further absorption.
• Upside targets: 370 first; extension 390 on a clean break and hold above 370.
• Downside targets: 316 gap fill; extension 300–290. A failure there opens 249.
#AVGO #globaltrade #investment #investing #stockmarket #wealth #realestate #markets #economy #finance #money #forex #trading #price #business #currency #blockchain #crypto #cryptocurrency #airdrop #btc #ethereum #ico #altcoin #cryptonews #Bitcoin #ipo
Broadcom Inc. Deposito Arg Repr 0.025641 Sh
No trades
Trade ideas

$AVGO | Broadcom – Institutional DSS ProjectionNASDAQ:AVGO | Broadcom – Institutional DSS Projection
Price has broken out of the descending channel and is testing early reversal confirmation.
Immediate resistance: $340.50 – $345.51
Mid-term target: $358.82 (Fib 2.618)
Extended projection: $379.42 (Fib 4.236)
Institutional model suggests accumulation in this zone, with upside momentum building if $334 support holds. Downside invalidation below $328.
📊 Watching for liquidity rotation from semis back into megacaps. AVGO aligned with tech-sector resilience ahead of earnings season.
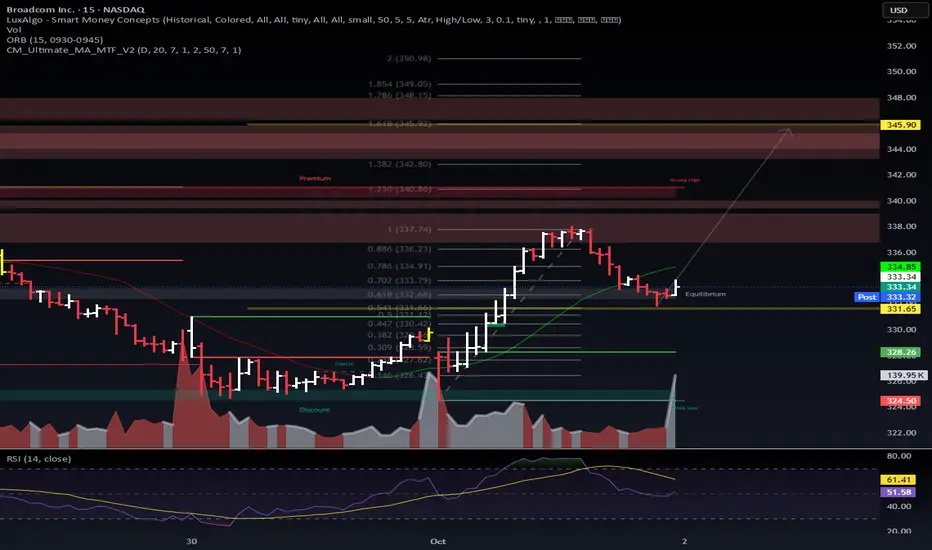
$AVGO – Flow + TA Alignment📈 NASDAQ:AVGO – Flow + TA Alignment
AVGO sitting at equilibrium (~332–333) after tagging resistance. Options flow + fib extensions are pointing toward the next magnet zone.
🔑 Key Levels
Support: 330 → invalidation level.
Short-term target: 346–348 (1.618 fib + heavy call flow strikes).
Mid-term target: 354–356 (Wave (5) projection, aligned with Oct expiries).
Stretch target: 380 (OTM call bets).
🧭 Roadmap
Holding 332–330 → expect quick move into 346–348.
If buyers sustain momentum → extension toward 354–356.
Flow confirms: institutions stacked size on 342.5C, 345C, 340C for October.
Breakdown under 330 = risk back to 328/324 demand.
📊 Flow + TA Confluence
The yellow projection curve shows how options activity + fib mapping align into October.
Heavy near-dated call flow = 345–348 magnet.
Mid-month flow + Elliott count = 354–356 extension.
Outlier 380C = possible overshoot if semis squeeze.
🚀 Outlook: AVGO has confluence into 346 short-term, with Wave 5 potential into mid-350s. Flow + TA speak the same language.
#AVGO #OptionsFlow #VolanX #ElliottWave #AITrading
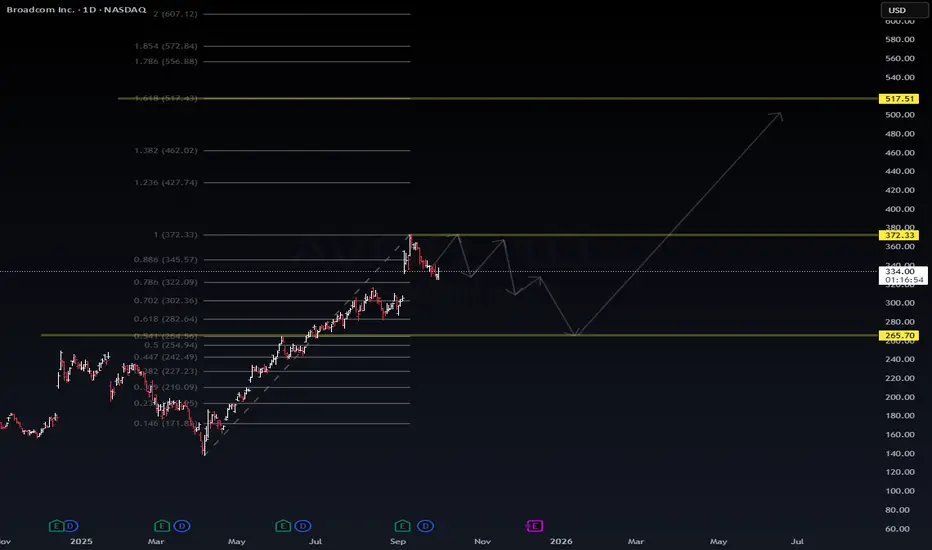
$AVGO | Decision Zone – Bounce or Deeper Pullback?NASDAQ:AVGO | Decision Zone – Bounce or Deeper Pullback?
🔹 Technicals
Current: 333.9 (+1.2%)
Fib retracement showing key levels:
372.3 = resistance / upside pivot
322.0 → 302.0 = short-term support band
265.7 = deeper liquidity target if breakdown extends
Larger fib extensions point toward 517.5+ on sustained uptrend.
🔹 Scenarios
🟢 Bullish Path:
Hold 322–333 support → reclaim 372 → path opens toward 400 → 517.
🔴 Bearish Path:
Failure at 333–322 → momentum drags into 302 → 265 before long-term buyers step in.
📌 Summary
NASDAQ:AVGO sitting mid-structure. 372 is the bull trigger, 322 is the bear trigger. Watch liquidity rotation here for the next major leg.
#AVGO #Semiconductors #AI #Trading
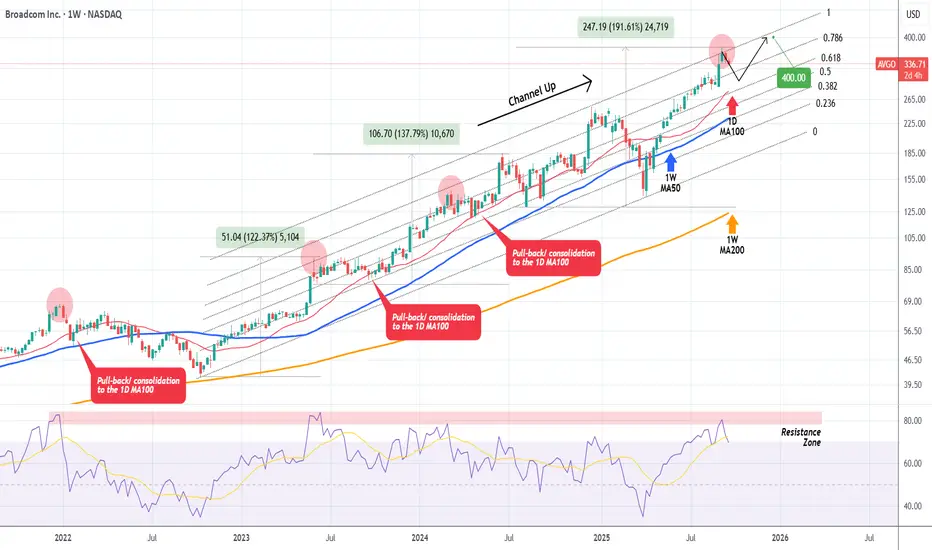
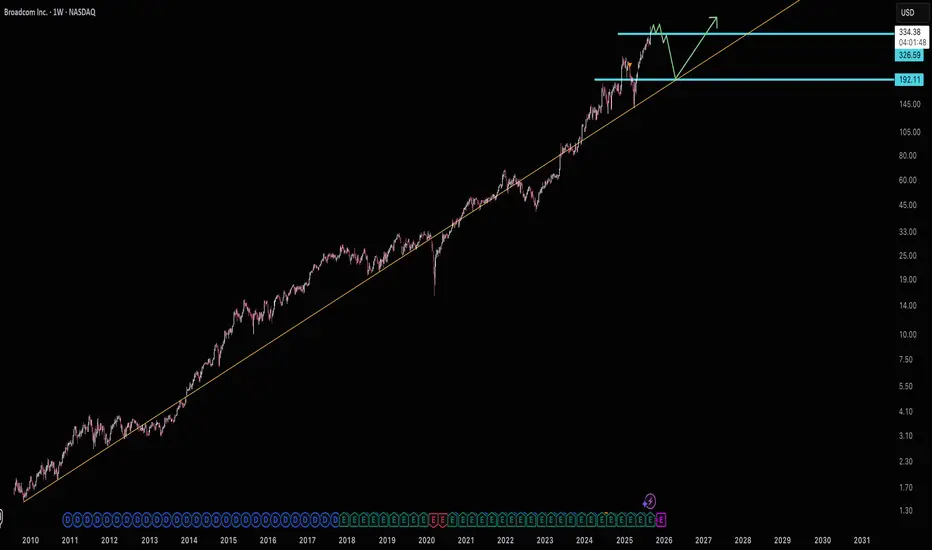
BROADCOM Rejection at the top of 3-year Channel Up possible. Last time we looked at Broadcom Inc. (AVGO) was more than 3 months ago (June 10, see chart below), where we gave a buy signal, targeting $320:
The price is now on the 2nd straight red week after it marginally breached above its 3-year Channel Up, and if it closes in red eventually, we will have a strong technical case for a rejection pull-back.
As you can see, every time the 1W RSI got that overbought and got rejected on its 4-year Resistance Zone, it always corrected back to its 1D MA100 (red trend-line).
Technically that should be the next medium-term buy entry point to finish the year with a $400 Target.
-------------------------------------------------------------------------------
** Please LIKE 👍, FOLLOW ✅, SHARE 🙌 and COMMENT ✍ if you enjoy this idea! Also share your ideas and charts in the comments section below! This is best way to keep it relevant, support us, keep the content here free and allow the idea to reach as many people as possible. **
-------------------------------------------------------------------------------
💸💸💸💸💸💸
👇 👇 👇 👇 👇 👇
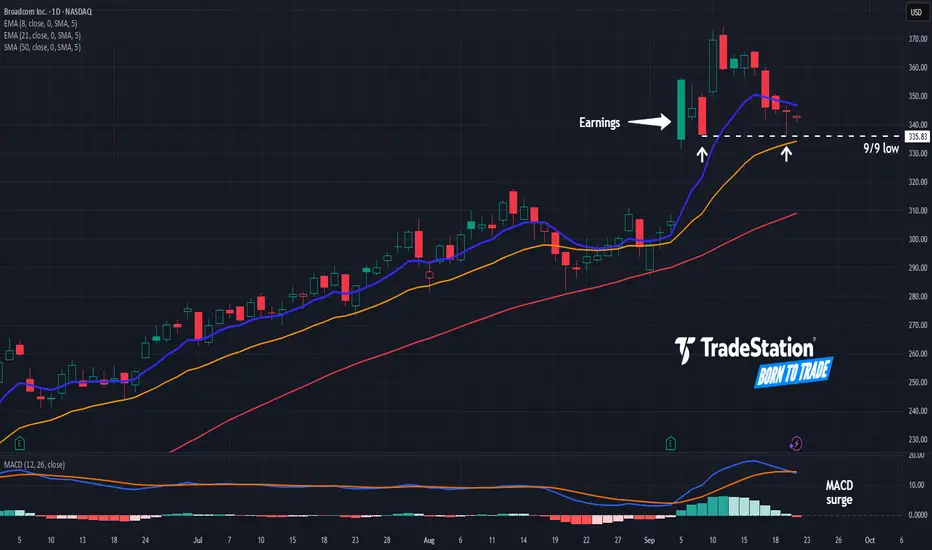
Broadcom Rallied. Now it’s Pulled Back.Broadcom surged to new record highs two weeks ago and now it’s pulled back.
The first pattern on today’s chart is the gap on September 5 after results beat estimates and management revealed a new large customer. That surge may reflect bullish sentiment in the chip stock.
Second, AVGO went on to make a weekly low of $335.83 two sessions later. Last Friday, it bounced slightly above that level. Is new support in place?
Third, the 8-day exponential moving average (EMA) is above the 21-day EMA. MACD has also surged. Those signals may reflect short-term bullishness.
Next, AVGO is an active underlier in the options market. That could help traders take positions with calls and puts.
TradeStation has, for decades, advanced the trading industry, providing access to stocks, options and futures. If you're born to trade, we could be for you. See our Overview for more.
Past performance, whether actual or indicated by historical tests of strategies, is no guarantee of future performance or success. There is a possibility that you may sustain a loss equal to or greater than your entire investment regardless of which asset class you trade (equities, options or futures); therefore, you should not invest or risk money that you cannot afford to lose. Online trading is not suitable for all investors. View the document titled Characteristics and Risks of Standardized Options at www.TradeStation.com . Before trading any asset class, customers must read the relevant risk disclosure statements on www.TradeStation.com . System access and trade placement and execution may be delayed or fail due to market volatility and volume, quote delays, system and software errors, Internet traffic, outages and other factors.
Securities and futures trading is offered to self-directed customers by TradeStation Securities, Inc., a broker-dealer registered with the Securities and Exchange Commission and a futures commission merchant licensed with the Commodity Futures Trading Commission). TradeStation Securities is a member of the Financial Industry Regulatory Authority, the National Futures Association, and a number of exchanges.
Options trading is not suitable for all investors. Your TradeStation Securities’ account application to trade options will be considered and approved or disapproved based on all relevant factors, including your trading experience. See www.TradeStation.com . Visit www.TradeStation.com for full details on the costs and fees associated with options.
Margin trading involves risks, and it is important that you fully understand those risks before trading on margin. The Margin Disclosure Statement outlines many of those risks, including that you can lose more funds than you deposit in your margin account; your brokerage firm can force the sale of securities in your account; your brokerage firm can sell your securities without contacting you; and you are not entitled to an extension of time on a margin call. Review the Margin Disclosure Statement at www.TradeStation.com .
TradeStation Securities, Inc. and TradeStation Technologies, Inc. are each wholly owned subsidiaries of TradeStation Group, Inc., both operating, and providing products and services, under the TradeStation brand and trademark. When applying for, or purchasing, accounts, subscriptions, products and services, it is important that you know which company you will be dealing with. Visit www.TradeStation.com for further important information explaining what this means.
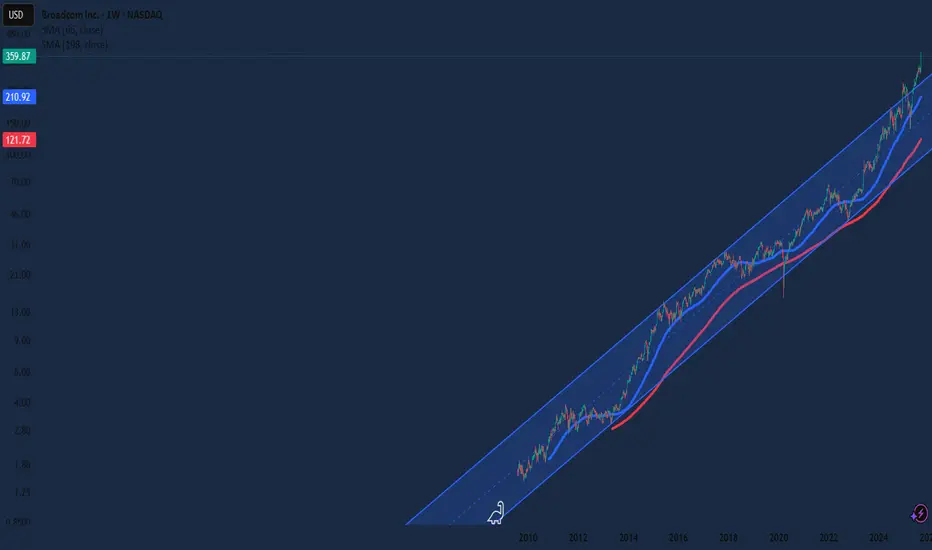
$AVGO – Strong Uptrend Intact, Backed by Robust Fundamental GrowSTRONG BULLISH | Ticker: AVGO (Broadcom Inc.) | Timeframe: Daily/Weekly
NASDAQ:AVGO is demonstrating a powerful and sustained uptrend, and the recent Q3 FY25 earnings report provides fundamental confirmation that this momentum is well-supported.
📈 Technical Perspective:
The stock is in a clear ascending channel, consistently making higher highs and higher lows.
It is trading decisively above key moving averages (e.g., 66-day and 198-day EMA), indicating strong bullish sentiment.
Each pullback has been bought aggressively, showing strong institutional support.
✅ Fundamental Catalyst (Q3 FY25 Earnings):
The latest earnings report acts as a powerful catalyst confirming the strength of this trend:
Explosive Revenue Growth: Posted revenue of $15.95B, a massive 22% YoY increase. This isn't just growth; it's accelerating growth.
Exceptional Profitability: Operating income surged 55% YoY to $5.89B, highlighting incredible operational leverage and margin expansion.
AI is the Driver: The Semiconductor Solutions segment ($9.17B) is fueled by insatiable demand for custom AI accelerators and networking chips. This is a long-term, structural growth story, not a short-term hype cycle.
Software Transformation: The Infrastructure Software segment ($6.79B) is successfully transitioning to a high-margin subscription model, creating a predictable and recurring revenue stream.
Shareholder-Friendly: The company returned $2.8B in dividends and is actively buying back stock ($2.45B this quarter), showcasing a strong commitment to capital return.
🎯 Conclusion:
The technical breakout is being validated by exceptional underlying fundamentals. The combination of leadership in AI semiconductors, a sticky software business, and superior capital allocation makes AVGO a premium asset. The trend is your friend, and the fundamental story confirms this friend has a very strong foundation.
$AVGO with a bullish outlook following its earnings #StocksThe PEAD projected a bullish outlook for NASDAQ:AVGO after a positive over reaction following its earnings release, with an expected accuracy of 84%.

Climax top on earningsNASDAQ:AVGO could have made a climax top in its final run on its earnings call.
Reasons:
1. Huge RSI divergence on daily
2. Huge reversal on highest volume
3. Its NASDAQ:SMH peers like NASDAQ:NVDA , NASDAQ:AMD continue to fall with more downside.
4. 1 Hour count on what I believe the final wave 5 has fading momentum
5. Weak choppy general market, divergence between QQQ and SPY

Broadcom at ResistanceBroadcom is at $326 resistance. It's accelerated well past it's historical trend line. This brings up concerns of over excitement.
While IXCO and SOX are still showing room for semiconductors to run as a broad group I would speculate AVGO is likely going to be left out as NVDA catches up. (NVDA hit it's current trend line this morning)
I'm expecting IXCO and SOX to hit resistance the end of this year. So until then I'm speculating AVGO is going to consolidate around current 326 resistance and eventually break down towards it's long term trend line.
I'm marking this Idea as "short" because I have a sideways/downward bias, but I personally am not actually shorting AVGO. When IXCO tops out there will be much better tech stocks to short.
Good luck!
AVGO: The Top Could Be Seen Since AprilUsing the fib retracement tool, I was able to determine the top of AVGO since July, but there have been clues dating back to April that $356 was the top. The fibonacci retracement is an excellent way to determine future supports and resistances and is used by top traders around the world.

1st target it just hit my 1st target profit and i have exited partially. I will wait until it hits my 2nd target.

AVGO watch $304-301: Major Resistance zone will TOP or Break?AVGO in a strong uptrend with all chip stocks.
It has hit a serious resistance $304.40-310.32
Look for a Dip-to-Fib or Break-n-Retest entry.

AVGO BOOOOOOM!AVGO announced its Earnings report yesterday and it showed a clear uptrend in post-market and pre-market.

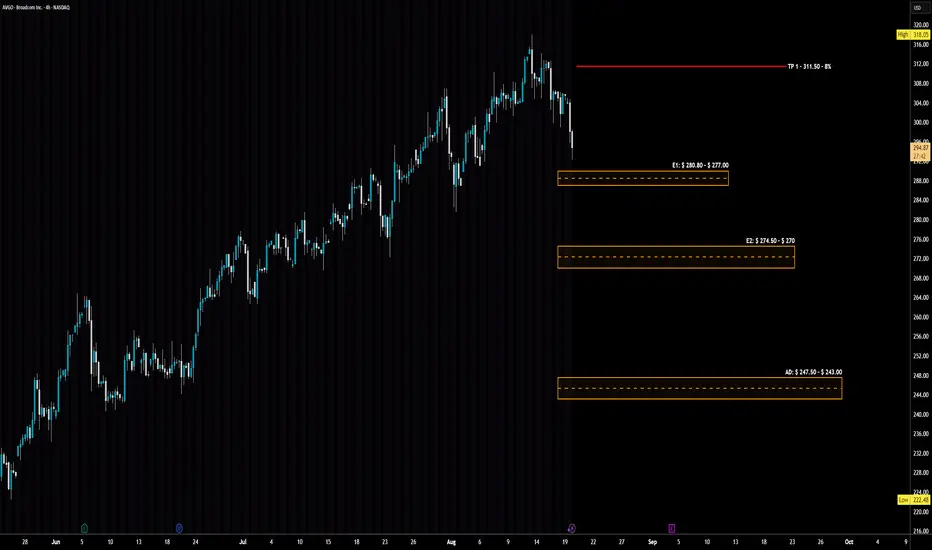
AVGO - LONG Swing Entry PlanNASDAQ:AVGO - LONG Swing Entry Plan
E1: $ 280.80 – $ 277.00
→ Open initial position targeting +8% from entry level.
E2: $ 274.50 – $ 270
→ If price dips further, average down with a second equal-sized entry.
→ New target becomes +8% from the average of Entry 1 and Entry 2.
AD: $ 247.50 – $ 243.00
→ If reached, enter with double the initial size to lower the overall cost basis.
→ Profit target remains +8% from the new average across all three entries.
Risk Management:
Stop Loss:
Risk is capped at 12% below the average entry price (calculated across all executed positions including the Edit Zone).
Position Sizing Approach:
Entry 1: 1x
Entry 2: 1x
AD Zone: 2x
→ Total exposure: 4x
→ Weighted average determines final TP and SL calculations.
______________________________________
Legal Disclaimer
The information provided in this content is intended for educational and informational purposes only and does not constitute financial, investment, or legal advice or recommendations of any kind. The provider of this content assumes no legal or financial responsibility for any investment decisions made based on this information. Users are strongly advised to conduct their own due diligence and consult with licensed financial advisors before making any financial or investment decisions.
Sharia Compliance Disclaimer: The provider makes no guarantees that the stocks or financial instruments mentioned herein comply with Islamic (Sharia) principles. It is the user’s responsibility to verify Sharia compliance, and consultation with a qualified Sharia advisor is strongly recommended before making any investment decisions
Stock Opportunity: LULULEMON & AVGO EARNINGSNASDAQ:LULU just reported earnings of $2.53B vs $2.54B est
They did beat on the EPS side $3.10 vs $2.85
Lululemon is now the second cheapest its ever been in its history on a PE basis. Behind the GFC crisis in 2008.
They have slashed their guidance and profit forecasts...which seem to be the final shakeout.
Lulu filled a massive weekly technical gap going back to Covid.
NASDAQ:AVGO reported earnings: Rev $15.95B vs $15.83B
EPS $1.69 vs $1.54
This institutional semiconductor stock is crushing Vol and staying flat-ish in afterhours.
We took a position in Lulu.

AVGO Earnings Lotto: $332.5C Could 3x Overnight!
🚀 **AVGO Earnings Trade Setup (2025-09-04)** 🚀
**Market Bias:** **Moderate–Strong Bullish** 💪
**Confidence:** 76% ✅
**Trade Idea:**
🎯 **Instrument:** AVGO
🔀 **Direction:** LONG CALL
💵 **Strike:** \$332.50
📅 **Expiry:** 2025-09-05 (Weekly)
💰 **Entry Price:** \$1.28
📈 **Profit Target:** \$3.84 (200% return)
🛑 **Stop Loss:** \$0.64 (50% of premium)
📏 **Size:** 1 contract
⏰ **Entry Timing:** Pre-earnings close (AMC on 2025-09-04)
**Rationale:**
* AI tailwinds & beat-and-raise history ⚡
* Strong call-side OI concentration at \$332.5–\$335 📊
* Favorable macro/tech rotation 🌐
* Risk: VMware guide-down or post-earnings IV crush ⚠️
**Key Levels:**
* Support: \$290–\$300 (put OI cluster) 🛡️
* Resistance: \$330–\$335 (call OI cluster) 🔝
**Risk/Reward:**
* Max loss: \$128
* Reward potential: \$256 → **\~4:1 R/R ratio** 🎯
* Breakeven at expiry: \$333.78
**Execution Notes:**
* Use **limit orders or algo** to reduce slippage
* Exit **by market open post-earnings** or at profit/stop targets
* IV crush expected: 30–50% ⚡
**Expected Move:** \~4.8% (implied by options)
**IV Rank:** 0.65
**Signal Published:** 2025-09-04 13:47 EDT
📊 **Trading JSON (for exact execution)**
```json
{
"instrument": "AVGO",
"direction": "call",
"strike": 332.5,
"expiry": "2025-09-05",
"confidence": 76,
"profit_target": 3.84,
"stop_loss": 0.64,
"size": 1,
"entry_price": 1.28,
"entry_timing": "pre_earnings_close",
"earnings_date": "2025-09-04",
"earnings_time": "AMC",
"expected_move": 4.8,
"iv_rank": 0.65,
"signal_publish_time": "2025-09-04 13:44:50 UTC-04:00"
}
``

$AVGO Bullish new upcoming earningsI dont know if any of you know, I only just found out about this stock this week

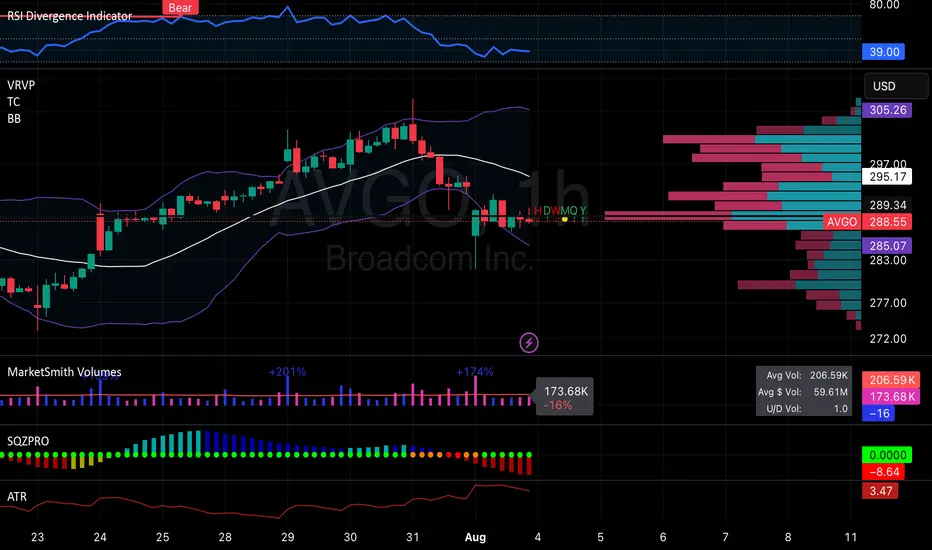
AVGO Setting in a BaseLooks like AVGO is setting up a stage 1 and has a gap to the upside to fill. The RSI is oversold at 39. If we break above $290.28 we can expect to make moves back through the higher price targets. The Stop Loss is between the Bollenger Bands. in purple.
$AVGO: Broadcom – AI Chip Powerhouse or Tariff Tightrope?(1/9)
Good morning, crew! ☀️ NASDAQ:AVGO : Broadcom – AI Chip Powerhouse or Tariff Tightrope?
With NASDAQ:AVGO at $194.94 after a Q1 earnings slam dunk, is this semiconductor star riding the AI wave to glory or teetering on trade war woes? Let’s unpack the circuits! 🔍
(2/9) – PRICE PERFORMANCE 📊
• Current Price: $ 194.94 as of Mar 10, 2025 💰
• Q1 2025: Revenue $14.92B (up 23% YoY), EPS $1.60 📏
• Movement: Up 10% post-earnings Mar 6, +8.6% Mar 7 🌟
It’s buzzing like a chip factory on overdrive! ⚡
(3/9) – MARKET POSITION 📈
• Market Cap: ~$93.5B (151.62M shares) 🏆
• Operations: AI chips, software solutions ⏰
• Trend: 42% of 2024 revenue from software, per web data 🎯
A heavyweight in the AI silicon ring! 🌐
(4/9) – KEY DEVELOPMENTS 🔑
• Earnings: Q1 beat with $14.92B, Q2 forecast tops estimates 🔄
• AI Boom: Custom chips fuel hyperscaler demand 🌍
• Sentiment: Shares rallied, per Mar 6-7 posts 📋
Thriving, wired for the future! 💡
(5/9) – RISKS IN FOCUS ⚠️
• Tariffs: Trade uncertainties loom, per web reports 🔍
• Competition: Nvidia, Marvell in the race 📉
• Valuation: Premium pricing raises eyebrows ❄️
High stakes, but risks are on the radar! 🕵️
(6/9) – SWOT: STRENGTHS 💪
• Q1 Win: $14.92B revenue, EPS $1.60 beat 🥇
• AI Edge: 77% AI revenue growth in Q1 📊
• Forecast: Q2 sales outlook shines 🔧
Powered up for the AI era! 🔋
(7/9) – SWOT: WEAKNESSES & OPPORTUNITIES ⚖️
• Weaknesses: Tariff risks, high valuation 📉
• Opportunities: 18% earnings growth projected 📈
Can it outrun trade clouds and soar? 🤔
(8/9) – 📢Broadcom at $194.94, AI chips sizzling—your vibe? 🗳️
• Bullish: $220+ by June, AI rules 🐂
• Neutral: Stable, tariffs balance ⚖️
• Bearish: $170 slide, risks bite 🐻
Drop your pick below! 👇
(9/9) – FINAL TAKEAWAY 🎯
Broadcom’s $14.92B Q1 haul screams AI strength 📈, but tariff shadows hover 🌫️. Volatility’s our sidekick—dips are DCA dynamite 💰. Snap ‘em up, ride the surge! Goldmine or gamble?

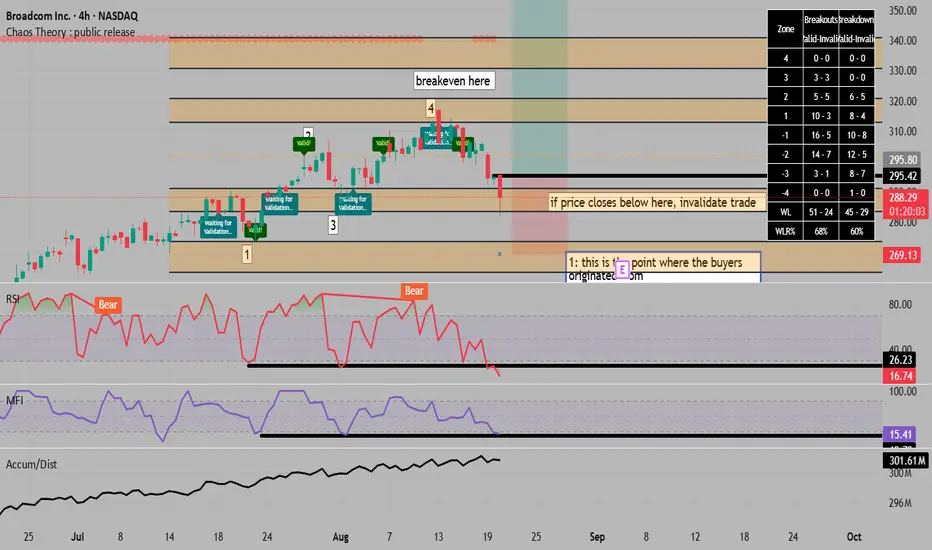
A return to major structure and test of support hints at a =BUY1: this is the point where the buyers originated from
3: we establish a support at the supply area of #1,
that we have some sell orders here
4: at this point number 1 turns into a solid major low,
it is a major low as it is part of the major structure,
and a key part of it, number 3 surpassing number 2 makes
it a solid minor low, as it is part of the minor structure ,
and the buyers surpassed the sellers from 2
what do I think will happen?
* if it happens like I think, it will look obvious, or I will
look like I have no idea what i'm talking about, but here we go..
* if prices comes back into the zone above we know via stats,
the last 2,500 bars, if price closes in a zone it has a 68% chance
of reaching the next zone up
* so we can set a stop order there and use the fact that we are
both at a re-test, the original test which occured at 3, and we are at
a solid major low, the stop loss below this would be the logical move
* the expected move up would be to surpass number 4
* if price closes into the zone below, the trade is invalidated as its most
likely path is the genesis of 1 , which is our stop loss.
* as far as divergences go, we have hidden bear divergence for more rsi and mfi
* we are also oversold on both
* we also benefit from the fact that the low 1 and 3 are bottoms on mfi and RSI , and if we use a support horizontal line, it pinpoints this being another low.
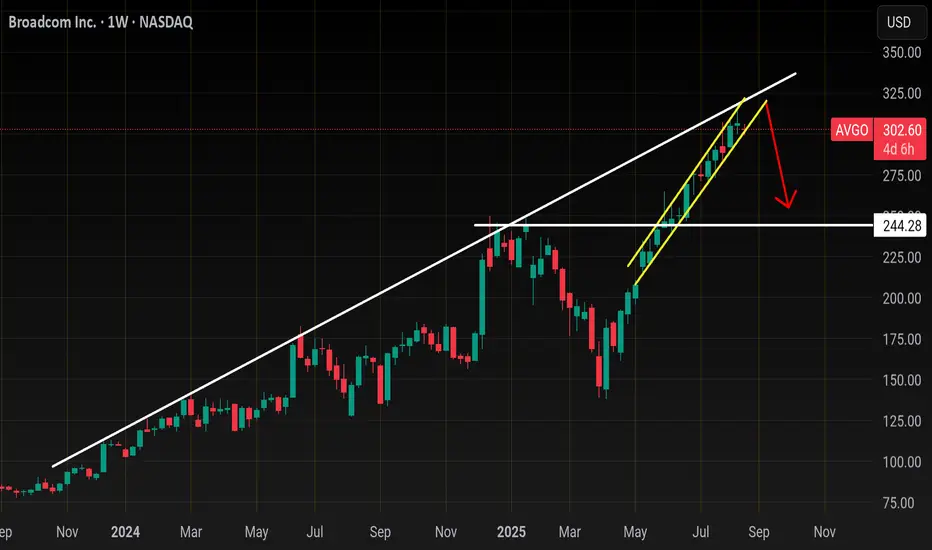
AVGO... the next to goVery toppy here. I think this stock will correct 20-30% in the next 2 months here ...
Here me out
Stock has reach trendline resistance
3 straight months outside its monthly Bollingerband
Weekly money flow is at 100
And lastly but most importantly is the Negative divergence on the RSI
Put all of this together going into a weak Seasonality and it's a recipe for a deep correction
This is Avgos price support, only breached it on Tariff sell off which I highlighted with the circle.
I think we head back there long term
But keep in mind of the support at 250.
So my correction is 230-250 by mid or end of october..
Zoom in of the daily with trendline resistance and 20ma and you can see how price has rode the 20ma all summer.. So your short entry would be a close below the 20sma or wait for one more bounce between 310-320 to enter short
AVGO SELLIt is look like the market is try to take some liquidity at downside and then it will go up and then it come down for respect zone ,so if market come to my selling zone i gonna sell
