Bank of America Flirts with HistoryBank of America has plodded higher for months, and now it’s flirting with history.
The first pattern on today’s chart is the $55.08 level. It was the previous all-time high from 2006, before the global financial crisis. BAC suffered a 95 percent drawdown from that peak and has now returned to the same historic line. That could keep traders on guard for a potential breakout.
Second, the megabank has made a series of higher lows while staying above its rising 50-day simple moving average. Is an intermediate-term uptrend in effect?
Next, MACD is rising and the 8-day exponential moving average (EMA) is above the 21-day EMA. Those patterns may reflect short-term bullishness.
Finally, BAC is an active underlier in the options market. That could help traders take positions with calls and puts.
TradeStation has, for decades, advanced the trading industry, providing access to stocks, options and futures. If you're born to trade, we could be for you. See our Overview for more.
Past performance, whether actual or indicated by historical tests of strategies, is no guarantee of future performance or success. There is a possibility that you may sustain a loss equal to or greater than your entire investment regardless of which asset class you trade (equities, options or futures); therefore, you should not invest or risk money that you cannot afford to lose. Online trading is not suitable for all investors. View the document titled Characteristics and Risks of Standardized Options at www.TradeStation.com . Before trading any asset class, customers must read the relevant risk disclosure statements on www.TradeStation.com . System access and trade placement and execution may be delayed or fail due to market volatility and volume, quote delays, system and software errors, Internet traffic, outages and other factors.
Securities and futures trading is offered to self-directed customers by TradeStation Securities, Inc., a broker-dealer registered with the Securities and Exchange Commission and a futures commission merchant licensed with the Commodity Futures Trading Commission). TradeStation Securities is a member of the Financial Industry Regulatory Authority, the National Futures Association, and a number of exchanges.
Options trading is not suitable for all investors. Your TradeStation Securities’ account application to trade options will be considered and approved or disapproved based on all relevant factors, including your trading experience. See www.TradeStation.com . Visit www.TradeStation.com for full details on the costs and fees associated with options.
Margin trading involves risks, and it is important that you fully understand those risks before trading on margin. The Margin Disclosure Statement outlines many of those risks, including that you can lose more funds than you deposit in your margin account; your brokerage firm can force the sale of securities in your account; your brokerage firm can sell your securities without contacting you; and you are not entitled to an extension of time on a margin call. Review the Margin Disclosure Statement at www.TradeStation.com .
TradeStation Securities, Inc. and TradeStation Technologies, Inc. are each wholly owned subsidiaries of TradeStation Group, Inc., both operating, and providing products and services, under the TradeStation brand and trademark. When applying for, or purchasing, accounts, subscriptions, products and services, it is important that you know which company you will be dealing with. Visit www.TradeStation.com for further important information explaining what this means.
Bank of America Corp Shs Cert Deposito Arg Repr 0.25 Shs
No trades
Trade ideas

Bank of America ($BAC): Commodities Lead 2026 ‘Run-It-Hot’ TradeBank of America (NYSE: NYSE:BAC ) Stock: Commodities Lead 2026 ‘Run-It-Hot’ Trade
Bank of America (NYSE: NYSE:BAC ) has doubled down on its “run-it-hot” thesis for 2026, calling commodities the top trade of the year as the global economy enters a high-growth, high-stimulus phase. The bank’s strategists, led by Michael Hartnett, argue that commodities are set to outperform due to strong fiscal expansion, potential inflationary pressure, and policy shifts under the Trump administration. Energy, industrial metals, and broad-based commodity indices have already delivered impressive gains this year as investors position around the AI-driven data-center boom.
The Vanguard Commodity Strategy Fund is up 17% YTD, beating the S&P 500, while commodities-heavy sectors such as Industrials (+17%), Utilities (+15%), and Energy (+7%) continue to attract flows. According to BofA, these returns can extend into 2026 thanks to four core drivers: higher inflation expectations, fiscal stimulus, the weakening appeal of bonds, and structural de-globalization. Tariffs, geopolitical fragmentation, and supply-chain recalibration are boosting demand for raw materials, while gold’s historic rally—up 60% this year—shows investors are pricing a long runway for commodity strength.
BofA also highlights that oil could be the top contrarian trade of 2026, especially if geopolitical tensions moderate. Combined with infrastructure investment and AI-related energy demand, the commodity complex may continue to lead risk assets.
TECHNICALS
Bank of America’s stock shows a strong bullish structure on the 3D chart. BAC broke above the previous $48–$50 supply zone and is now trending firmly above its 9-SMA. Price is consolidating near $54–$55, building a base just below its recent high.
RSI remains bullish at ~64, indicating healthy momentum without extreme overbought conditions. The MACD line is hovering near a bullish continuation signal, suggesting the uptrend has room to extend. If BAC holds above $52.50, the next upside target is $58, followed by $60–$62. A breakdown below $50 would be the first sign of weakening momentum, but current structure favors continued upside in line with the commodities-driven macro outlook.

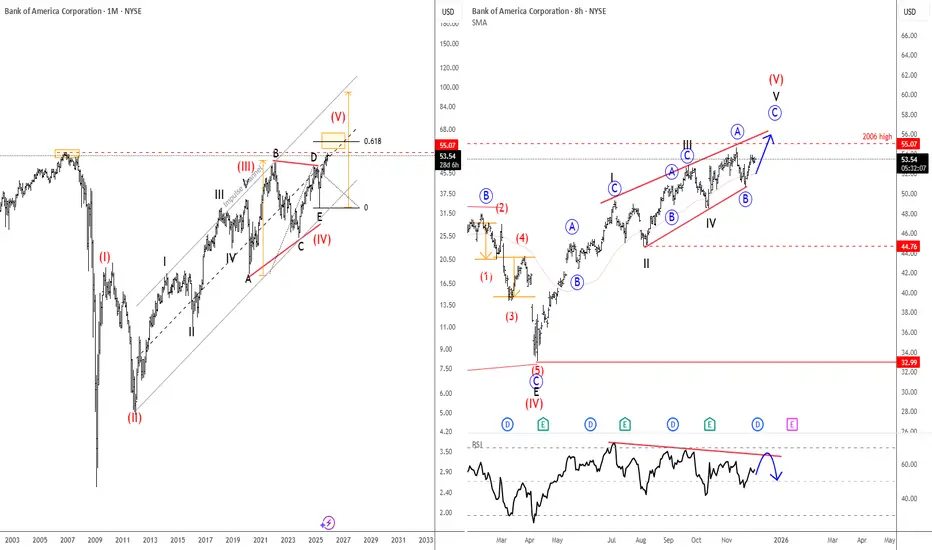
Bank Of America Is Eyeing All-Time Highs From 2006Bank of America is one of the largest banks in the world, serving millions of consumers, businesses, and institutions. It has a broad mix of operations — consumer banking, wealth management, corporate banking, and global markets — which helps keep its earnings stable. The bank has been heavily investing in digital services and technology, aiming to improve efficiency and customer experience. Its size and global reach make it a key player in the U.S. and global financial system.
Bank of America is in an uptrend with a very strong rebound since April 2025, and the price is now approaching the 2006 highs. That area around 55 is extremely important because the current structure looks like an ending diagonal in wave five, meaning we could be in the late stages of a higher-degree bullish cycle. The push up this year also comes out of a very big triangle on the monthly chart, so despite the positive momentum, we should be aware that resistance is getting closer and bullish momentum may slow down. We also see RSI divergence on the daily chart, which is very common when diagonals mature. So while the trend is still up for now, it makes sense to be careful around 55, as a potential reversal in 2026 would not be a surprise.
Highlights:
Trend: Bullish but late-stage (ending diagonal risk)
Resistance: 55-56 area (2006 high)
Invalidation of a bull trend: broken trendline support
Note: Watch RSI divergence and respect the 55/56 zone as potential exhaustion of wave five
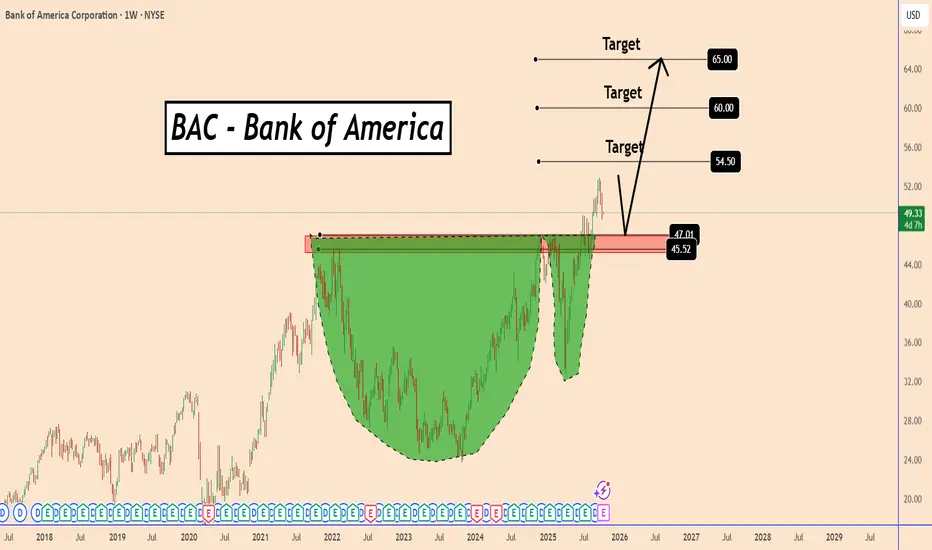
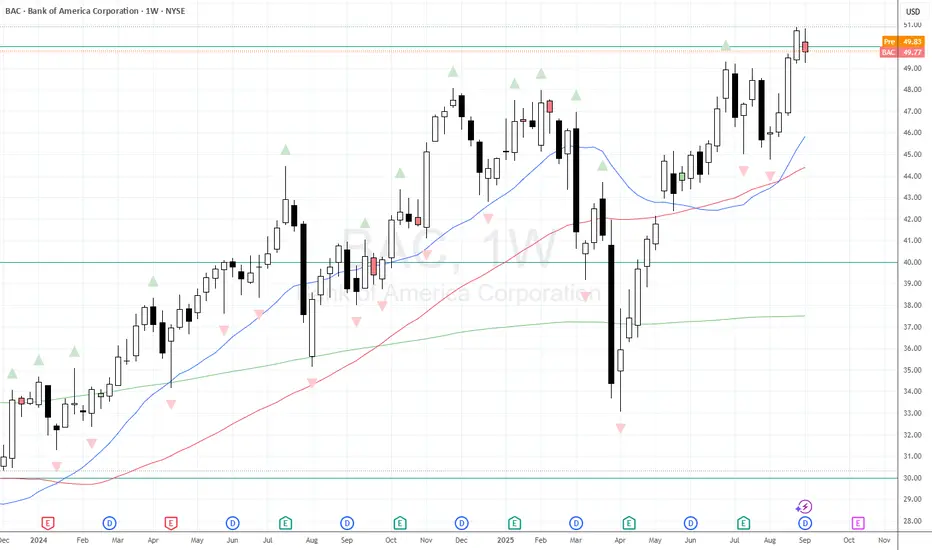
BAC Completed a Cup and Handle Model - Get Ready for a BounceBAC Completed a Cup and Handle Model - Get Ready for a Bounce
The cup and handle pattern is a bullish continuation pattern.
The BAC weekly chart displays a large, rounded bottom that formed over several years, indicating long-term accumulation.
After breaking above the key resistance around $45.50–$47.00, the price pulled back to retest this zone, which is now acting as strong support.
BAC broke out in a solid way the top created on December 2021 thus indicating for signs of a stronger bullish momentum.
As long as the BAC price stays above this area, the trend remains bullish, with potential upside targets near $54.50, $60, and $65.
Support zone: $45.50 – $47.00
Targets:
$54.50
$60.00
$65.00
You may find more details in the chart!
Thank you and Good Luck!
❤️PS: Please support with a like or comment if you find this analysis useful for your trading day❤️
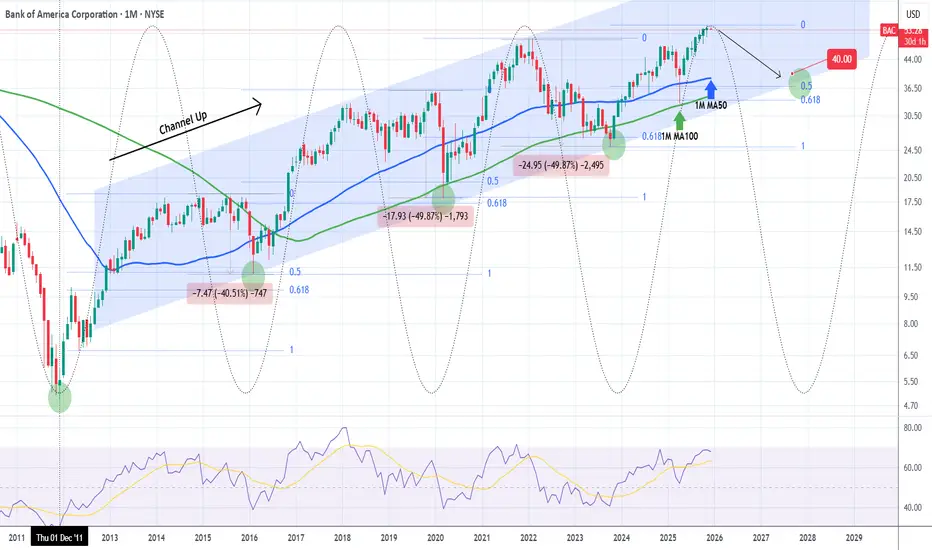
BANK OF AMERICA Cyclical correction to $40 starting.Bank of America (BAC) has been trading within a Channel Up for the past 13 years. The Sine Waves have had a fair success at pricing both Cyclical Tops (Bull Cycles) and bottoms (Bear Cycles).
Based on that, Bank of American is entering into peak territory. Whether that lasts for longer (like 2014 - 2016 an 2018 - 2020) or shorter (2022), the common parameter has been the 1M MA100 (green trend-line), marginally below which the last two corrections took place.
At the same time, every such Bear Cycle since 2012 has always hit its 0.5 Fibonacci retracement level, making a direct Higher Low at the bottom of the long-term Channel Up. Right now the 0.5 Fib sits exactly at the bottom of the pattern, so we expect at least $40 to get hit before the stock becomes a long-term buy opportunity again.
Notice also how the 1M RSI is reversing just before it turned overbought (70.00).
---
** Please LIKE 👍, FOLLOW ✅, SHARE 🙌 and COMMENT ✍ if you enjoy this idea! Also share your ideas and charts in the comments section below! This is best way to keep it relevant, support us, keep the content here free and allow the idea to reach as many people as possible. **
---
💸💸💸💸💸💸
👇 👇 👇 👇 👇 👇
BAC bearish structurebearish div on every time frame inside of a rising wedge with a double top on the 4hr. looks very bearish with great R:R

BAC Weekly Alert — Katy AI Signals Potential Pullback📊 BAC QuantSignals V3 Weekly — Trading Information (2025-12-01)
🔹 Weekly Direction (LLM): BUY CALLS
Confidence: 58%
Risk: HIGH (low conviction + uncertainty)
🔹 Katy AI Direction: BUY PUTS
Predicted Move: -1.59%
Katy Confidence: 50%
⚠️ Directional Conflict: MEDIUM Severity
📈 Trade Levels
Expiry: 2025-12-05 (4 days)
Recommended Strike: $53.50P
Entry: $0.48
Target 1: $0.72
Stop Loss: $0.29
🧠 Analysis Snapshot
Katy AI (Bearish)
Target: $52.88 (-1.3% from $53.56)
Full series shows steady decline toward $51.29 (-4.25%), then mild rebound but still below current price.
Technical Levels
Resistance: $53.94
Support: $51.40
VWAP: $52.66 (below price → downside pressure)
Week Range: 65% (room to fall)
News Sentiment
No major BAC-specific catalysts
Overall neutral environment
Options Flow
No unusual activity
Flow bias: Neutral
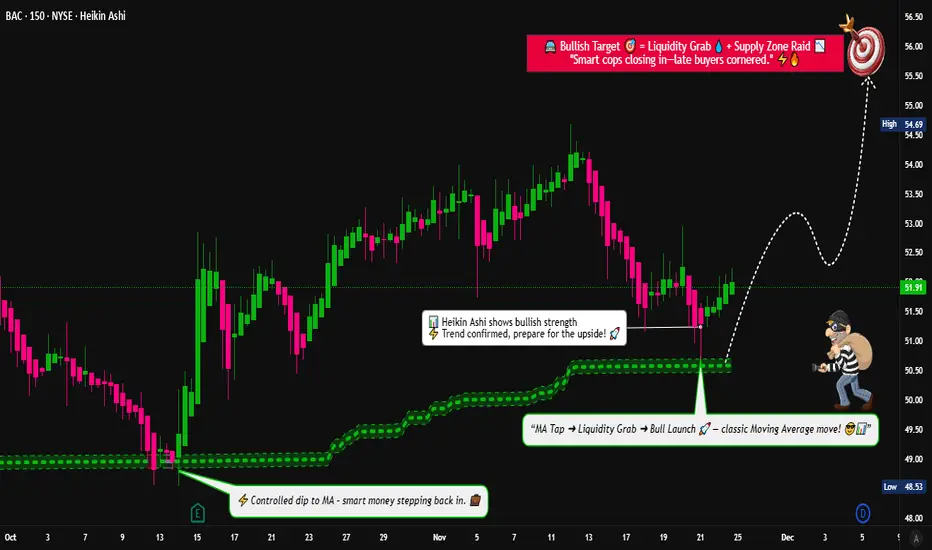
BAC Pullback Into MA — Is This the Next Swing Continuation Move?🔥📈 BAC — Bullish Pullback Playbook Into MA | Thief-Style Layer Entry 📊💼
Hey Traders! 😎
Here’s my Bullish Pullback Into Moving Average playbook on BAC — Bank of America Corp (NYSE).
Clean setup, thief-friendly layering, and a classy escape plan 😅🕶️💸
📘 Asset
BAC — Bank of America Corporation (NYSE)
Swing-trade style breakdown with a professional twist and a few laughs for the OG Thief Family 😄💼
🎯 Plan: Bullish Pullback Into the Moving Average
Price is dipping beautifully back toward key Moving Averages — classic bullish continuation behavior.
I’m monitoring for strength after the pullback along the MA zone. ✔️
🟦 Entry Plan (Thief Layering Strategy)
Thief strategy = multiple limit orders placed at different value zones.
This helps average in during the pullback without chasing. 👇💰
🔥 Layered Buy Limit Zones:
50.50
51.00
51.50
52.00
(Feel free to extend the layers if your own plan requires it.)
This is NOT a buy signal — only an example of a layering method for educational purposes.
🛑 Stop Loss (Thief Style)
Thief SL zone: 49.00
This is merely an illustrative SL point in my personal playbook style.
Note: Dear Ladies & Gentlemen (Thief OG’s), I am not recommending that you use my SL.
You make your own decisions and manage risk according to your plan.
🎯 Target Zone
We have strong resistance overhead + extended levels + potential liquidity traps.
So the smart thief knows when to take the bag and vanish 🏃💨💰
My take-profit zone: 56.00
Note: Dear Ladies & Gentlemen (Thief OG’s), I am not recommending that you use my TP.
You make your own choices — take money when you want, at your own risk.
🧠 Market Notes & Why the Setup Works
Price respecting MA structure
Clear bullish momentum on higher timeframes
Liquidity resting above recent swing levels
Healthy pullback with momentum probability toward continuation
Good behavior around institutional zones
🔗 Related Pairs to Watch (Correlation Insight)
BAC has measurable correlation with U.S. financial-sector instruments. Watching them helps confirm sentiment 🧩📊
AMEX:XLF — Financial Select Sector ETF
When XLF is strong, BAC often follows the broader sentiment.
NYSE:JPM — JPMorgan Chase
Sector correlation; bullish flow here can support BAC continuation.
$C — Citigroup
Similar pullback and continuation behavior; keep an eye on banking flow.
AMEX:SPY — S&P 500
Strong indices = supportive environment for major banks.
📘 Quick Correlation Summary
Banking stocks move together due to macro factors like rates, liquidity, and earnings expectations.
Strong AMEX:XLF + bullish AMEX:SPY generally improves probability for bullish pullbacks in BAC.
If all “sister pairs” show weakness, expect slower continuation.
✨ “If you find value in my analysis, a 👍 and 🚀 boost is much appreciated — it helps me share more setups with the community!”
⚠️ Disclaimer
This is a thief-style trading strategy created for educational and fun purposes only.
Not financial advice, not signals, and not a recommendation to buy or sell any asset.
BAC 2008 Flashback CrashAs we enter into what looks like a nasty 2026 recession, Bank Of America does a 19 Year Double Top.
Banks are struggling with liquidity, tapping into the Repo Market with record volume, giving 2008Flashback Crash Signals.
THERE IS NO LIQUIDITY in the Reverse Repo. Offices are empty across the globe as we work from home, but who's holding the bill?
Banks.
See ya.

Bank of America Wave Analysis – 17 November 2025
- Bank of America broke support zone
- Likely to fall to support level 50.00
Bank of America recently broke the support zone between the key support level 52.00 (which stopped earlier wave (b)) and the support trendline of the daily up channel from October.
The breakout of the support level 52.00 accelerated the active impulse wave c from the resistance level 54.00.
Bank of America can be expected to fall to the next round support level 50.00 (which stopped the previous minor correction ii in November).
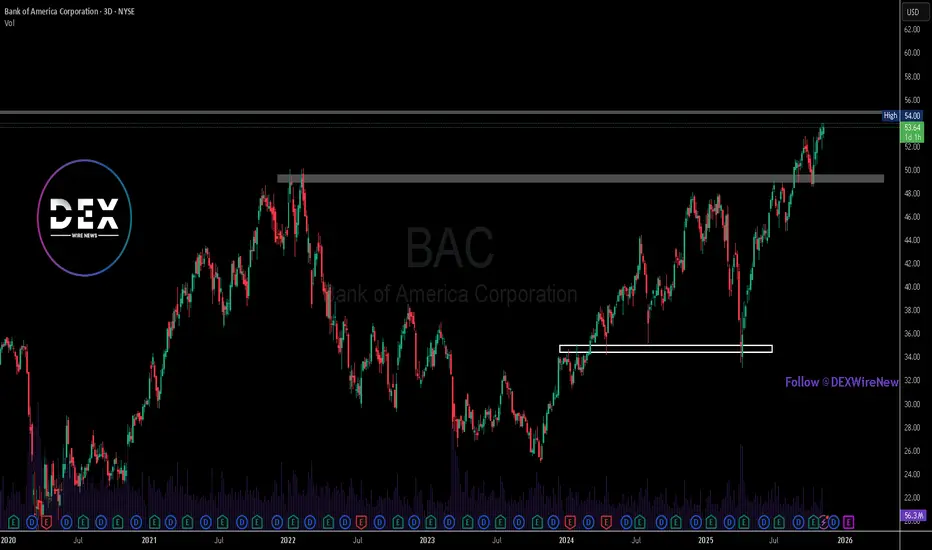
Bank of America Retests Multi-Year Highs as Momentum Builds Bank of America’s stock has officially revisited a key multi-year high zone, a level the market last interacted with meaningfully back in 2021. The current structure, as shown in the chart, reflects a very clean technical narrative: a major base, a breakout, and a return to the upper supply zone that has historically triggered profit-taking.
From mid-2023 through early 2024, BAC went through a long accumulation/structural repair cycle. Buyers defended demand aggressively between the $32–$35 region, which acted like a clear multi-touch floor. That zone eventually formed the bottom that launched the entire current rally leg. Once that base held, structural higher-lows began to form and the stock convincingly reclaimed the $48–$50 area, which used to be a stubborn supply wall in previous cycles. That former resistance has now flipped into support.
What stands out today is that BAC is now testing the $54 region, the area representing a major swing high and the top of the structure. This is where price historically reacted sharply, so it is a true macro decision zone. If bulls can hold above this region and convert it into a support shelf, the next phase could trigger a fresh price discovery sequence, with the potential to unlock a new upper range beyond the 2021 highs.
Volume behaviour remains steady, not euphoric, suggesting this move is being driven more by real accumulation rather than speculative blow-off flows.
Heading into the next quarter, macro yields, bank earnings expectations, and broad market risk appetite will dictate whether BAC sustains this breakout. But purely technically, the stock is exactly where major trend continuations historically begin, or trend reversals historically show themselves.
$BAC with a bearish outlook following its earnings #StocksThe PEAD projected a bearish outlook for NYSE:BAC after a positive over reaction following its earnings release placing the stock in drift B with an expected accuracy of 42.86%.

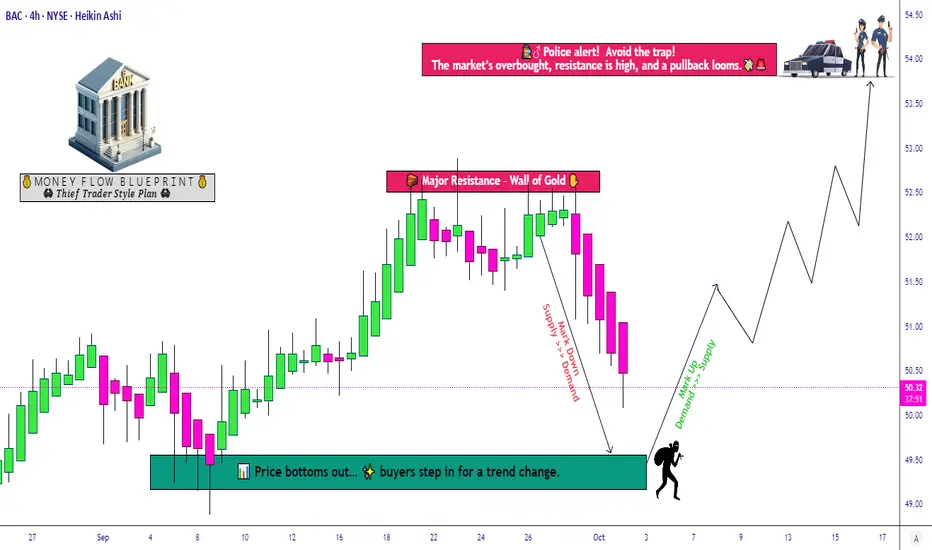
BAC Swing Trading Strategy – Bearish Dip Turning Bullish Soon!🔥 BAC “Bank of America” – Thief Wealth Strategy Map (Swing/Day Trade) 💼📉➡️📈
📊 Plan: Bearish to Bullish Reversal Setup
Entry: You can enter at any price level (flexible strategy 🕶️).
Stop Loss (SL): Thief-style SL @ 48.50 🛑💔
⚠️ Dear Ladies & Gentlemen (Thief OG’s), I’m not recommending to use only my SL. It’s your choice. Manage your risk like a boss and protect your bag.
Target (TP): Strong resistance + overbought trap zone 🚧 — escape with profits @ 54.00 🎯💸
⚠️ Dear Ladies & Gentlemen (Thief OG’s), I’m not recommending to use only my TP. Take money when you see money — at your own risk.
🧩 Key Thief Notes:
Market psychology points to a bearish shakeout ➡ bullish trap escape move.
BAC is currently in a range between demand & supply zones — liquidity hunting zone 🎯.
Overbought conditions may trigger profit-taking → watch carefully for reversal signals.
🔗 Related Assets to Watch (Correlation Play):
NYSE:JPM (JPMorgan Chase) – strong sector leader, moves often lead BAC.
$C (Citigroup) – tracks similar banking flows.
AMEX:XLF (Financial Select Sector ETF) – index-level financial exposure.
AMEX:SPY (S&P 500 ETF) – overall risk sentiment affects banking stocks heavily.
TVC:DXY (US Dollar Index) – stronger USD can weigh on financial stocks.
TVC:TNX (US 10Y Yield) – bond yields = big driver for bank profitability.
📌 Tip: Watch AMEX:XLF & TVC:TNX closely. Rising yields = positive for banks, while falling yields can slow momentum.
✨ “If you find value in my analysis, a 👍 and 🚀 boost is much appreciated — it helps me share more setups with the community!”
⚠️ Disclaimer: This is a Thief-style trading strategy, shared just for fun & educational vibes. Not financial advice. Trade at your own risk.
#BAC #BankofAmerica #StockMarket #SwingTrade #DayTrade #XLF #JPM #C #SPY #FinancialSector #ThiefTrader #Stocks
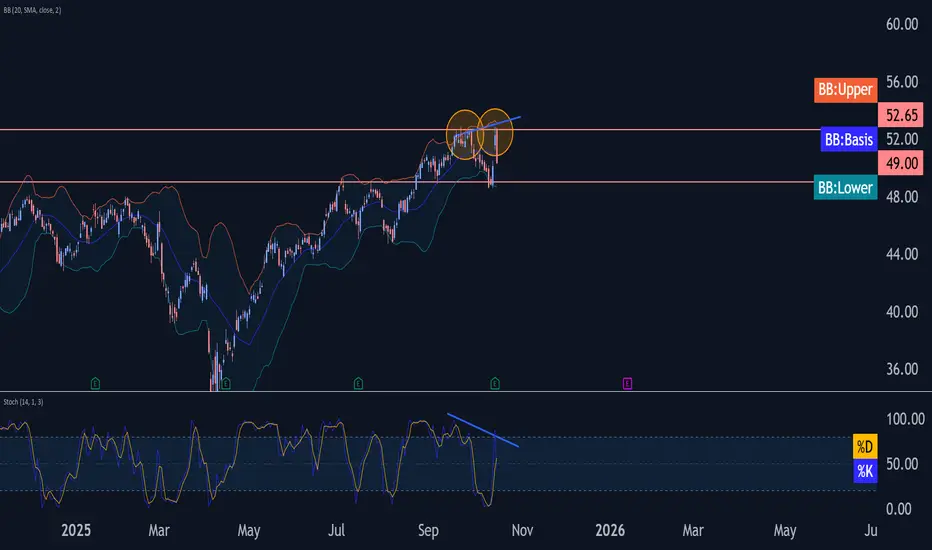
Bank of America Wave Analysis – 16 October 2025
- Bank of America reversed from resistance zone
- Likely to fall to support level 49.00
Bank of America recently reversed from the resistance area between the key resistance level 52.65 (which stopped the sharp uptrend in September) and the upper daily Bollinger Band.
The downward reversal from resistance zone created the daily Japanese candlesticks reversal pattern Bearish Engulfing.
Given the strength of the resistance level 52.65 and the bearish divergence on the daily Stochastic, Bank of America can be expected to fall to the next strong support level 49.00 (former double top from July).
Weekly Spinning Top @ $50 for BACAfter a push to new highs we printed a bearish Spinning Top at the $50 level last week. A pause in momentum - or the end of the run? (I think probably the former.)
BAC Technical Outlook – Rising Wedge Nearing Apex📈 BAC Technical Outlook – Rising Wedge Nearing Apex
Ticker: BAC (Bank of America)
Timeframe: 30-minute candles
🔍 Current Setup
BAC is trading inside a rising wedge pattern, defined by converging upward-sloping support and resistance lines. Rising wedges are typically bearish reversal patterns, especially when formed after a strong rally — but they can also resolve higher if buyers overwhelm supply.
Currently, BAC is pressing against upper wedge resistance (~48.40–48.60), while support lies near 47.70.
📊 Breakout Levels
🚀 Upside (Bullish Scenario)
Trigger: Break and close above 48.60 with strong volume.
Intermediate Targets:
49.00 → Top of wedge projection.
49.50–50.00 → Round number psychological level.
Measured Move Target: ~50.50 (based on wedge height of ~2 points).
🔻 Downside (Bearish Scenario)
Trigger: Break below 47.70 (lower wedge support).
Intermediate Supports:
47.20–47.00 → Recent pivot low.
46.50 → Next demand zone.
Measured Move Target: ~45.50 (equal to wedge height projection).
📈 Volume Analysis
The surge in volume on recent candles suggests institutional participation.
If volume confirms on a downside break, the wedge could play out in textbook fashion with sellers pushing BAC back toward 46–45.50.
Conversely, a breakout above 48.60 with sustained volume could invalidate the bearish wedge bias and extend the rally.
⚖️ Probability Bias
Rising wedges generally favor bearish outcomes, but BAC’s strong trend and recent volume spikes suggest bulls remain active.
The key decision zone is 48.60 on the upside vs 47.70 on the downside.
Whichever side breaks first will likely see momentum acceleration.
✅ Takeaway
BAC is at a critical inflection point inside a rising wedge:
Bullish Break > 48.60: Targets 49 → 50 → 50.50
Bearish Break < 47.70: Targets 47 → 46.50 → 45.50
Traders should watch volume closely — it will confirm the wedge’s true direction.

Bank of America Sees Volatility Risk at Jackson HoleBy Ion Jauregui – Analyst at ActivTrades
Bank of America warns that Jackson Hole could bring turbulence, as the Fed may inject up to $2 trillion in liquidity. From August 21 to 23, market attention will be focused on Jackson Hole, where Jerome Powell may provide clues about the future of U.S. monetary policy. According to Bank of America Corp. (NYSE:BAC), if the Federal Reserve adopts too “dovish” a tone, markets could face a classic “buy the rumor, sell the news” reaction following the strong equity rally of recent months.
The bank’s strategists, Mark Cabana and Katie Craig, anticipate that the Fed could restructure its balance sheet and allocate up to 50% of its assets to short-term Treasury bills (T-bills). This would amount to $2 trillion in purchases over the next two years, absorbing much of the Treasury’s issuance: $825 billion in 2026 and $1.07 trillion in 2027. The move would aim to better align the Fed’s assets and liabilities, reduce balance sheet risks, and support Treasury financing in a period of elevated issuance.
Fundamental Analysis (BoA)
Bank of America has shown resilience in a challenging environment. In 2024, it reported net revenues of around $92 billion and net profit exceeding $26 billion, with a return on equity (ROE) of 11%. Its strong CET1 capital ratio and diversified revenue base in consumer banking, investment banking, and digital services strengthen its stability. Looking ahead, analysts expect revenue growth of around 5% annually, a trend that would be further supported if the Fed launches a new liquidity cycle.
Technical Analysis
Bank of America shares closed yesterday at $47.92, up nearly 50% in 2025, recovering levels from late 2024. The key support lies at $44.76, with the price currently holding above the 50-day moving average. Immediate resistance is at $48.54. A breakout above this level would pave the way toward the $49.31 highs, while losing current support could push the stock toward the point of control area near $45.95 and potentially down to $40.00.
The RSI at 57.78% points to consolidation before another move higher, while the MACD shows a modest bullish crossover. Trading volumes have spiked above average in the past week, reflecting heightened volatility. Along with the golden cross of May still in expansion, the long-term trend remains clearly bullish, although a decisive breakout above the $48–$49 resistance zone is needed before new highs can be reached.
Jackson Hole as a Possible Catalyst
Bank of America cautions that Jackson Hole could act as a catalyst for volatility but also as the starting point of a liquidity cycle that would benefit both the financial system and its own stock, supported by solid fundamentals and a favorable technical outlook.
*******************************************************************************************
The information provided does not constitute investment research. The material has not been prepared in accordance with the legal requirements designed to promote the independence of investment research and such should be considered a marketing communication.
All information has been prepared by ActivTrades ("AT"). The information does not contain a record of AT's prices, or an offer of or solicitation for a transaction in any financial instrument. No representation or warranty is given as to the accuracy or completeness of this information.
Any material provided does not have regard to the specific investment objective and financial situation of any person who may receive it. Past performance and forecasting are not a synonym of a reliable indicator of future performance. AT provides an execution-only service. Consequently, any person acting on the information provided does so at their own risk. Political risk is unpredictable. Central bank actions can vary. Platform tools do not guarantee success.

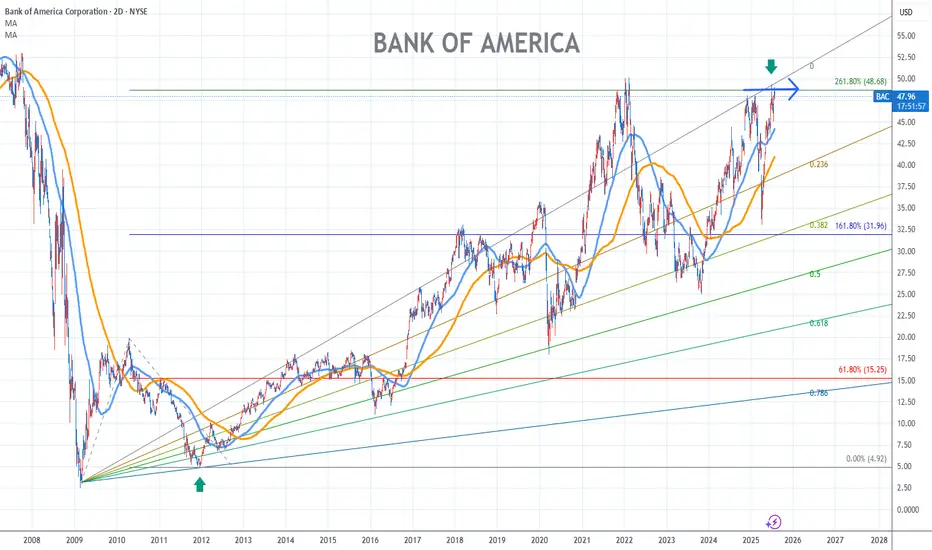
Bank of America Stock Chart Fibonacci Analysis 073025
Hit the 48.7/261.80% resistance level.
Trading Idea
Chart time frame:D
A) 15 min(1W-3M)
B) 1 hr(3M-6M)
C) 4 hr(6M-1year)
D) 1 day(1-3years)
Stock progress:E
A) Keep rising over 61.80% resistance
B) 61.80% resistance
C) 61.80% support
D) Hit the bottom
E) Hit the top
Stocks rise as they rise from support and fall from resistance. Our goal is to find a low support point and enter. It can be referred to as buying at the pullback point. The pullback point can be found with a Fibonacci extension of 61.80%. This is a step to find entry level. 1) Find a triangle (Fibonacci Speed Fan Line) that connects the high (resistance) and low (support) points of the stock in progress, where it is continuously expressed as a Slingshot, 2) and create a Fibonacci extension level for the first rising wave from the start point of slingshot pattern.
When the current price goes over 61.80% level , that can be a good entry point, especially if the SMA 100 and 200 curves are gathered together at 61.80%, it is a very good entry point.
As a great help, tradingview provides these Fibonacci speed fan lines and extension levels with ease. So if you use the Fibonacci fan line, the extension level, and the SMA 100/200 curve well, you can find an entry point for the stock market. At least you have to enter at this low point to avoid trading failure, and if you are skilled at entering this low point, with fibonacci6180 technique, your reading skill to chart will be greatly improved.
If you want to do day trading, please set the time frame to 5 minutes or 15 minutes, and you will see many of the low point of rising stocks.
If want to prefer long term range trading, you can set the time frame to 1 hr or 1 day.
Bank of America Wave Analysis – 18 July 2025- Bank of America reversed from support area
- Likely to rise to resistance level 40550.00
Bank of America recently reversed up with the daily Morning Star from the support area located between the support level 45.00 (former resistance from May and June) and the lower daily Bollinger Band.
This support area was further strengthened by the 38.2% Fibonacci correction of the earlier upward impulse from April.
Given the clear daily uptrend, Bank of America can be expected to rise to the next resistance level 49.23 (top of the previous impulse wave 1).

Bank of America Wave Analysis – 9 July 2025
- Bank of America reversed from resistance area
- Likely to fall to support level 45.00
Bank of America recently reversed down from the resistance area located between the long-term resistance level 50.00 (which started the weekly downtrend at the start of 2022) and the upper weekly Bollinger Band.
The downward reversal from this resistance area stopped the previous intermediate impulse wave (3) from the start of 2025.
Given the strength of the resistance level 50.00 and the overbought weekly Stochastic Bank of America can be expected to fall to the next support level 45.00.

BAC – Building the Base for a Breakout?Bank of America (BAC) has been consolidating quietly, attracting attention as it sits near a key mid-range level. With a 52-week low of $33.06 and a 52-week high of $48.08, the stock currently trades around $36.92 – roughly 11% above its low and 23% below its high.
This setup could be the calm before the move.
💥 Technical Outlook & Strategy
With financials holding steady and macro headwinds softening, BAC might offer a solid swing trade or medium-term positioning opportunity.
📌 Entry Points to Watch
$36.90 – Market price, if volume picks up near support
$33.30 – Prior breakout area and potential pullback support
$30.50 – Strong support and near the 52-week low for aggressive buyers
🎯 Target Levels
$39.80 – Short-term resistance; previous rejection zone
$43.50 – Fib retracement from the high, medium-term target
$47.50–48.00 – 52-week high retest, bullish scenario
🧠 Narrative to Watch
With potential Fed pauses on rate hikes, improving margins, and relative stability in U.S. banks, BAC could be positioning for a slow grind higher. Watch for earnings momentum and bond yield trends.
⚠️ Disclaimer
This analysis is for informational and educational purposes only and does not constitute financial advice. Always do your own research or consult with a licensed financial advisor before making trading decisions.

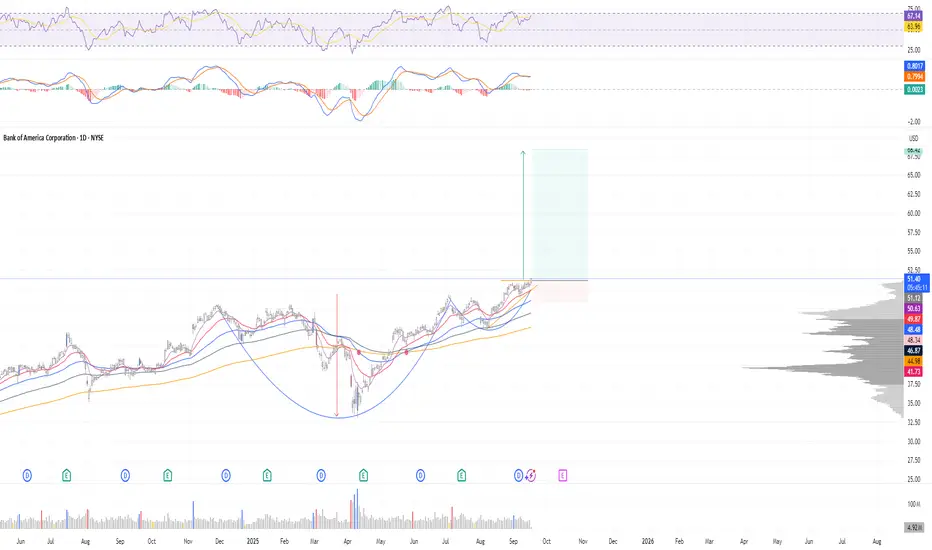
BANK OF AMERICA INCOMING BREAKOUTNYSE:BAC weekly cup and handle pattern approaching breakout...
Do you see what I see?
A weekly candle close over $50 can send this to $70.
Keep it on your radar.
-READ THE CHARTS 7/5/2025
