BAC coming close to where we can open a long position?Bank of America with its decent yield of about nearly 4% and a decent balance sheet maybe a good bye during this down turn. The trend drawn above show that approx $18.10 might be a key point for the stock. I would wait for it to reach there and show us a bounce to confirm my idea before opening a long position. As always I am a long term investor looking to buy and hold equities. Please like and comment.
Thanks everyone!
"Be Fearful When Others Are Greedy and Greedy When Others Are Fearful" - Warren Buffet
BA.CC trade ideas

BAC Amagó con cruzar la WMA21 para arriba pero finalmente termino abajo, aun no da señal de compra aunque los indicadores si los estén dando, nos mantenemos al margen y vemos mañana que pasa

BAC head and shouldersHow many trillions will they print to save it? they print the money but it doesn't go towards paying workers or saving stock price, companies getting billions from govt yet paid none in taxes, unemployment at 32%, where is the stimulus going?


BAC ResistanceThere appears to be key support at $18 not only now but throughout the history of the stock. Expect big moves for the rest of the week depending on whether or not this willbreak through the $18 support

$BAC Wedge + Trending + DivergenceMonthly Chart
Weekly Chart
1. Wedge
We can see in the 1-hour chart of Bank of America that is forming a wedge. We can see the wedge with the purple lines in the price chart.
2. Regular Divergence
In addition we can also see a regular divergence from 6th March to 23 March while the price was falling the indicator in the Rsi was rising.
3. Trend Line
We can see better in the monthly chart that there is a trend line that is forming from about 2008. The next days that will be tested.And the is the second more general trend line forming decades before.
4. Support Line
Also if we look in the monthly chart we will see that there is a main/strong support line that in the next days will be tested again. The 1st support line lies around at 15.24$ and the second at 4.92$
From the first two factors we can see that might be a breakout and form a new uptrend. At the 1 hour chart we will see that the wedge the 1st trend line and the 1st suport line get together in one spot.
So the first scenario will be to test that support at 15$ and form a new uptrend.
The second scenario is to break that support and fall until it lands at the more strong 2nd support and resistance at around 4,5$ and then form a new uptrend from there .
Scenarios

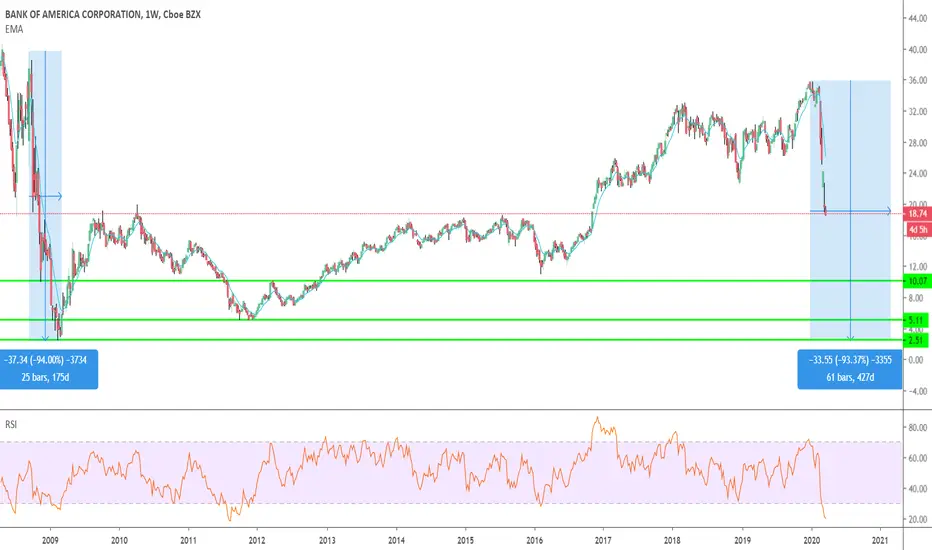
BAC - We are repeating the 2008 dropHello everyone, as we can see we are heading for the same % drop as in 2007, so expect till March - May 2021 the price to be around 5$ - 2.5$ . We do have support at 10$, but giving the fact how the 2007 crysis turned out for BAC with more than 90% drop, right now we are seeing record big drops, I see -90% from all time high price again. Right now we will see temporary retracement to the upside, but it will be fore 1-2 months, then we will drop again. Good luck to everyone, see you next year :D
BAC monthly buyBAC has formed a long legged H&S if that's a thing? along the uptrend that has formed. Following the monthly momentum of the MA we can see that it is moving upwards, and from past bounces we can see that the purple MA is the optimal buy point for BAC. Lets get that money!

baclml line of chart is 18.37 but price may test 17.81.if price break 17.81 then accordind red arrow will go to 14.15

Analyzing BAC price movements I notice a RSI divergence formingHi Everyone,
First time publishing my ideas on tradingveiw. After analyzing BAC price movements, I notice a RSI divergence forming on BAC. The divergence can be clearly seen forming. Let me know what you guys think .
P.S.
Sorry for the audio.

BANK OF AMERICA CORPORATION (BAC) WeeklyDates in the future with the greatest probability for a price high or price low


