BITF | WeeklyNASDAQ:BITF — Quantum Model Projection
Technical Update — Weekly
There is no significant change in the overall outlook. NASDAQ:BITF has retraced close to the 0.5 Fibonacci level, completing a correction in Intermediate Wave (4), which aligned with BTC’s final decline in Intermediate Wave (C).
Bitfarms now appears positioned to resume the upward trend through Intermediate Wave (5), potentially as an extension, with the Q-Target ➤ $28.88 likely by mid-June remaining unchanged under the revised wave degree structure.
🔖 This outlook is derived from insights within my Quantum Models framework. Within this methodology, Q-targets represent high-probability scenarios generated by the confluence of equivalence lines. These equivalence lines also function as structural anchors, shaping the internal geometry of the model and guiding the evolution of alternative paths as price action unfolds.
Bitfarms Ltd Shs Cert Deposito Arg Repr 5 Sh
No trades
Market insights

BITF | DailyNASDAQ:BITF — Quantum Model Projection
Technical Update — Daily
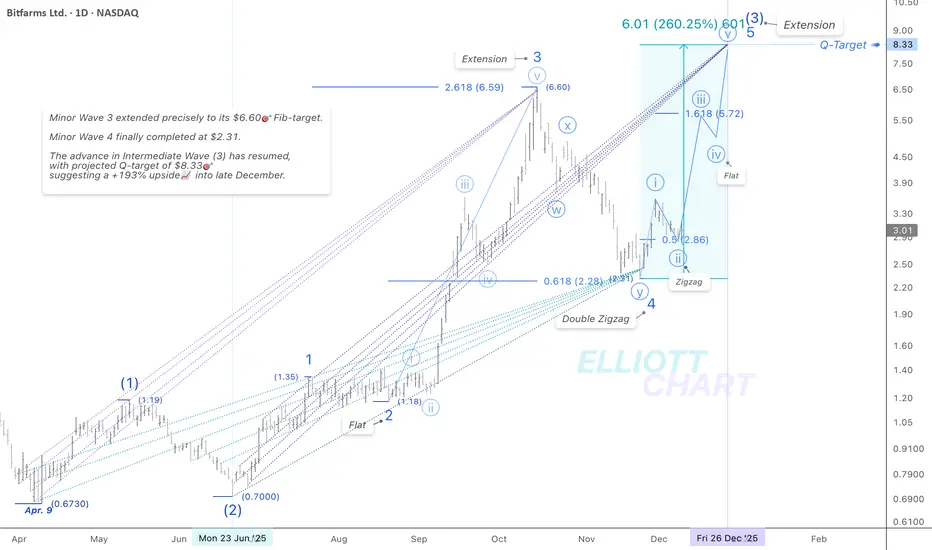
As illustrated on the chart, NASDAQ:BITF is set to resume the Minor Wave 5 extension through its impulsive 3rd wave, with the Q-Target ➤ $8.33 by late December remaining consistent with the revised structural model.
🔖 This outlook is based on insights from my Quantum Models framework. Within this methodology, Q-targets are defined as high-probability possibilities generated by the confluence of equivalence lines. These equivalence lines also act as structural anchors, shaping the internal geometry of the model and guiding the evolution of alternative paths as price action progresses.

BITFARMS can trade back under a dollar!Head and shoulders top!
#BITF is violently levered to Bitcoins price action.
Halving economics!
Dilution Risks!
The market is voting that the current hash price and capex profile do not justify the prior spike.
Miners with weaker balance sheets or higher energy costs always get punished the hardest, especially post halvening as the price of the token starts falling.

BITF | DailyNASDAQ:BITF — Technical Update
As noted earlier, Bitfarms completed a 50% retracement of Minute Wave ⓘ through a clean Zigzag correction within the anticipated Minor Wave 5 progression.
Price may now be initiating its impulsive leg toward the 1.618 Fibonacci extension, projecting a target near $5.72 .
Additionally, the Q-Target has been revised to $8.33 🎯 by late December, reflecting the updated structural outlook.
🔖 This outlook is derived from insights within my Quantum Models framework.
#QuantumModels #EquivalenceLines #Targeting #MarketAnalysis #TechnicalAnalysis #ElliottWave #WaveAnalysis #TrendAnalysis #StocksToWatch #FibLevels #FinTwit #Investing #MiningStocks #BITF #Bitfarms #DataCenters #BitcoinMining #CryptoMining #AIStocks #HPC #AI #BTC #Bitcoin #BTCUSD NASDAQ:BITF
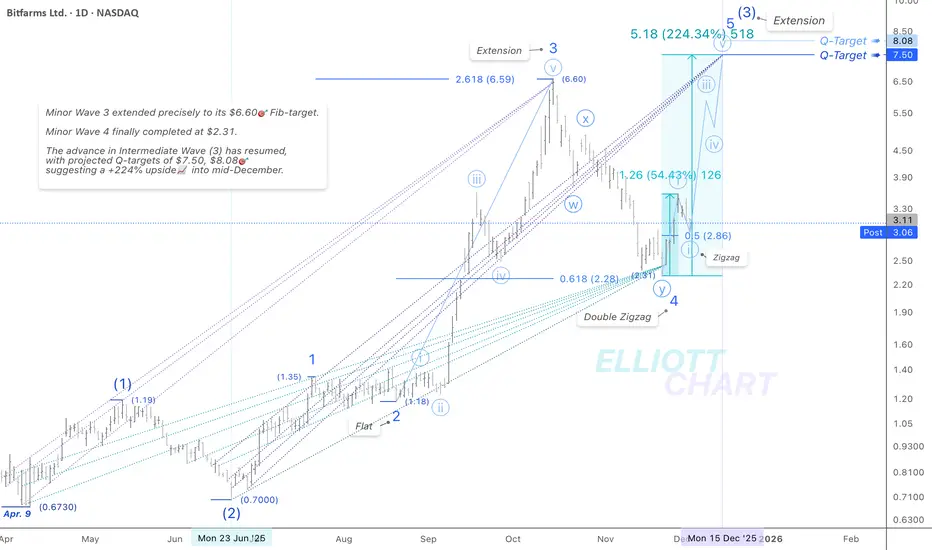
BITF | DailyNASDAQ:BITF — Technical Update
Bitfarms appears to have completed the expected pullback in the Minute degree 2nd wave, forming a zigzag close to the 0.5 Fib retracement level shown on the chart. With this correction likely finished, the advance of Minor Wave 5 may resume through its Minute degree 3rd wave impulse.
The Q-Targets projection remains unchanged ➤ $7.50 – $8.08 💫
#QuantumModels #EquivalenceLines #Targeting #MarketAnalysis #TechnicalAnalysis #ElliottWave #WaveAnalysis #TrendAnalysis #StocksToWatch #FibLevels #FinTwit #Investing #MiningStocks #BITF #Bitfarms #DataCenters #BitcoinMining #CryptoMining #AIStocks #HPC #AI #BTC #Bitcoin #BTCUSD CRYPTOCAP:BTC
BITF | DailyNASDAQ:BITF — Intraday Technical Update
Bitfarms has dropped roughly 6% amid a broader pullback across crypto-related equities, emerging as a Minute-degree retracement within the projected Minor Wave 5 advance.
This pullback remains consistent with a normal corrective structure, suggesting that—provided key support levels hold—the broader impulsive trend may still be intact.
#QuantumModels #EquivalenceLines #Targeting #MarketAnalysis #TechnicalAnalysis #ElliottWave #WaveAnalysis #TrendAnalysis #StocksToWatch #FibLevels #FinTwit #Investing #MiningStocks #BITF #Bitfarms #DataCenters #BitcoinMining #CryptoMining #AIStocks #HPC #AI #BTC #Bitcoin #BTCUSD CRYPTOCAP:BTC NASDAQ:BITF

BITF | WeeklyNASDAQ:BITF — Quantum Model Projection
As outlined in prior analyses, NASDAQ:BITF surged 35.7% directly from the apex of the convergent support-equivalence lines✨ — the standout rally of the week, that aligns perfectly with the upside momentum highlighted by the Q-model.
Wave | Trend Analysis
As noted earlier, the Leading Expanding Diagonal in Primary Wave ⓵, which originated in December 2022, outlines a potentially bullish early-cycle structure, signalling an emerging transition into an accumulation phase. Within my framework, such motive patterns often precede strong impulsive advances, reinforcing the broader bullish narrative as the Cycle-degree uptrend continues to unfold.
Following the deep retracement of Primary Wave ⓶, the impulsive extensions anticipated within Primary Wave ⓷ project toward Q-targets of $8.08 🎯 in the near term and $28.88 🎯 in the medium term.
🔖 In my Quantum Models methodology, Q-targets are defined as high-probability possibilities generated by the confluence of equivalence lines. Additionally, these equivalence lines serve as structural anchors, shaping the internal geometry of the model and guiding the evolution of alternative paths as the price progresses.
#StocksToWatch #MarketAnalysis #TechnicalAnalysis #ElliottWave #WaveAnalysis #TrendAnalysis #FibLevels #FinTwit #TradingView #Investing #BITF
#BitfarmsLtd #Canada #DataCenters #BitcoinMining #CryptoMining #AIStocks #HPC #AI #BTC #Bitcoin #BTCUSD CRYPTOCAP:BTC NYSE:AI

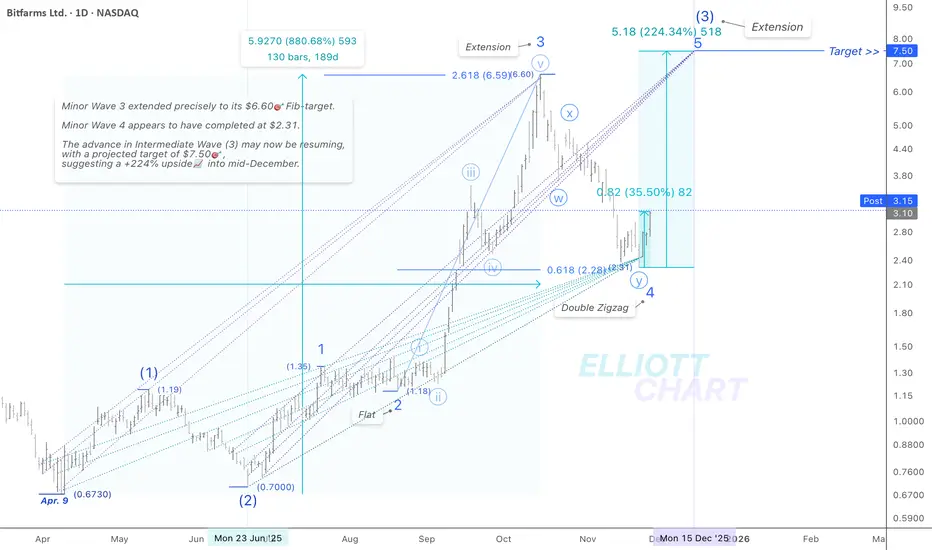
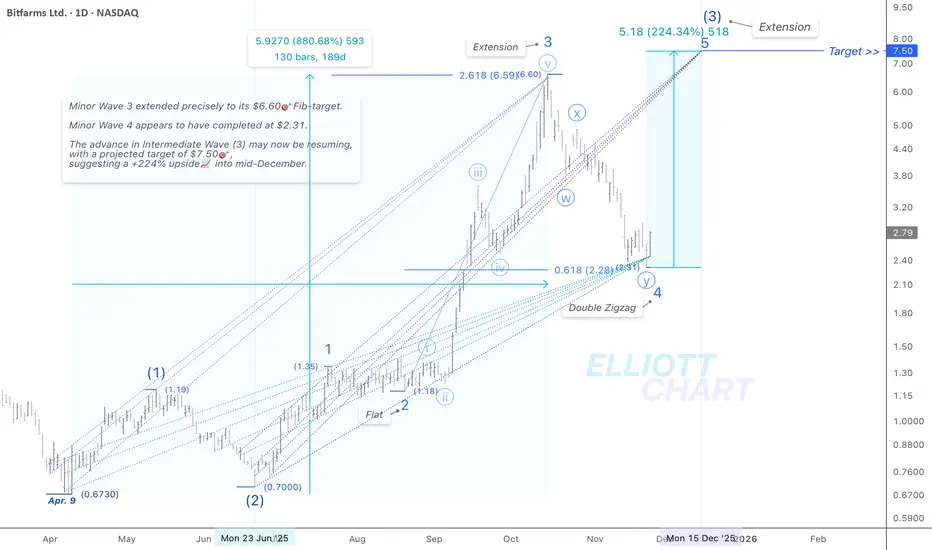
BITF | DailyNASDAQ:BITF — Quantum Model Projection
Technical Update (Daily)
$Bitfarms has surged 35.5%, marking one of the strongest rallies of the week — launching directly🚀 from the apex of the convergent support equivalence lines.
The trend of Intermediate Wave (3) has resumed, progressing through the projected advance of Minor Wave 5. There is no change to the NASDAQ:BITF technical outlook; the near-term bullish structure remains intact.
The advance of Intermediate Wave (3) is expected to re-extend toward the Q-Target ➤ $7.50, representing a total potential upside of +224%📈 by mid-December.
🔖 This outlook is derived from insights within my Quantum Models framework.
#QuantumModels #EquivalenceLines #Targeting #MarketAnalysis #TechnicalAnalysis #ElliottWave #WaveAnalysis #TrendAnalysis #StocksToWatch #FibLevels #FinTwit #Investing #MiningStocks #BITF #Bitfarms #DataCenters #BitcoinMining #CryptoMining #AIStocks #HPC #AI #BTC #Bitcoin #BTCUSD CRYPTOCAP:BTC NASDAQ:BITF
Is it time to reload $BITF? We caught the breakout in NASDAQ:BITF when it was below 3 earlier this year. It ripped all the way to $6+. Since then, the stock imploded back to the original crime scene amidst the AI overvaluation selloff. The $2.30 area provides good support and the stock has reacted off that level. If Bitfarms can scale its entrance into AI/HPC capabilities, the stock should be able to see the $3.8-4 area barring any further market selloff on AI names.
Stock is current trading around $2.70. I would put my stop at $2.30 if taking this idea.
Best of luck if tailing.
BITF / DailyNASDAQ:BITF — Quantum Model Projection
Technical Update (Daily)
$Bitfarms rallied 14.8% today, reflecting the broader strength seen across the mining sector.
Minor Wave 4, which unfolded as a Double Zigzag, now appears complete.
Although the 0.618 deep retracement is atypical for a fourth wave, the structure is now fully matured — thank you for your patience throughout the correction!
There are no major changes to the BITF technical outlook; the near-term bullish structure remains intact.
The advance of Intermediate Wave (3) is expected to re-extend now through Minor Wave 5, projecting a Q-Target near $7.50🎯, representing an estimated +224%📈 upside into mid-December.
🔖 This outlook is based on insights from my Quantum Models framework.
#QuantumModels #EquivalenceLines #Targeting #MarketAnalysis #TechnicalAnalysis #ElliottWave #WaveAnalysis #TrendAnalysis #StocksToWatch #FibLevels #FinTwit #Investing #MiningStocks #BITF #Bitfarms #DataCenters #BitcoinMining #CryptoMining #AIStocks #HPC #AI #BTC #Bitcoin #BTCUSD CRYPTOCAP:BTC NASDAQ:BITF
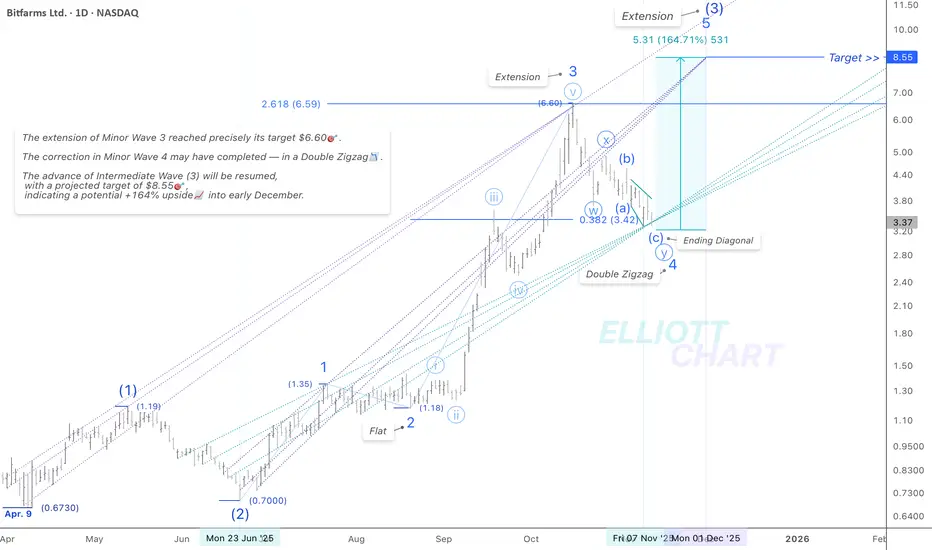
BITF / DailyNASDAQ:BITF — 📊Technical Update (Daily)
As noted earlier, the final decline of the Minor Wave 4 correction unfolded today, with price finding support near the apex of the equivalence lines, along the boundary of the Ending Diagonal in Wave (c).
Wave (c) within Minute Wave ⓨ may have taken the form of an Expanding Diagonal, signaling exhaustion and a likely reversal. A move back toward the origin of diagonal (c) would further confirm that the broader uptrend has resumed.
Therefore, the near-term bullish structure remains intact. In my view, there is sufficient room between the convergent and divergent equivalence lines to project the next advance — with Intermediate Wave (3) expected to re-extend through Minor Wave 5, targeting around $8.55🎯, implying an estimated +181%📈 upside into early December.
🔖 It’s worth noting that the equivalence lines form a core component of my personal framework, which I apply through my Quantum Models methodology.
#QuantumModels #EquivalenceLines #Targeting #MarketAnalysis #TechnicalAnalysis #ElliottWave #WaveAnalysis #TrendAnalysis #StocksToWatch #FibLevels #FinTwit #Investing #MiningStocks #BITF #Bitfarms #DataCenters #BitcoinMining #CryptoMining #AIStocks #HPC #AI #BTC #Bitcoin #BTCUSD NASDAQ:BITF CRYPTOCAP:BTC BITSTAMP:BTCUSD

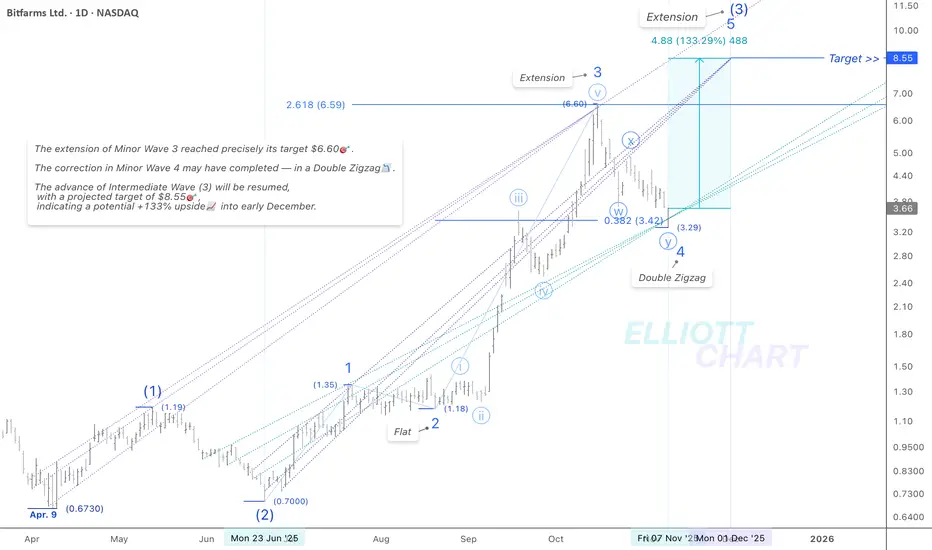
BITF / DailyNASDAQ:BITF — 📊Technical Update (Daily)
The market should be in a very late stage of the correction in Minor Wave 4, unfolding through a Double Zigzag retracement and finding support near the apex of the equivalence lines, around the 0.382 Fibonacci retracement level.
As depicted on the chart, Wave (c) within Minute Wave ⓨ appears to have formed an Ending Diagonal — suggesting that the correction in Minor Wave 4 is nearing completion around the apex of the equivalence lines, likely within the next session.
Sometimes, patience is the key!! 🕒
No significant change to the NASDAQ:BITF technical outlook.
The near-term bullish structure remains intact. In my view, there is sufficient space between the convergent and divergent equivalence lines to project the next advance — with Intermediate Wave (3) anticipated to re-extend through Minor Wave 5, targeting around $8.55🎯, implying an estimated +164%📈 upside into early December.
🔖 It’s worth noting that the equivalence lines form a core component of my personal framework, which I apply through my Quantum Models methodology.
#QuantumModels #EquivalenceLines #Targeting #MarketAnalysis #TechnicalAnalysis #ElliottWave #WaveAnalysis #TrendAnalysis #StocksToWatch #FibLevels #FinTwit #Investing #MiningStocks #BITF #Bitfarms #DataCenters #BitcoinMining #CryptoMining #AIStocks #HPC #AI #BTC #Bitcoin #BTCUSD NASDAQ:BITF CRYPTOCAP:BTC BITSTAMP:BTCUSD
BITF / DailyNASDAQ:BITF — 📊Technical Update (Daily)
As outlined in the previous update (Nov. 4), the market may have completed the correction of Minor Wave 4 through a Double Zigzag retracement — finding support at the apex of equivalence lines, near the 0.382 Fibonacci retracement level.
No specific change to the $Bitfarms technical outlook. The near-term bullish structure remains intact, with Intermediate Wave (3) anticipated to re-extend through Minor Wave 5, projecting a potential target near $8.55🎯— now implying an estimated +133%📈 upside into early December.
#QuantumModels #EquivalenceLines #Targeting #MarketAnalysis #TechnicalAnalysis #ElliottWave #WaveAnalysis #TrendAnalysis #StocksToWatch #FibLevels #FinTwit #Investing #MiningStocks #BITF #Bitfarms #DataCenters #BitcoinMining #CryptoMining #AIStocks #HPC #AI #BTC #Bitcoin #BTCUSD NASDAQ:BITF CRYPTOCAP:BTC BITSTAMP:BTCUSD #TradingView
BITF / DailyNASDAQ:BITF — 📊Technical Update (Daily)
The market remains in the final stage of the correction within Minor Wave 4, with the previous sharp and simple Zigzag now evolving into a Double Zigzag formation, targeting around the 0.382 Fibonacci retracement level.
No major changes to the $BitfarmsLtd technical outlook today. The near-term bullish structure remains intact, with Intermediate Wave (3) anticipated to re-extend through Minor Wave 5, projecting a potential target near $8.55🎯 — now implying an estimated +150%📈 upside into early December.
#QuantumModels #EquivalenceLines #Targeting #MarketAnalysis #TechnicalAnalysis #ElliottWave #WaveAnalysis #TrendAnalysis #StocksToWatch #FibLevels #FinTwit #Investing #BITF #BitfarmsLtd #DataCenters #BitcoinMining #CryptoMining #AIStocks #HPC #AI #BTC #Bitcoin #BTCUSD CRYPTOCAP:BTC BITSTAMP:BTCUSD NASDAQ:BITF #TradingView

(TSX: BITF — Bitfarms Ltd.) — Swing Trade Breakdown💰 BITF — Swing Trade Breakdown
(TSX: BITF — Bitfarms Ltd.)
🏢 Company Snapshot
Bitfarms is a Bitcoin mining and blockchain infrastructure company operating across Canada, the U.S., and South America. It’s gaining attention as crypto momentum returns and management pivots toward high-performance computing (HPC) and AI data-center infrastructure — a speculative but potentially high-growth move.
📊 Fundamentals
BITF remains a speculative play. The company is still unprofitable, so no meaningful P/E ratio applies. Debt-to-equity sits around 7.8×, which is high leverage for a volatile industry. Free cash flow remains negative due to heavy capex in new facilities. Cash reserves provide short-term flexibility, but profitability is not yet visible.
There’s no dividend, and ROE remains negative.
Summary: Fundamentally weak but improving — leveraged growth bet on the crypto/HPC narrative rather than a value play.
📈 Trends & Catalysts
Revenue grew roughly +31% YoY in 2024, while EPS losses narrowed (still negative but improving). Cash flow pressure remains, though the company continues to scale operations.
Catalysts:
• Bitcoin’s recovery and rising hash prices
• Expansion into AI and HPC data infrastructure
• Upcoming Q4 results and potential production update
• Sector-wide sentiment shift toward digital assets
Risks:
• High leverage and dilution risk
• Crypto price volatility directly impacting profitability
• Rising network difficulty squeezing margins
• Regulatory and energy cost exposure
🪙 Industry Overview
Crypto miners have rallied strongly in recent weeks. The sector is showing renewed bullish sentiment alongside BTC’s strength.
Weekly: up roughly +20%+ — short-term momentum breakout
Monthly: up ~60% — rotation into miners and AI-exposed names
12-Month: volatile, but sentiment improving as risk assets recover
Overall mood: Cautiously bullish, with traders chasing speculative beta plays like BITF.
📐 Technicals
BITF is trading around $6.46, sitting above both its 50-SMA (~$6.43) and 200-SMA (~$5.33) — confirming a shift back into a short-term uptrend.
RSI(14) sits near 57, indicating neutral momentum (room to extend).
Structure: Breakout and consolidation phase after a sharp run-up.
Support lies around $5.70–$5.80, with major resistance at $8.00–$9.00 (52-week high near $9.27).
Volume has been well above average, confirming accumulation and institutional participation on the breakout.
🎯 Trade Plan
Entry Zone: $5.80 – $6.20 (retest of support or clean breakout continuation)
Stop Loss: $5.30 (below prior support)
Target: $8.00 – $9.00 (previous range top and measured move)
Risk/Reward: ~2:1 — acceptable for a momentum swing setup
Alternate Setup: Wait for a pullback to mid-$5s if BTC retraces before next leg.
🧠 My Take
BITF fits the bill for a momentum-based swing — speculative but technically strong. The stock broke out above its long-term trend, riding both crypto and AI hype cycles. If the 50-SMA holds, this could push toward the $8–$9 zone before facing real resistance.
That said, fundamentals don’t justify a long-term hold — this is a pure swing or momentum play, not an investment. Keep position size small and risk defined.

BITF / DailyNASDAQ:BITF — 📊Technical Update (Daily)
The near-term bullish outlook remains intact, with Intermediate Wave (3) anticipated to re-extend through Minor Wave 5, targeting near the $8.55🎯 — representing a potential +111%📈 upside from current levels.
Recent price action continues to support the development of Minor Wave 5, confirming overall the ongoing bullish structure. Within this wave, the Minute degree 1st wave is done, 2nd wave may have completed — support has coherently emerged along the extension of the divergent equivalence lines, suggesting the market is positioning for an impulsive 3rd Wave to unfold next — typically the most dynamic phase of the advance.
🔖 This projection aligns with the Weekly Bullish Alternate Scenario published on September 30, and the near-term advance is projected to develop into late November as momentum builds within the impulsive wave sequence.
#QuantumModels #EquivalenceLines #Targeting #MarketAnalysis #TechnicalAnalysis #ElliottWave #WaveAnalysis #TrendAnalysis #StocksToWatch #FibLevels #FinTwit #Investing #BITF #BitfarmsLtd #DataCenters #BitcoinMining #CryptoMining #AIStocks #HPC #AI #BTC #Bitcoin #BTCUSD #TradingView

BITF / DailyNASDAQ:BITF — 📊Technical Update (Daily)
As outlined in the previous update, support has coherently emerged along the extension of the divergent equivalence lines, surrounding the 0.236 Fibonacci retracement level.
This zone marks the second wave of the projected advance in Minor Wave 5 within Int. Wave (3).
Intermediate Wave (3) is expected to re-extend through Minor Wave 5, with a target near $8.55🎯, representing a potential +131%📈 advance, projected into late November.
🔖 It’s worth noting that the equivalence lines form a core component of my personal framework, which I apply through my Quantum Models methodology.
For context, refer to the Weekly Bullish Alt. Scenario published on Sep. 30.
#QuantumModels #EquivalenceLines #Targeting #MarketAnalysis #TechnicalAnalysis #ElliottWave #WaveAnalysis #TrendAnalysis #StocksToWatch #FibLevels #FinTwit #Investing #BITF #BitfarmsLtd #DataCenters #BitcoinMining #CryptoMining #AIStocks #HPC #AI #BTC #Bitcoin #BTCUSD NASDAQ:BITF CRYPTOCAP:BTC BITSTAMP:BTCUSD #TradingView
BITF / DailyNASDAQ:BITF — 📊Technical Update (Daily)
As outlined in the prior update, support has emerged around the 0.236 Fib-retracement level, aligning with the extension of the divergent equivalence lines. This area marks the second wave of the projected advance of Minor Wave 5 within Int. Wave (3).
Intermediate Wave (3) is expected to re-extend through Minor Wave 5, with a target near $8.55🎯, representing a potential +131%📈 advance, projected into late November.
🔖 It’s worth noting that the equivalence lines form a core component of my personal framework, which I apply through my Quantum Models methodology.
For context, refer to the Weekly Bullish Alt. Scenario published on Sep. 30.
#QuantumModels #EquivalenceLines #Targeting #MarketAnalysis #TechnicalAnalysis #ElliottWave #WaveAnalysis #TrendAnalysis #StocksToWatch #FibLevels #FinTwit #Investing #BITF #BitfarmsLtd #DataCenters #BitcoinMining #CryptoMining #AIStocks #HPC #AI #BTC #Bitcoin #BTCUSD NASDAQ:BITF CRYPTOCAP:BTC BITSTAMP:BTCUSD #TradingView

BITF / DailyNASDAQ:BITF — 📊Technical Update (Daily)
As depicted on the chart, the price sits just below the apex of the resistance equivalence lines, marking a near-term zone of pressure and potential reaction. Support is expected to emerge around the 0.236 Fibonacci retracement level over the next few sessions.
Intermediate Wave (3) may have re-extended through Minor Wave 5, with a target near $8.55🎯, representing a potential +131%📈 advance projected into late November.
🔖 It’s worth noting that the equivalence lines form a core component of my personal framework, which I apply through my Quantum Models methodology.
📑For context, refer to the Weekly Bullish Alt. Scenario published on Sep. 30.
#MarketAnalysis #TechnicalAnalysis #ElliottWave #WaveAnalysis #TrendAnalysis #StocksToWatch #QuantumModels #EquivalenceLines #Targeting #FibLevels #FinTwit #Investing #BITF #BitfarmsLtd #DataCenters #BitcoinMining #CryptoMining #AIStocks #HPC #AI #BTC #Bitcoin #BTCUSD NASDAQ:BITF CRYPTOCAP:BTC BITSTAMP:BTCUSD #TradingView
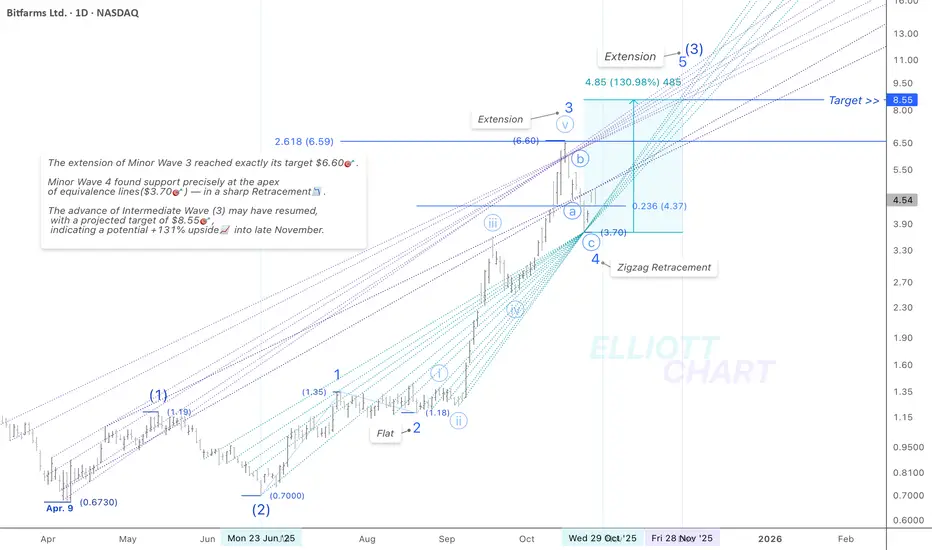
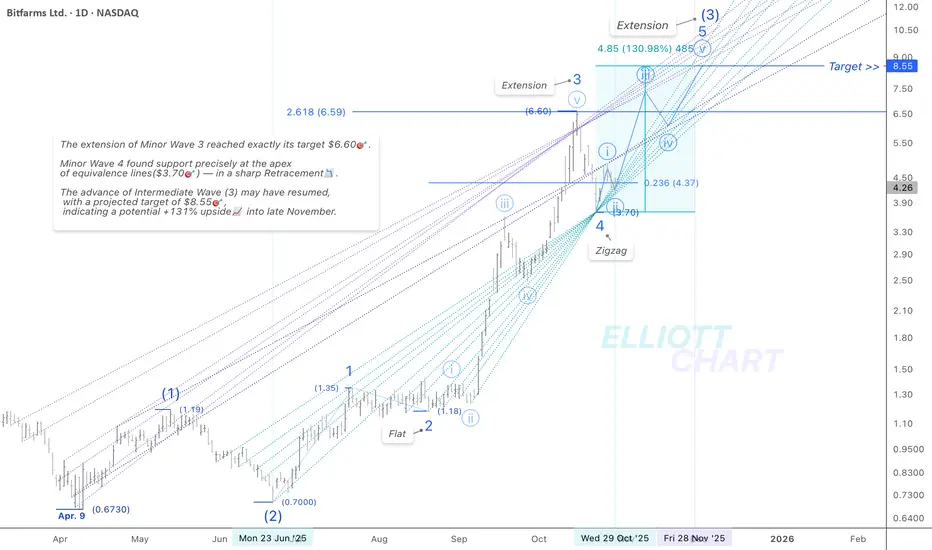
BITF / DailyNASDAQ:BITF — 📊Technical Update (Daily)
As anticipated, Minor Wave 4 found support precisely at the apex of the equivalence lines✨, followed by Minor Wave 5, which has continued to surge — reflecting a 28.88%📈 total advance over two consecutive days, fully aligning with prior expectations!!
The Extension of Intermediate Wave (3) has resumed through Minor Wave 5, with an adjusted target now set at $8.55🎯 — implying a potential +131%📈 gain, likely into late November.
🔖 The equivalence lines are part of my personal framework, applied within my Quantum Models.
📑 For context, refer to the Weekly Bullish Alt. Scenario published on Sep. 30.
#MarketAnalysis #TechnicalAnalysis #ElliottWave #WaveAnalysis #TrendAnalysis #StocksToWatch #QuantumModels #EquivalenceLines #Targeting #TradingView #FibLevels #FinTwit #Investing #BITF #BitfarmsLtd #Canada #DataCenters #BitcoinMining #CryptoMining #AIStocks #HPC #AI #BTC #Bitcoin #BTCUSD NASDAQ:BITF CRYPTOCAP:BTC NYSE:AI BITSTAMP:BTCUSD

Bitfarms Breaks out of Mulit-year resistanceIf you saw my post on Hive, you'll notice this chart looks almost identical to the Hive chart. Bitfarms has broken out of a multi-year resistance and is now testing the trendline as support, this is on the weekly timeframe. Very bullish as long as bitfarms stays above the trendline

BITF — Swing Trade Breakdown (TSX: BITF)🏢 Company Snapshot
Bitfarms Ltd. (TSX: BITF) is a Canada-based bitcoin mining and compute-infrastructure operator with facilities across Canada, the U.S., Paraguay, and Argentina.
The stock has gained attention recently due to surging crypto-mining sentiment and a sharp technical breakout.
📊 Fundamentals
BITF remains loss-making, making traditional valuation metrics less reliable.
P/E: Negative (no profits yet).
P/B: Around 4.2× — elevated for a miner still unprofitable.
Cash Flow: Negative; capex-heavy operations keep pressure on liquidity.
Balance Sheet: Recently announced large convertible notes (~US$300–500M), which could add dilution and leverage risk.
Dividend: None — this is a pure speculative growth play.
💡 Summary:
High-risk, high-reward exposure to bitcoin and compute infrastructure. Valuation remains stretched given negative earnings, but sentiment and momentum could override fundamentals in the short term.
📈 Trends & Catalysts
Revenue Growth: +31.8% YoY (FY2024: US$192.9M vs US$146.4M).
EPS: Still negative but improving (-US$54.06M vs prior year).
Cash Flow: Under pressure — analysts expect negative FCF ahead.
Balance Sheet: Leverage risk rising; capital raise adds short-term liquidity but long-term dilution concerns.
Catalysts:
Rebound in bitcoin prices and hash-rate efficiency.
Progress on compute/co-location diversification.
Technical breakout momentum and broader rotation into crypto-mining stocks.
Risks:
Bitcoin downturns or energy cost spikes can crush margins.
Regulatory tightening or dilution from new financing rounds.
Execution risk in scaling data/compute infrastructure.
🪙 Industry Overview
Crypto-mining equities have been volatile, tracking bitcoin sentiment closely.
Weekly: -20% (short-term pullback).
Monthly: +60%+ rebound for BITF amid rotation into miners.
12-Month: Volatile, underperformed broader markets.
Overall: Sentiment improving, but macro risk remains high.
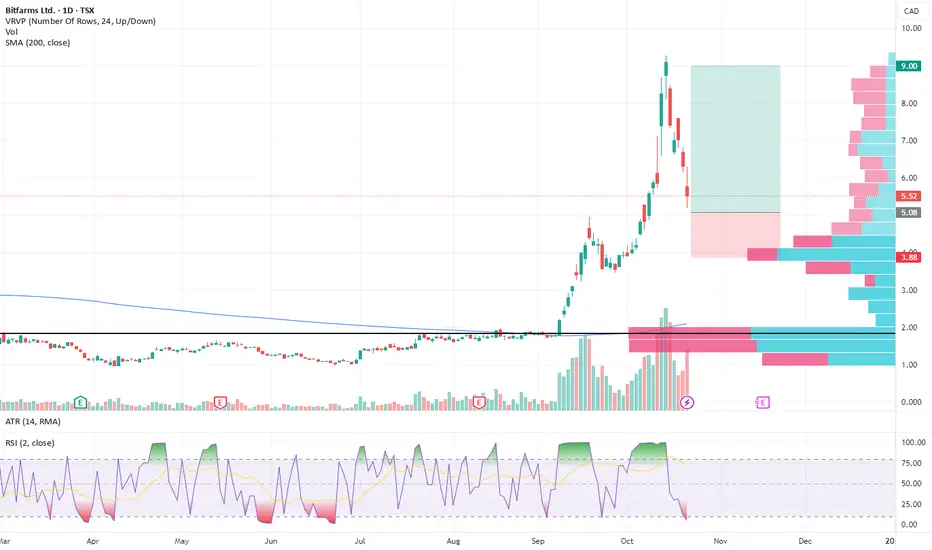
📐 Technicals
Price: ~CAD $5.52
50 SMA: ~CAD $3.63
200 SMA: ~CAD $2.09
RSI(2): 5.22 → deeply oversold, potential bounce setup
Pattern: Breakout toward ~$9.30 (52-week high) followed by pullback — potential bull flag or retest formation.
Support: ~$4.00
Resistance: ~$9.00
Volume: Strong recent uptick confirming trend continuation potential.
🎯 Trade Plan
Entry Zone: ~CAD $5.00
Stop Loss: ~CAD $3.85
Target Range: CAD $9.00 – $10.00
🧠 My Take
BITF offers a speculative swing setup fueled by crypto momentum and a bullish technical structure. It’s above key moving averages with strong volume confirmation, but fundamentals remain weak — this is not an investment, it’s a trade.
Use strict risk management, manage position size, and stay aware of bitcoin’s short-term price direction — it’s the main driver.
⚠️ Disclaimer:
This analysis is for educational purposes only and not financial advice. BITF is a high-volatility stock tied to crypto sentiment — trade at your own risk.
BITF / DailyNASDAQ:BITF — 📊 Technical Update (Daily)
As anticipated, Minor Wave 4 unfolded a sharp zigzag retracement, reflecting a 44% total decline, fully aligning with prior expectations — finding support precisely at the apex of the equivalence lines.
From here, the broader Intermediate Wave (3) advance is expected to resume through Minor Wave 5, with an adjusted target near $8.88🎯 — implying a potential +140% 📈 gain, likely into early December.
🔖 For context, refer to the Weekly Bullish Alt. Scenario published on Sep. 30.
#MarketAnalysis #TechnicalAnalysis #ElliottWave #WaveAnalysis #TrendAnalysis #FibLevels
#QuantumModels #Targeting #equivalenceLines #AtApex
#StocksToWatch #FinTwit #Investing #BITF #BitfarmsLtd #Canada #DataCenters #BitcoinMining #CryptoMining #AIStocks #HPC #AI #BTC #Bitcoin #BTCUSD NASDAQ:BITF
