BITF / DailyNASDAQ:BITF — 📊 Technical Update (Daily)
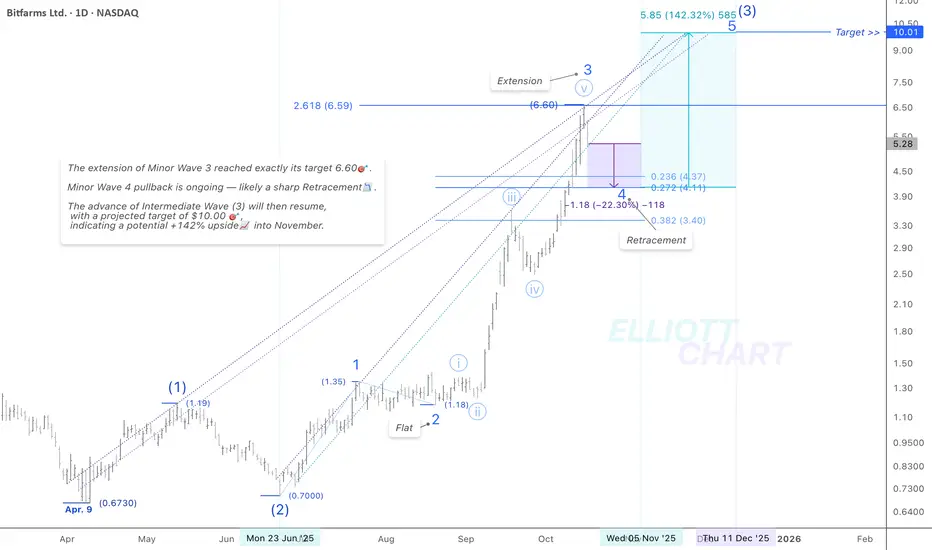
As outlined in prior analyses of $BitfarmsLtd., this week Minor Wave 3 completed its extension precisely at the projected Fibonacci target of $6.60.✨
As anticipated, Minor Wave 4 has begun its corrective pullback — currently reflecting a 30% decline, and likely unfolding as a zigzag📉 retracement toward key Fibonacci retracement levels (as illustrated on the chart).
📑Notably, today’s candle opened and closed below the green trendline, adding further confirmation to the ongoing corrective phase — patience is key!
Once Minor Wave 4 completes, the broader Intermediate Wave (3) advance will resume through Minor Wave 5, with an upside target near $10.00🎯— implying a potential +142% gain, likely into mid-December.
🔖 For context, refer to the Weekly Bullish Alt. Scenario published on Sep. 30.
@tradingview 🌷
#MarketAnalysis #TechnicalAnalysis #ElliottWave #WaveAnalysis #TrendAnalysis #FibLevels
#StocksToWatch #FinTwit #Investing #BITF #BitfarmsLtd #Canada #DataCenters #BitcoinMining #CryptoMining #AIStocks #HPC #AI #BTC #Bitcoin #BTCUSD NASDAQ:BITF CRYPTOCAP:BTC BITSTAMP:BTCUSD
Bitfarms Ltd Shs Cert Deposito Arg Repr 5 Sh
No trades
Market insights

BITF / DailyNASDAQ:BITF — 📊 Technical Update (Daily)
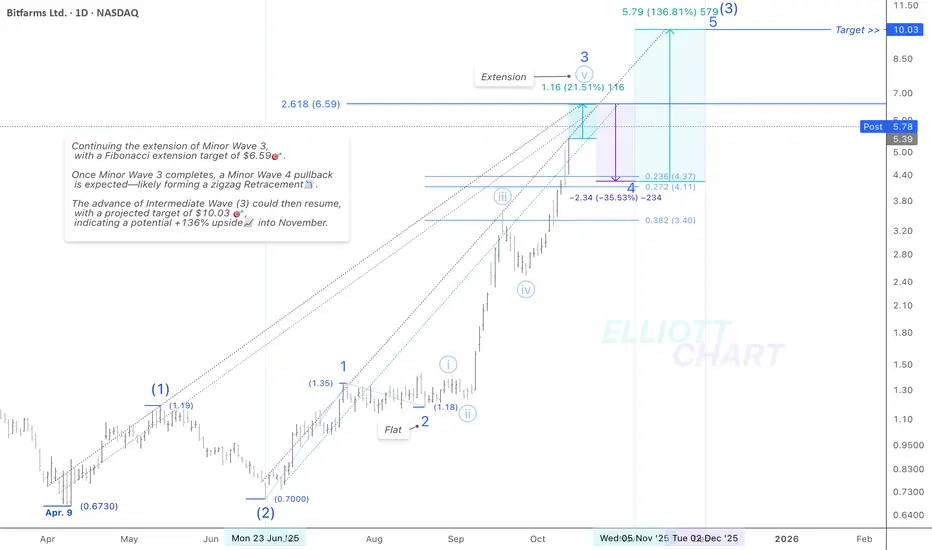
As outlined in the prior analysis on $BitfarmsLtd daily chart (posted Oct. 13), Minor Wave 3 completed its extension precisely at the projected Fibonacci target of $6.60.✨
Today, Minor Wave 4 has initiated a pullback as expected — currently reflecting an 18.3% decline, likely unfolding as a zigzag retracement toward key Fibonacci retracement levels (as depicted on the chart).
Once Minor Wave 4 completes, the broader Intermediate Wave (3) advance may resume, with an upside target near $10.00🎯, implying a potential +142%📈 gain likely into mid-December.
🔖 For context, refer to the Weekly Bullish Alt. Scenario published on Sep. 30.
#StocksToWatch #MarketAnalysis #TechnicalAnalysis #ElliottWave #WaveAnalysis #TrendAnalysis #FibLevels #FinTwit #TradingView #Investing #BITF
#BitfarmsLtd #Canada #DataCenters #BitcoinMining #CryptoMining #AIStocks #HPC #AI #BTC #Bitcoin #BTCUSD NASDAQ:BITF CRYPTOCAP:BTC BITSTAMP:BTCUSD
150% GAINS on Bitfarm technical master pieceThis is a followup on the Bitfarm stock, which is nearing the triangle target and made significant gains
BITF / DailyNASDAQ:BITF — 📊 Technical Update (Daily)
Bitfarms Ltd. surged +28.33% — Rally of the day📈 — extending Minor Wave 3 into its 5th subwave, as anticipated.
The extension of the Minute Wave ⓥ of Minor 3 remains in progress, with a Fibonacci target at $6.60 🎯.
Upon completion of Minor Wave 3, a Minor Wave 4 pullback is expected — likely unfolding as a zigzag retracement📉.
The advance of Intermediate Wave (3) may then resume, with a projected target near $10.00 🎯, implying a potential +137% upside📈 into mid-November.
🔖>> Weekly Bullish Alternative Scenario is pinned to my profile on X for reference.
#StocksToWatch #MarketAnalysis #TechnicalAnalysis #ElliottWave #WaveAnalysis #TrendAnalysis #FibLevels #FinTwit #TradingView #Investing #BITF
#BitfarmsLtd #Canada #DataCenters #BitcoinMining #CryptoMining #AIStocks #HPC #AI #BTC #Bitcoin #BTCUSD NASDAQ:BITF CRYPTOCAP:BTC BITSTAMP:BTCUSD BITSTAMP:BTCUSD
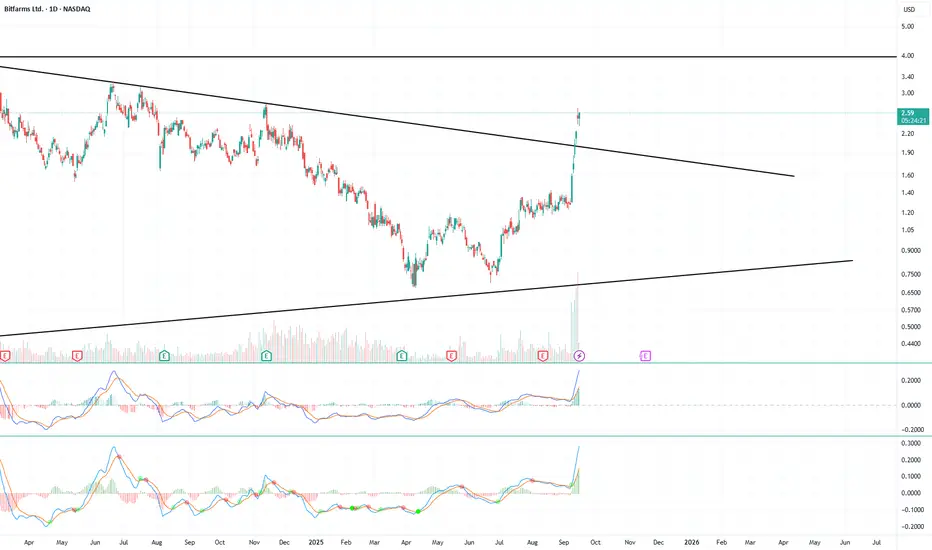
Is the breakout in $BITF sustainable? Is the breakout in NASDAQ:BITF sustainable?
After we saw names like CIRF and IREN rage due to the potential use mining setups for AI data center and infrastructure. Could this name get a sympathy move to $4?
Already up a bunch from the lows but I think there is further upside. Idea invalidated with a move below 2.35
Weekly Chart Review | Oct 6-10, 2025I wasn’t able to post my analysis on TradingView last week, so here’s a structured summary of my ticker reviews from Oct 6–10, segmented by sector with brief commentary. Each includes an update on trend structure and a link to both the original chart and the latest revision as of Friday’s close.
Technology
NASDAQ:AMD – Clean follow-through off mid-term support into the upper band of resistance. Strong rejection increases the odds that a mid-term top for the uptrend since April is being formed. Any lower-high formation next week should be approached with caution.
Chart:
Previously:
• Upside potential to resistance (Oct 7):
• Downside potential:
• On resistance & bounce potential (Aug 6):
• On macro resistance (Jul 29):
• On macro bottoming potential (Apr):
NASDAQ:NVTS – Followed the Aug–Sep setup and delivered a strong breakout Friday, but late-day reversal increases the odds of a longer consolidation into 7.80–6.80 support.
Chart:
Previously:
• Breakout and local support (Oct 10):
• Consolidation and upside potential (Sep 30):
• Higher-low potential (Sep 26):
• Mid-term support (Aug 25): www.tradingview.com
NASDAQ:MRVL – Reached the key mid-term resistance zone outlined earlier. Friday’s rejection increases odds of a pullback into 80–72 support over the coming weeks.
Chart:
Previously:
• On mid-term top (Oct 10):
• On resistance zone (Oct 2): www.tradingview.com
NASDAQ:WDC – Orderly follow-through to the downside into the 21 EMA.
Chart:
Previously: downside potential to 21 EMA –
NYSE:RBLX – Rejected at local resistance, aligning with the downside structure.
Chart:
Previously: downside potential (Oct 8):
NASDAQ:REKR – Shows strong relative strength with steady consolidation at support; constructive base-building continues.
Chart:
Previously: follow-through and support (Oct 7):
NYSE:AI – Friday breakout attempt faded back into support, increasing odds of prolonged base-building and a potential deeper pullback to 17–16.
Chart:
Previously:
On continuation potential (Oct 8):
NYSE:BB – Failed on immediate continuation and returned to support.
Chart:
Previously:
On continuation potential (Oct 8):
NASDAQ:OPEN – Constructive consolidation stalled as failed breakouts shifted odds toward a deeper pullback into mid-term support.
Chart:
⸻
Blockchain
NASDAQ:BITF – Tagged the ideal macro resistance zone; odds rise for at least a mid-term top/base formation here.
Chart:
Previously:
On upside continuation (Oct 7):
NASDAQ:HIVE – Rejection at the top of mid-term resistance; probabilities favor the start of a reversal phase.
Chart:
Previously:
On macro resistance (Oct 6):
On more immediate upside potential (Sep 24): www.tradingview.com
•On bullish potential (Sep 10): www.tradingview.com
• On bullish trend structure (Jul 21): www.tradingview.com
NYSE:BKKT – No follow-through on continuation setup, but key local support still holds; structure remains intact while above it.
Chart:
Previously:
On continuation (Oct 9):
NASDAQ:BULL – Rotating back toward macro support near 11; monitoring for higher-low formation and reversal trigger.
Chart:
Previously:
On reversal and macro support (Oct 8):
On immediate bullish potential (Sep 26): www.tradingview.com
• On macro support (Sep 19): www.tradingview.com
• On macro support (Sep 4): www.tradingview.com
• On mid-term resistance (Aug 6): www.tradingview.com
• On support and bounce potential (Jul 30): www.tradingview.com
NASDAQ:BTM – Bullish setup invalidated by breakdown into mid-term support.
Chart:
Previously:
On bullish follow-through if LOD holds (Oct 6):
⸻
Biotechnology / Healthcare
NASDAQ:VKTX – Strong follow-through from September update; watching for consolidation back into key EMAs to reset momentum.
Chart:
Previously:
On follow-through (Oct 6):
• On break-out potential (Sep 30): www.tradingview.com
• On resistance zone (Aug 11): www.tradingview.com
• On upside momentum continuation (Jul 18): www.tradingview.com
• Original setup (Jun 30): www.tradingview.com
• Follow-up (Jul 8): www.tradingview.com
NASDAQ:NTLA – Clean follow-through into mid-term resistance; rising odds for a topping/base formation.
Chart:
Previously:
On break-out to resistance zone (Oct 8):
On support and bullish trend-structure (Sep 26): www.tradingview.com
NASDAQ:PGEN – Couldn’t stage a recovery yet but remains within mid-term support; stabilization needed for a constructive setup.
Chart:
Previously:
On potential reversal (Oct 8):
On mid-term support (Sep 15): www.tradingview.com
NASDAQ:ABCL – Momentum attempt resumed but failed to follow-through; still constructive above 21 EMA.
Chart:
Previously:
On local support and continuation potential (Oct 8):
On support and bullish trend-structure (Oct 7):
⸻
Energy
AMEX:GTE – Impulsive advance at risk of morphing into a diagonal correction; elevated probability of retesting September higher lows.
Chart:
Previously:
On constructive looking consolidation (Oct 6):
⸻
Miscellaneous / Other
NASDAQ:SLDP – Rising risk of a local top after Friday’s distribution; while above 21 EMA, a final push into resistance remains possible.
Chart:
Previously:
On follow-through and resistance zone (Oct 6):
On mid-term support and bullish potential (Sep 19): www.tradingview.com
NASDAQ:DPRO – Solid 2.5-day follow-through from the Oct update; Friday’s action suggests increased consolidation or reversal risk.
Chart:
Previously:
On local support and continuation (Oct 7):
NASDAQ:DLO – Disappointing fade after a promising start; must hold above 50-DMA to reassert upside momentum.
Chart:
Previously:
On break-out potential (Oct 8):
On pullback potential (Sep 22): www.tradingview.com
• On downside potential and support (Sep 3): www.tradingview.com
Thank you for your attention and have a great start of the week!
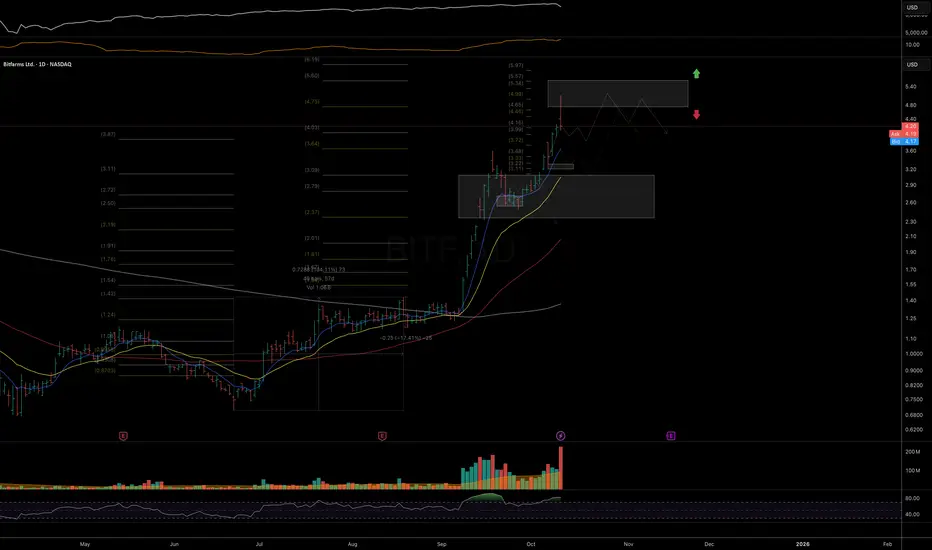
BITF / DailyNASDAQ:BITF — 📊 Technical Update (Daily)
As shown on the daily chart, Minor Wave 3 may extend further, followed by a pullback likely in Minor Wave 4 — potentially unfolding as a Zigzag retracement 📉.
Once the corrective phase in Minor Wave 4 completes, the advance in Intermediate Wave (3) is expected to resume, with a projected target near $5.45🎯 .
This implies a potential +93% upside📈 over the next month.
>>📌 Weekly Bullish Alternative Scenario is pinned to my profile on X for easy reference.
#StocksToWatch #MarketAnalysis #TechnicalAnalysis #ElliottWave #WaveAnalysis #TrendAnalysis #FibLevels #FinTwit #TradingView #Investing #BITF
#BitfarmsLtd #Canada #DataCenters #BitcoinMining #CryptoMining #AIStocks #HPC #AI #BTC #Bitcoin #BTCUSD NASDAQ:BITF CRYPTOCAP:BTC IG:BITCOIN

BITF / DailyNASDAQ:BITF / Daily Chart — 📊Technical Update
Since mid-September, the stock has been consolidating within what appears to be a Zigzag retracement, likely unfolding as Minor Wave 4. This corrective phase is part of the broader Intermediate Wave (3) advance.
Once Minor Wave 4 completes, the uptrend is expected to resume with strength, marking the last leg 📈( Minor Wave 5) of Intermediate Wave (3).
Based on the current structure, a potential 93% gain could unfold within the coming month , contingent on confirmation of the wave breakout.
#StocksToWatch #MarketAnalysis #TechnicalAnalysis #ElliottWave #WaveAnalysis #TrendAnalysis #FibLevels #FinTwit #TradingView #Investing #BITF #BitfarmsLtd #Canada #DataCenters #BitcoinMining #CryptoMining #AIStocks #HPC #AI #BTC #Bitcoin #BTCUSD NASDAQ:BITF CRYPTOCAP:BTC BITSTAMP:BTCUSD IG:BITCOIN

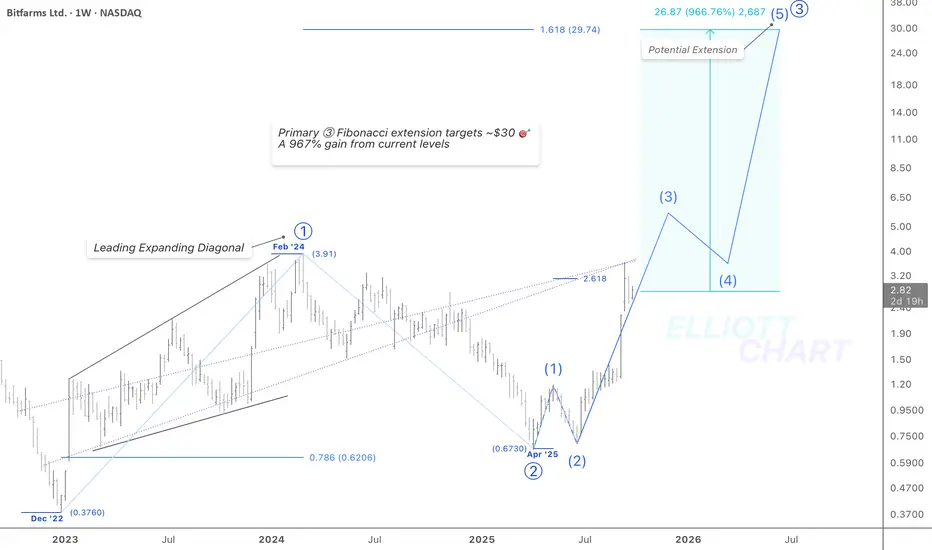
BITF / WeeklyNASDAQ:BITF
Wave Analysis — Bullish Alternative Scenario📈
The formation of an Expanding Leading Diagonal in Primary Wave ⓵ hints at a transitional phase from prior bearish exhaustion into a bullish accumulation. This early-stage motive structure often precedes strong impulsive advances and supports the broader case for Cycle Wave III (not shown in this frame) potentially is underway.
Following this, Primary Wave ⓶ completed a deep corrective retracement, terminating near the 78.6% Fibonacci level of Wave ⓵ — a commonly observed retracement depth for second waves following diagonals in the wave one position. This deep correction likely served to neutralize remaining bearish sentiment, clearing the path for the initiation of Primary Wave ⓷.
Technical Commentary (Within Primary Impulsive📈 Wave ⓷)
Currently within Primary Wave ⓷, the ongoing impulse of Intermediate Wave (3) has paused near the apex of the equivalence lines drawn from the Expanding Leading Diagonal in Wave ⓵ — a key confluence zone in my personal technical framework.
This area represents a notable technical inflection point, where price is interacting with structural geometry from the base of the trend — potentially a reactive zone before further continuation.
Using Fibonacci extension measurements, the projected target for the completion of Primary Wave ⓷ lies near $30🎯, which would represent a 967% gain from current levels.
#StocksToWatch #MarketAnalysis #TechnicalAnalysis #ElliottWave #WaveAnalysis #TrendAnalysis #FibLevels #FinTwit #TradingView #Investing #BITF
#BitfarmsLtd #Canada #DataCenters #BitcoinMining #CryptoMining #AIStocks #HPC #AI #BTC #Bitcoin #BTCUSD NASDAQ:BITF CRYPTOCAP:BTC NYSE:AI BITSTAMP:BTCUSD IG:BITCOIN
Bitfarms Ltd. (BITF)Stock by breaking up 3.91$ level, a Shark Harmonic shap formation pattern will be activated.
2 Target prices tended to reach in short term period 👌
1st Target price = 8.34$.
2nd Target price = 10.53$.
Highly & Strongly recommended for BUY from present level 👌.
All the best 👍.

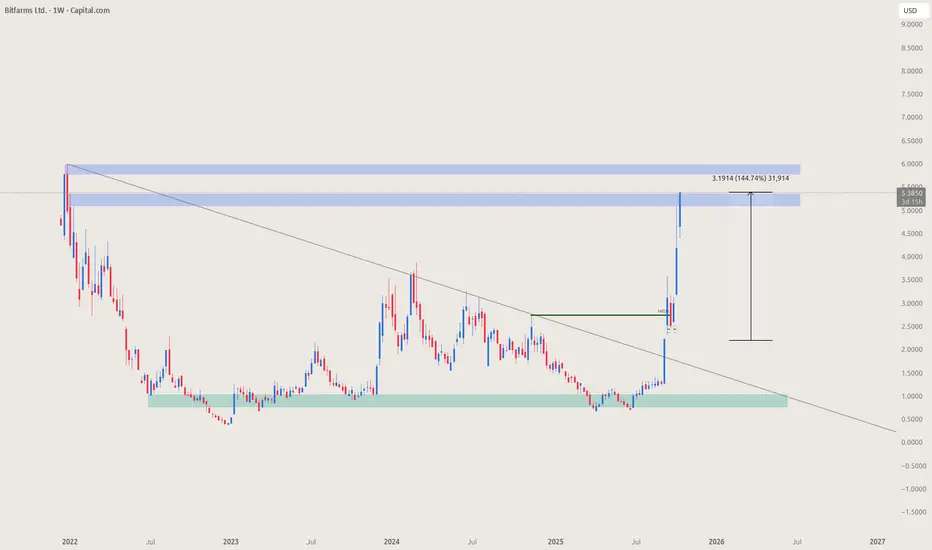
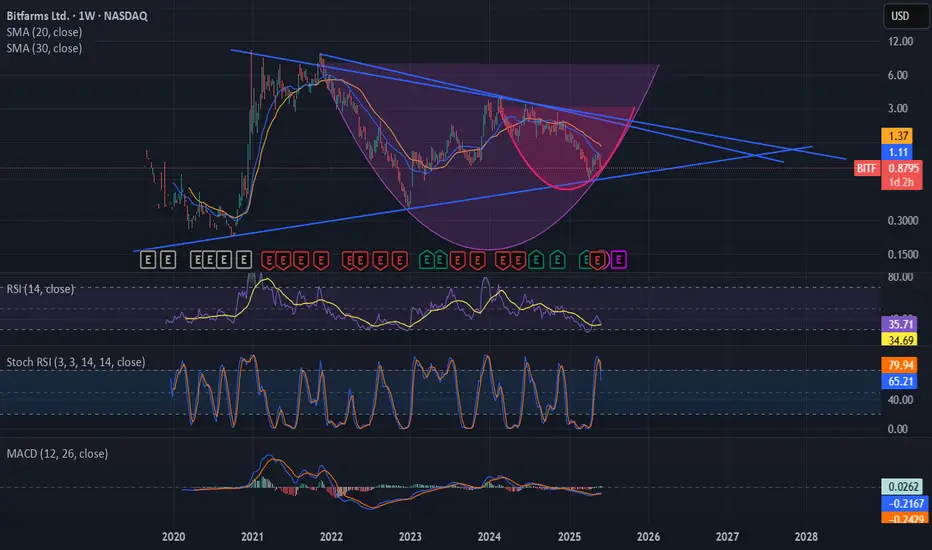
BIT Farm - potential weekly breakout Triangle Measurements:
Triangle starts: $0.37
Triangle top: $5.83 (not $6.00 as I initially thought)
Triangle height: $5.83 - $0.37 = $5.46
Current breakout level: ~$1.75
🎯 Technical Setup:
2+ year descending triangle at APEX
Strong $1.00-1.20 support tested multiple times
Volume drying up = coiling for EXPLOSIVE breakout
Target: $3.50-4.00+ (100-150% gain minimum)
🚀 Fundamental GOLDMINE:
AI Infrastructure Pivot: Transforming from Bitcoin mining to AI data centers
Microsoft Catalyst: $17.4B AI deal just boosted ALL mining stocks 22%+
Location Advantage: Panther Creek campus NEXT TO CoreWeave sites!
Massive Pipeline: 1.3 GW capacity with 80% in US
💰 The Arbitrage Opportunity:
Currently valued like struggling Bitcoin miner (6-12x EV/EBITDA)
Should be valued like AI infrastructure company (20-25x EV/EBITDA)
Potential revaluation: 200-400%!
🎪 Why This Could Be HUGE:
Industry Trend: 20% of Bitcoin miners pivoting to AI by 2027
Power Shortage: AI needs 40GW+ of power - miners have it!
First-Mover: Bitfarms among first to execute this pivot
Proven Model: CoreWeave's success validates the opportunity
My Targets:
Phase 1: $7.21 (technical measured move) ✅
Phase 2: $12-15 (AI revaluation begins)
Phase 3: $20+ (full transformation recognized)

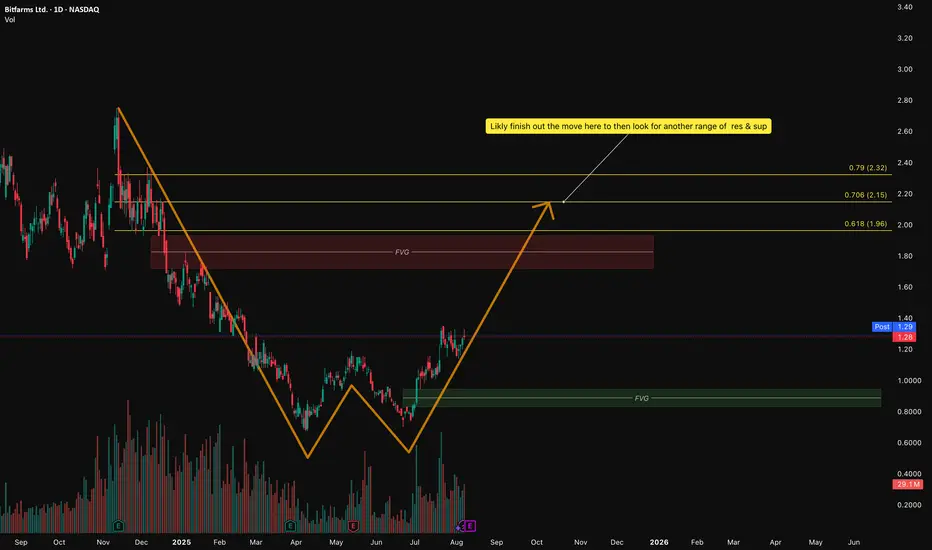
Bitfarms (BITF) – Double Bottom Playing Out, Eyes on the Fib LevChart’s been building for a while and finally gave a clean W structure. Double bottom’s in motion and volume confirmed the move — not a guess, not a gamble. Just following the price.
🧠 What I’m Seeing:
• W reversal is clear — structure’s been respected all the way through.
• Massive buy volume on the second leg tells me there’s real interest, not just noise.
• Watching the Fair Value Gap (FVG) between ~$1.85–$2.00 — likely where this current leg cools off.
• Above that, Fib targets at:
• 0.618 = $1.96
• 0.706 = $2.15
• 0.79 = $2.32
That $2.00–$2.32 zone is where I expect things to get interesting. Could stall. Could break. I’ll wait for the chart to show it.
Bitfarms about to rip higherWith Bitcoin hitting all-time highs today, Bitfarms is trading near its all-time lows and breaking out of this downward sloping trendline. Look for BITF to go much higher if Bitcoin continues its rally!

Get on this Pony. Bitfarms wont shit the FarmI get it, you're scared, I'm scared, we all scared together. If you're scared thats when you BUY BUY BUY. The chart tells the story. This will be at least 100% in the next 6 months easily. Vamos a la fiesta, together.
If bitcoin booms in June July August, will this print?NASDAQ:BITF call option Nov 21 (185d away) Strike: $2.50 Premium Paid: $360

Will $BITF print? Jan 16, 26 (240d) $3 strike 10 contractsI have entered this trade with a small $140 premium, this is Jan 16 because I do not want decay and I'm expecting large moves in bitcoin climbing to $217,000 end of year, hence I think NASDAQ:BITF trades above $8 until expiration, so I'm looking to capture some upside here with a small position. I'm open to adding more contracts as I go.

200% by year end?Hola Muchachos. We got a good setup here with the arc protecting the form. Its hit bottom support and took a bounce. We can expect to see $2 by end of summer. Crypto been in the gutter for a few months, so now as Gold takes a breather, its time for it to shine a little bit before it goes into a long cold hibernation.

Bitfarms LongI see a good opportunity here with Bitfarms.
It’s been holding this level very well amidst the strong volatility.
It is a 1:31.5 risk to reward opportunity
Probability rating 5/10
Risk to reward rating 10/10
Overall rating 7.5/10

$BITF - Time to BuyFor those of you looking to capitalize on NASDAQ:BITF you may want to add to your position, or start accumulating for the first time.
Posting a fresh idea here for NASDAQ:BITF now that the bottom should be in.

Bitfarms - Now or neverIf Bitfarms closes below 1.37 on a weekly candle it would be a major sign that Bitcoin has peaked.
I don’t think this is likely but I do think this will be the final chance to go long on Bitfarms as this is a major support level between 1.37 and 1.75.
The opportunity is a 1:17.5R trade.
Trade quality:
Chance of success 70% (assuming market moves into the zone with the confines of the wedge pattern shown)
Risk to reward rating: 7/10
Overall rating: 7/10

Long at 1.40 - might be too late to get in nowI realize that this one may be too late, but I went long NASDAQ:BITF at the close today. I can't resist a sale on miners, and while Bitcoin was down hard today, it was in sympathy with the market and not because of Bitcoin "fundamentals", such as they are (or aren't.
With BITSTAMP:BTCUSD down less than 2% and this one down 14%, and all the HODLrs are whining about manipulation, I see a bargain thanks to those short sellers that jump on the miners hard when things get tough for $BTCUSD. Those short sellers eventually cover and juice it back in the other direction excessively when they do.
I am intentionally providing a naked chart and no discussions of hashrates or server farms specifically to irritate my favorite troll because it makes him 💩 (as if the price action of the miners that he HODLs so dear didn't already do that). None of that stuff matters to me anyway - the algo rules this quick (ideally) in and out trade. The carnage may well not be over yet, but if it is this one could pop big tomorrow, so that's the only premise for this trade.
Sadly, it's already trading up a few percent after hours, and depending on what BITSTAMP:BTCUSD does overnight, it may not see 1.40 again before this trade closes. I wouldn't recommend reaching for this, as the short term downside risk is real depending on what the market does tomorrow.
This one may not be the 1 day reversal win I always hope for, but I think this is a very overdone selloff. It may continue for a day or two, but it could also rebound 5 or 6% tomorrow, so count me in. I am prepared to weather the storm however, as surely analysts will look to vocally cover their ass3s now that Wall Street's darling has become the Flavor of the Weak (shout-out to American Hi-Fi).
There are few stocks that people get so wildly over-optimistic and wildly pessimistic about as this one, and that is an opportunity, in my mind. It held 117ish support and has more below that, but this move today definitely did technical damage that will take time to repair.
And if the DeepSeek news is legit (consider me still a skeptic) it could do damage here fundamentally long term. The fact is, though, DeepSeek is still running on NVDA chips, not someone else's. Just maybe not as many or as powerful. That's a real concern - or should be if DeepSeek is legit. Even if it is, though, this trade is all about stocks not moving in straight lines up or down. I'm confident I'll make money whatever direction it moves - but up tomorrow would certainly make that job a lot easier.
Per my usual strategy, I'll add to my position at the close on any day it still rates as a “buy” and I will use FPC (first profitable close) to exit any lot on the day it closes at any profit.
As always - this is intended as "edutainment" and my perspective on what I am or would be doing, not a recommendation for you to buy or sell. Act accordingly and invest at your own risk. DYOR and only make investments that make good financial sense for you in your current situation.

Bitfarms LongIt’s been a while since my last analysis on BTC miners.
There is a strong chance Bitcoin has bottomed and combine that with a clear wedge pattern on Bitfarms after a bullish shift and it provides an opportunity which I think has a 25% chance of playing out.
It’s about a 54R trade.
If it doesn’t bottom here I think it does next week and it follows approximately the orange path.

$BITF - Time to Shine?NASDAQ:BITF
This stock have been relatively unimpressive since its big rally in March 2024.
Bitfarms Ltd. NASDAQ:BITF presents a compelling bullish opportunity for investors as the company positions itself for significant growth. Despite underwhelming performance since its March 2024 rally, recent developments suggest potential for higher prices in the months ahead.
With Bitcoin crossing the $100,000 mark, Bitfarms is well-positioned to capitalize on increased cryptocurrency adoption. Its synthetic HODL strategy, which saw a 286% rise in long-dated Bitcoin call options, reflects confidence in higher Bitcoin prices, further supporting its bullish outlook
In conclusion, Bitfarms’ strategic upgrades, market positioning, and Bitcoin’s bullish environment support a favorable outlook. Investors seeking exposure to the cryptocurrency mining sector may find NASDAQ:BITF an attractive candidate for medium- to long-term growth.
I will post further Exit/ TP objective as we see NASDAQ:BITF move out of its current consolidation.
