Berkshire: Pulling BackBerkshire shares have recently surrendered some of their hard-earned gains. Despite this pullback, we continue to place the stock within magenta wave (X), which still offers some upside potential. A more pronounced downward move is likely only once the stock transitions into magenta wave (Y). At that point, we expect a retracement into our green Target Zone ($444.68–$415.61). Alternatively, it’s possible that the correction of wave alt. has already concluded. In this scenario, price would break above resistance at $571.83 directly, without first retesting the green zone—a development we assign a 35% probability.
Trade ideas

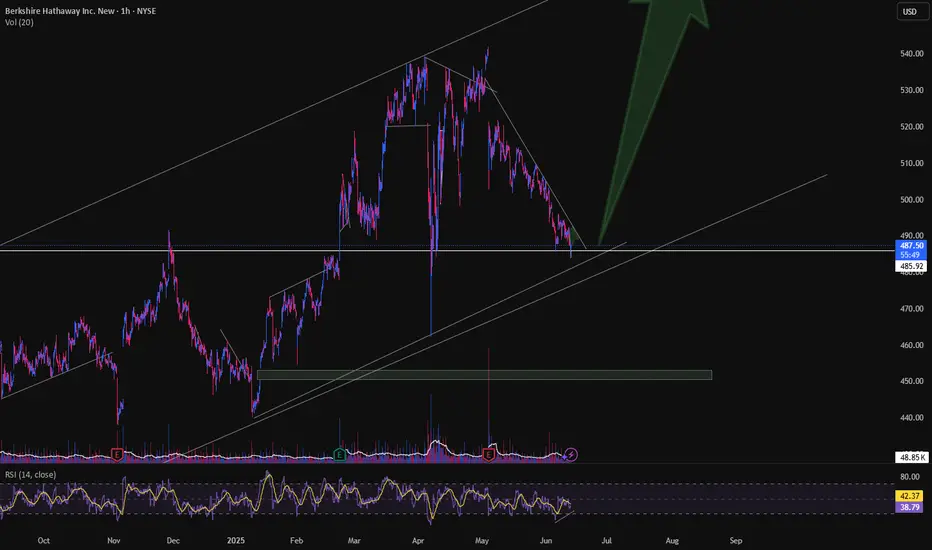
BRK.B - Back to former glory=======
Volume
=======
-neutral
==========
Price Action
==========
- falling wedge
- Weak selling pressure
- broken out of 2.5 years downtrend line
=================
Technical Indicators
=================
- Ichimoku
>>> price above cloud and rebounded from green kumo
>>> Green kumo budding
>>> Tenken + Chiku - above clouds
>>> Kijun - Above clouds
=========
Oscillators
=========
- MACD turning bullish
- DMI neutral
- StochRSI, turning bullish, reversing into band
=========
Conclusion
=========
- short to long term breakout swing
- price may reverse at current level, to enter spot or wait for pullback at entry 2.

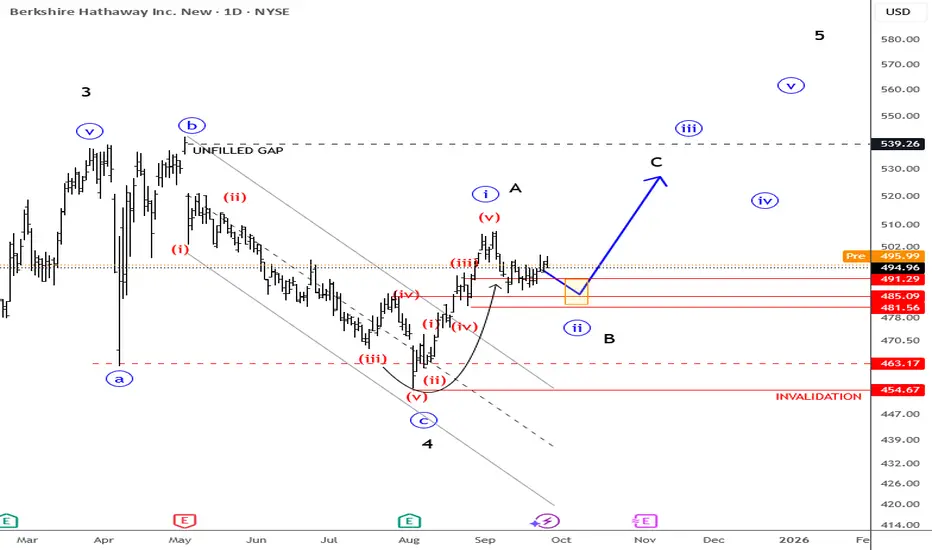
Berkshire Hathaway: Clear Wave Structure Offering More GainsWhen I scan through charts, whether it’s stocks, currencies, or commodities, I want to focus on something that has a clear wave structure. Patterns like this allow me to read price action with more confidence, without needing to guess or force an opinion. Berkshire Hathaway is one of those charts right now.
What stands out is the sharp selloff, which looks like a textbook impulse. More importantly, there’s also a clear impulsive move from the lows. That combination suggests we could be looking at wave C low of a completed flat correction. If that’s the case, then more upside should follow.
Even in a less bullish scenario, where the structure plays out only as a temporary A-B-C rally, we would still expect further gains in wave C after the current pause. Either way, the clear structure points higher near term.
For me, this is where the opportunity lies. Markets are full of noise, but when you find a chart with this kind of clarity, it becomes easier to focus and build a plan around it.
Grega
BRKi have 2 tarde plan for Long.
Plan A (1st entry at 0.382% fib level stop loss Swing Low TP RR1:1 ).
Plan B (2nd entry at Bulish flage poll breakout target last sawing high).

Berkshire Hathaway (Class B) TANYSE:BRK.B — Daily
Set-up: After a 4-month downtrend, price based at $455.19 on increased volume. Since then, an 8-wave EWT fractal has played out and price has coiled into an ending/contracting triangle.
Evidence
Trend exhaustion signals: CCI pushed outside its Bollinger band on 5 Jun and 4 Aug; the latter aligned with the volume peak and low at $455.19.
200-day SMA: Flipped from resistance to support and has been respected since July, especially through mid-September while price consolidated inside the triangle.
Volume profile: A volume shelf sits at the lower edge of the triangle, consistent with acceptance and a pending range break.
MA squeeze: Short MAs are compressing → rising odds of a directional move.
Levels & paths
Upside trigger: Triangle breakout → first resistance/target $507.66 (recent swing high).
Downside risk: If the triangle fails and resolves as a bear pennant, a 1:1 pole projection points to ~$467. Loss of the volume shelf would add confirmation.
What I’m watching
A decisive daily close outside the triangle with volume expansion.
CCI to exit its band in the direction of the break (momentum confirmation).
200-day SMA reaction: hold = constructive, fail = favors ~$467 projection.

Test buy in strategy simulator at 495.35 of BRK.BBuy in strategy simulator at 495.35 with target 1 at 521.60, target 2 at 538.92, and stop at 462.00.

Berkshire Hathaway Inc(NYSE) (W)- Renewed institutional interestBias : Currently bullish on the weekly timeframe as long as price sustains above $504.73 with volume support. A breakout above $534.68 would confirm strength toward $564–595 zones.
Potential Scenarios
Bullish Case
If price holds above $504.73, next upside targets are:
$534.68 → strong resistance
$564.63 → breakout confirmation zone
Beyond that → $594.57 and $624.52
Alternatively, consider buying a pullback to $480–$490 with a stop below $474 for a lower-risk entry.
Bearish Case
Rejection at $504.73–$534.68 zone could push price back to $474.79 support.
A close below $474.79 would indicate a deeper correction.
Volume Analysis
Weekly buying volume increased, supporting the upward move.
Sustained higher volume compared to the last few weeks suggests renewed institutional interest.
The blue average volume line shows volume is now above average, validating the breakout attempt.
⚠️ Disclaimer : This chart is for educational purposes only.
Regulatory Note: We are an independent development team. Our services are not registered or licensed by any regulatory body in India, the U.S., the U.K., or any global financial authority. Please consult a licensed advisor before making trading decisions.

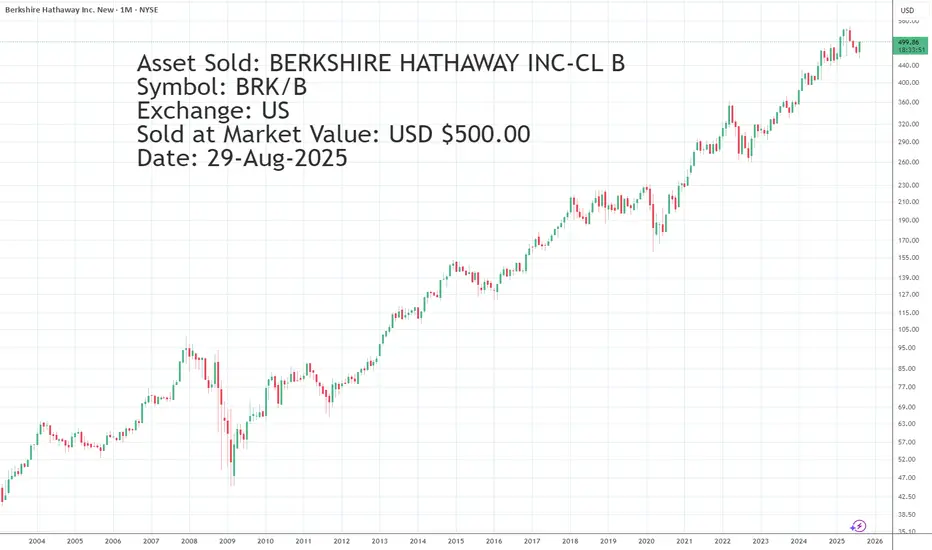
Asset Sold: BERKSHIRE HATHAWAY INC-CL B Symbol: BRK/B Exchange: Asset Sold: BERKSHIRE HATHAWAY INC-CL B
Symbol: BRK/B
Exchange: US
Sold at Market Value: USD $500.00
Date: 29-Aug-2025
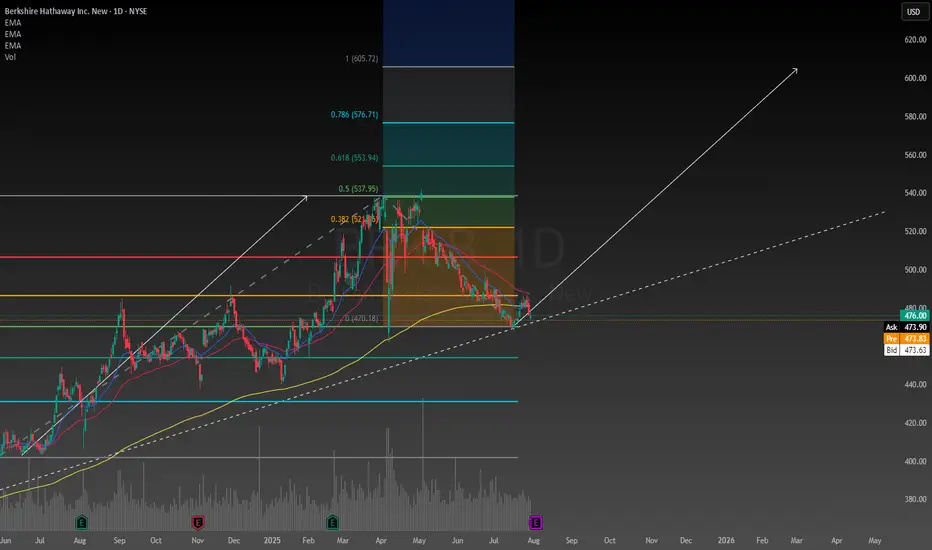
Berkshire: All Set for a Bullish MoveBerkshire is all set for a bull move.
Price has taken support at the 200-day EMA and is continuing the uptrend.
This pattern has repeated many times on this specific stock.
With a close stop-loss investors can ride the forthcoming bull wave.
(For educational purposes only)

sellers seem to relinquish control, upcoming cheap =BUYers world1->3 : create a lower low , this makes
total sense in a downtrend, simply a
continuation
3->4 : surpass the sellers from number 2 ,
this creates a logical change in perception,
the people in control of the market are no
longer the sellers from number 2 , but the
buyers who have originated and pushed up
from 3
what do I think will happen?
* I think we will return to #3 , not sure when
or how powerfully, we could gap down there
and just touch it or slowly go down
* we will confirm the low then continue upward
* the second vwap range is around that area, if price goes up, then pushes down, it could be in
perfect position to mark out the next leg up
* a buy limit is the order to place here


Warren Glass Building Collapsed. as expected, Warren's diamond glass building collapsed, and the ultimate target for the butterfly of sellers is probably $412.

Berkshire Hathaway looks appealing in todays market conditionsWith most markets at all time highs it is becoming increasingly difficult to find good opportunities for buying. I have decided to allocate about 9% of my portfolio to Berkshire Hathaway as a sort of hedge against some of my other positions. I like to have a diverse exposure to the markets and with Berkshire Hathaway being a conglomerate it is a perfect stock for someone like me to invest in. The stock seems to be doing the opposite of the us500 so far this year hence why I call it a hedge. According to my simple technical analysis there is a probability for the stock to make a reversal after spending some time going down.
The company has already donated plenty of shares which probably has something to do with it going down, which presents a unique opportunity to invest in it since there is nothing fundamentally wrong with the company. With that being said they have also said they probably wont engage in share buy backs until next year at least so it could be a falling knife type situation. However I am confident in the company and feel like it is a great stock to have in my portfolio for the long term.
The range of the intrinsic value according to the discounted cash flow model is between $400-$1000 with a 5 year exit. Assuming a 7.4% discount rate the intrinsic valuation for the stock is $575 presenting a unique opportunity for a 20% upside. The stock is certainly undervalued but like I said it could be a falling knife in the worst case scenario. Calculating the intrinsic value is highly speculative and complex, but it gives me increased confidence in my decision to push the buy button. I hope you found my analysis useful, drop a comment if you want to talk more about the stock or whatever.
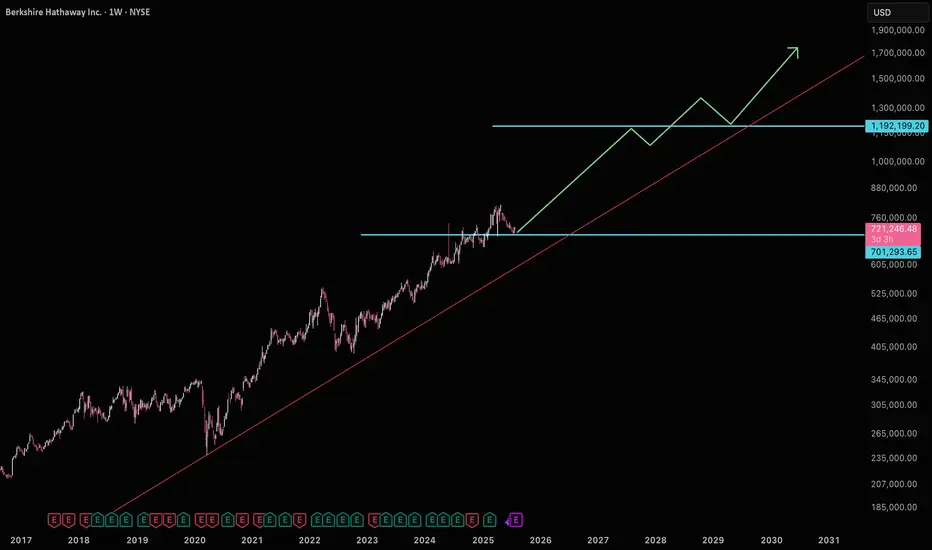
BRK.A on it's way to $1.2mm sitting on strong supportBerkshire is not far off it's long term trend sitting near major support. It's poised to start it's move to $1.2mm where next resistance is. Good luck!
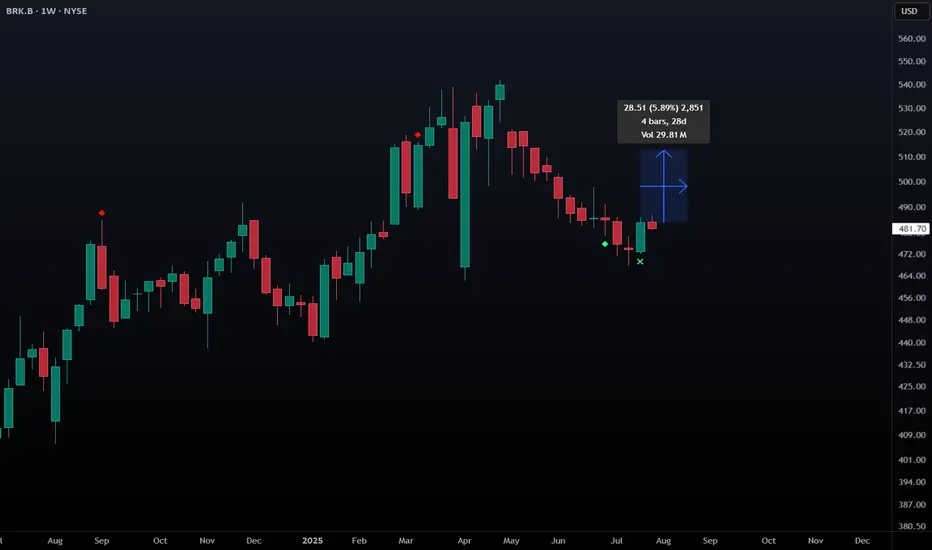
BRK.B - L2 Bullish Weekly Exhaustion SignalNYSE:BRK.B NYSE:BRK.A has triggered a level 2 bullish exhaustion signal on the weekly. This signal has triggered just 3 times in the stock's history with a 100% win rate and avg move of 5.89% over the following 5 candles.
Berkshire is losing the Buffet's premiumTechnical Overview
Looking at the current NYSE:BRK.A chart, several signals suggest a potential shift from the prior bullish trend:
Channel Break : Price has broken down from a long-standing ascending channel, which often marks the end of an uptrend and the start of a consolidation or a bearish phase.
Possible Pullback: After the channel break, the chart highlights a likely pullback toward the broken support, now turned resistance. If BRK.A fails to retake this area, downside follow-through becomes probable.
Targets Identified:
Target 1: Around 655,000 USD, supported by a significant volume cluster.
Target 2: Near 615,000 USD, another high-volume historical support.
Target 3: Around 545,000 USD, marking a deeper retracement in case of extended weakness.
Invalidation: If price strongly reclaims the prior channel and breaks above the highlighted red resistance, the bearish idea should be reconsidered.
Fundamental Arguments
Berkshire’s largest holdings, particularly in tech, are sensitive to market corrections, especially in a rising rate environment, which can weigh on valuation multiples.
Growth in net earnings has moderated, with key segments (insurance, railroad, and energy) facing headwinds or margin pressures.
Diminishing Buyback Impact: With shares previously at all-time highs, Berkshire’s ability to use buybacks as strong downside support is reduced if valuation stays elevated or fundamentals drift.
Trade Setup
Entry Idea: Look for opportunities to go short or trade sideways after a failed retest of the broken channel, as seen on the chart.
Profit Targets: Use the volume-based support zones at 655,000, 615,000, and 545,000 USD.
Stop Loss: A convincing break back into the channel and above local resistance invalidates the setup.
This gives us opportunities to risk around 3 to 4% and earn more than 9%. A great Risk Reward ratio.
Laste note about channels
Trading after a channel break can offer strong open risk/reward setups, especially if fundamental forces align with the technical picture. While Berkshire Hathaway remains a resilient company, markets can enter periods of consolidation or pullback even for top-tier stocks. Always mix technical observation with a view on macro and company fundamentals for improved decision-making.
💬 Does this setup align with your view on BRK?
🚀 Hit the rocket if this helped you spot the opportunity and follow for more clean, educational trade ideas!

Bershire Hathaway Stock Analysis/BRK.AI looked at this particular stock because of insane activity from $623,302 to $741,590 in one day. That rejection told me to pay attention Money was coming to the door. So if the market is approaching this area again, rejection is the likely response. Looking at a short is temporary. This market is bullish in nature.

What's the deal with BRK.B?! Where is the short term bottom?I'm pretty new to this, so I'm looking to see if anyone has any thoughts about BRK.B. The best looking support is the April low, but it seems like it could fall below to the Jan 2025 low with the way it is steadily dropping. That would suck! I'm averaged at $491 and prefer not to see it go that low, but I will be holding very long-term anyway.
Any thoughts on a bottom? They hold 300+ billion in cash, so surely they'll figure out what to do with it soon. *Fingers crossed*

BERKSHIRE BOTTOM IS INNYSE:BRK.B chopsticks are getting tight...
Do you see what I see?
The overhead gap at $535 wants to be filled.
Currently at $485.
$50 move incoming.
Do NOT fade Uncle Warren.
- READ THE CHARTS 7/5/2025

Berkshire Hathaway: Time to consider exitsHello,
Despite recent market volatility, Berkshire Hathaway (BRK.A, BRK.B) has demonstrated resilience, with its stock rising approximately 16% year-to-date in 2025, significantly outperforming the S&P 500’s 2% decline. This performance has fueled speculation about Warren Buffett’s strategy, particularly whether the “Oracle of Omaha” is capitalizing on the recent market correction to deploy Berkshire’s record $334 billion cash reserve. Let’s examine Berkshire’s current position
Berkshire Hathaway operates a diversified portfolio anchored by its world-class insurance operations, including GEICO. The company also owns Burlington Northern Santa Fe Railroad, a robust energy division, and a wide range of manufacturing, service, and retail businesses. Its $284 billion equity portfolio, featuring long-term holdings like Coca-Cola, American Express, and a reduced but still significant stake in Apple, continues to generate substantial investment income. In 2024, Berkshire reported approximately $30 billion in operating cash flow, underscoring its financial fortress status.
This diversified revenue stream and immense liquidity position Berkshire as a safe haven for investors during turbulent times. Buffett’s reputation for capitalizing on market downturns—evidenced by his $26 billion in deals during the 2008-2009 financial crisis—further bolsters confidence in the company’s ability to navigate corrections.
Recent market corrections, driven by concerns over President Donald Trump’s tariff policies and fears of a global trade war, have seen the S&P 500 drop over 11% from its February 2025 high. Many investors are watching Buffett, expecting him to deploy Berkshire’s massive cash pile to scoop up undervalued assets, as he famously advises to “be greedy when others are fearful.” However, evidence suggests Buffett has been cautious.
In 2024, Berkshire was a net seller of equities for nine consecutive quarters, offloading $134 billion in stocks, including significant reductions in its Apple (67% cut) and Bank of America (34% cut) holdings. Buffett also halted Berkshire’s stock buyback program in the third and fourth quarters of 2024, despite having repurchased $77.8 billion of its own stock since 2018. This pause, combined with a record cash hoard of $334 billion, indicates Buffett may believe valuations remain elevated or that greater opportunities lie ahead.
That said, Buffett has made selective purchases. In Q4 2024, Berkshire initiated new positions in Constellation Brands, Pool Corporation, Domino’s Pizza, Occidental Petroleum, VeriSign, and Sirius XM, with investments like VeriSign ($73 million) and Constellation Brands ($1.24 billion) reflecting Buffett’s preference for companies with strong fundamentals and competitive moats. These moves suggest Buffett is cautiously optimistic about specific sectors, particularly those tied to consumer spending and stable cash flows, but is not yet aggressively buying the broader market dip.
Berkshire’s stock has delivered a compounded annual return of 19.9% since 1965, nearly doubling the S&P 500’s performance over the same period. However, with a market capitalization exceeding $1 trillion and a price-to-sales ratio of 2.67 (a 34% premium to its 10-year average), significant near-term upside may be limited. The conglomerate’s size makes it challenging to find needle-moving investments, and Buffett’s recent restraint in buybacks suggests he views Berkshire’s stock as fully valued at current levels.
For long-term investors, Berkshire remains a compelling hold due to its diversified business model, strong cash flow, and Buffett’s disciplined capital allocation, now transitioning to designated successor Greg Abel. However, those expecting rapid gains should temper expectations, as Berkshire’s scale limits its ability to achieve exponential growth. Investors seeking to emulate Buffett’s strategy might consider his recent picks, such as VeriSign, which benefits from a near-monopoly in internet domain registries, or stalwarts like Coca-Cola, a Dividend King with a 3% yield.
For those considering new positions, waiting for a deeper market pullback could align with Buffett’s value investing principles, especially given his current cash-hoarding stance.

Long Berkshire HathawayThe chart shows a bullish trend as the price action bounces off the 0.618 Fibonacci retracement level and finds strong support at the MA200 (red line). The presence of an XABCD harmonic pattern further reinforces the potential for continued upward momentum.

Berkshire Bounce ImminentNYSE:BRK.B Ready To Bounce!
- Breakout and now retesting descending wedge
- Overnight gap up from June 23rd to 24th was filled today
- Retesting top band of 200ema cloud
Targets:
- 3% to 50ma
- 10% to gap fill at $535
If you take anything away from this post, remember this:
Do NOT fade Uncle Warren.
We will go long equity tomorrow at the open. This is your advance notice.
-READ THE CHARTS 6/25/25

BRK.B Long The stock has been trading within a defined channel for nearly five years, suggesting it may be approaching a pivotal bottom. If this turns out to be the case, we could have the opportunity to acquire additional shares of this outstanding company at more attractive prices. It's crucial to stay vigilant and monitor any developments related to this stock, as market conditions can change rapidly. By keeping a close watch on the company's performance and any news that may impact its valuation, we can capitalize on potential buying opportunities that arise. Investing in a fundamentally strong company at lower price points could significantly benefit our long-term investment strategy.