To The Moon! - $C What's Up Traders!
What do ya'll think about this setup?
This setup is great to me, first you have the channel up to the bullish wedge
The super tight consolidation makes me believe that price is ready to explode to the upside
The 200sma coming up underneath price is a good support to hold it up
Citigroup Inc. Shs Cert Deposito Arg Repr 1/3 Sh
No trades
2,900 ARS
17.60 T ARS
210.67 T ARS
About Citigroup, Inc.
Sector
Industry
CEO
Jane Nind Fraser
Website
Headquarters
New York
Founded
1812
IPO date
Oct 30, 1986
Identifiers
2
ISIN ARDEUT110426
Citigroup Inc. (Citi) is a financial services holding company. The Company's whose businesses provide consumers, corporations, governments and institutions with a range of financial products and services, including consumer banking and credit, corporate and investment banking, securities brokerage, trade and securities services and wealth management. The Company operates through two segments: Citicorp and Citi Holdings. Citicorp is the Company's global bank for consumers and businesses and represents its core franchises. Citicorp is focused on providing products and services to customers and leveraging the Company's global network, including various economies. As of December 31, 2016, Citicorp was present in 97 countries and jurisdictions, and offered services in over 160 countries and jurisdictions. Global Consumer Banking (GCB) provides traditional banking services to retail customers through retail banking, including Citi-branded cards and Citi retail services.
Related stocks

Citigroup sets up for a short-term rebound above $113:Current Price: 113.59 (Analysis was generated on Monday Morning)
Direction: LONG
Confidence level: 52%(Signals are mixed and volume is light, but price is holding a key area and uncertainty defaults to a bullish bias)
Targets
Target 1: 116.20
Target 2: 118.90
Stop Levels
Stop 1: 111.80
Stop 2: 1

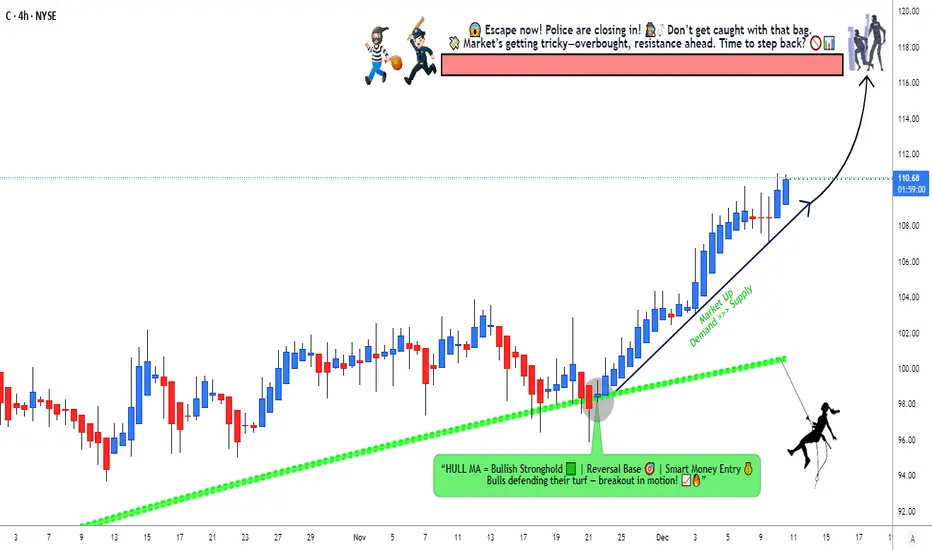
Citigroup (C) Bullish Continuation via HULL MA Pullback🚀 CITIGROUP LAYERED ENTRY PLAYBOOK: THE THIEF STRATEGY 💰
NYSE: C | Bullish Swing Trade Setup | Hull Moving Average Pullback Activation
📊 SETUP OVERVIEW 🎯
The banking titan Citigroup is setting up a beautiful bullish retracement opportunity! After a commanding rally pushing price action into overbou

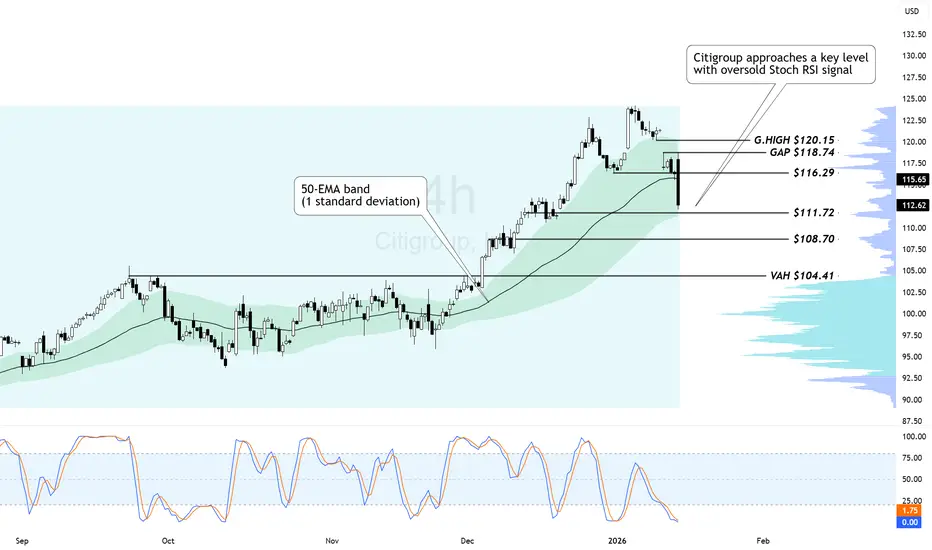
Citigroup Nears Critical Support at $111.72Citigroup missed revenue expectations this quarter, echoing the same top-line weakness seen at Wells Fargo.
When combined with JPMorgan’s EPS and revenue miss, the message is becoming clearer: growth is slowing for US banks, and profitability is being defended through cost controls rather than expa
Bought Long Calls for C before earnings.C has been on a very beautiful bullish trend and looking to capture some profits before earnings.
Very short term bullish trade for C.
Bought 120 Calls for short term bullish move
Looking to close trade before earnings report.

Katy AI Predicts Massive C Rally! Don’t Miss the Pre-Earnings C Earnings Signal | 2026-01-13
📊 TRADE DETAILS 📊
🎯 Instrument: C
🔀 Direction: CALL (LONG)
🎯 Strike: 117.00
💵 Entry Price: 2.13
🎯 Profit Target: 3.20
🛑 Stop Loss: 1.28
📅 Expiry: 2026-01-16
📏 Size: 3.5
📈 Confidence: 75%
⏰ Entry Timing: N/A
🕒 Signal Time: 2026-01-13 13:44:20 EST
🎯 TRADE RECOMMENDATION

Citigroup Trend Continuation Setup Powered by Hull MA Signal🏦💰 CITIGROUP ($C) - The Bank Heist Setup | Hull MA Pullback Confirmed 🎯
📊 CURRENT MARKET DATA (Real-Time Feed: Dec 10, 2025)
💵 Current Price: $109.26 USD
📈 Day Change: +$0.34 (+0.31%)
🔥 52-Week Range: $55.51 - $109.37
🎯 Analyst Target: $114.29 (High: $134 | Low: $90)
📊 Market Cap: $194.82B
💎 Divide
Citigroup Clears Regulatory Hurdle as Stock Breaks HigherCitigroup Inc. (NYSE: C) has cleared another important regulatory milestone, reinforcing its long-running turnaround narrative. U.S. regulators have withdrawn a 2024 amendment tied to a 2020 consent order, easing part of the oversight burden linked to Citi’s historical risk and compliance failures.
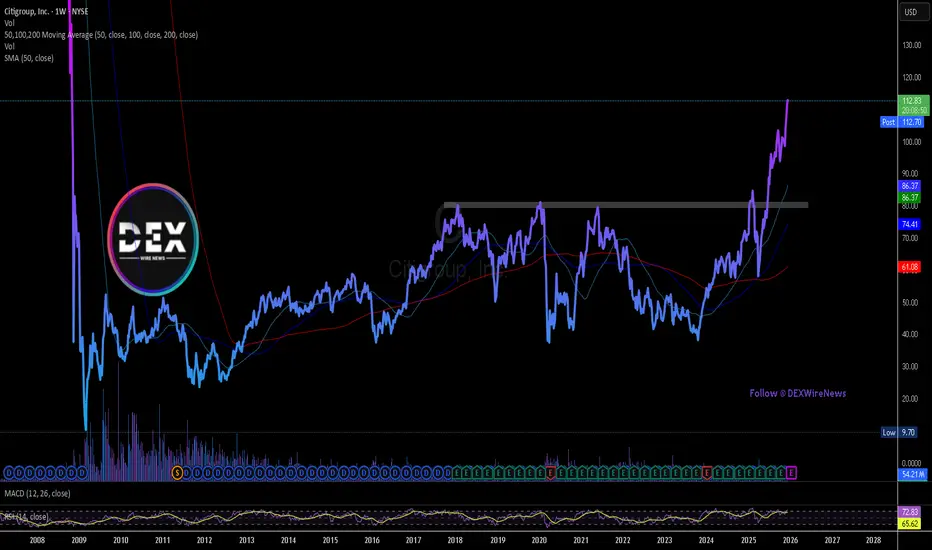
Citigroup Breaks Out of a Symmetrical Triangle1. Technical Analysis
Citigroup entered a symmetrical triangle consolidation after a strong bullish rally.
This pattern often acts as a continuation structure, especially after a steep uptrend.
Key technical observations:
• A clean breakout above the triangle
• Strong bullish candle with momentu

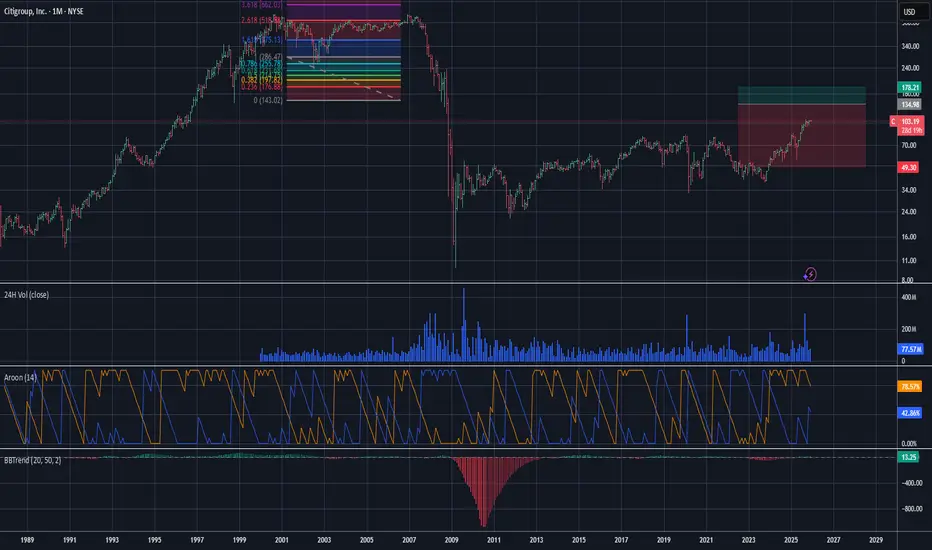
Citigroup Short - $88 TargetThe support curve seems to be breaking again for Citigroup in similar pattern as it has had for nearly 14 years. If the curve doesn't allow for a continued uptrend, in which volume seems to be low, then it could end up retracing back down to $88. As always, none of this is investment or financial ad
See all ideas
Summarizing what the indicators are suggesting.
Oscillators
Neutral
SellBuy
Strong sellStrong buy
Strong sellSellNeutralBuyStrong buy
Oscillators
Neutral
SellBuy
Strong sellStrong buy
Strong sellSellNeutralBuyStrong buy
Summary
Neutral
SellBuy
Strong sellStrong buy
Strong sellSellNeutralBuyStrong buy
Summary
Neutral
SellBuy
Strong sellStrong buy
Strong sellSellNeutralBuyStrong buy
Summary
Neutral
SellBuy
Strong sellStrong buy
Strong sellSellNeutralBuyStrong buy
Moving Averages
Neutral
SellBuy
Strong sellStrong buy
Strong sellSellNeutralBuyStrong buy
Moving Averages
Neutral
SellBuy
Strong sellStrong buy
Strong sellSellNeutralBuyStrong buy
Displays a symbol's price movements over previous years to identify recurring trends.
C
C4368290
Citigroup Global Markets Holdings Inc. 0.0% 29-MAY-2026Yield to maturity
377.33%
Maturity date
May 29, 2026
C
KG6NK0
Citigroup Global Markets Funding Luxembourg SCA 3.04% 13-FEB-2026Yield to maturity
169.04%
Maturity date
Feb 13, 2026
C
XS1574962046
Citigroup Global Markets Funding Luxembourg SCA 0.0% 12-MAY-2027Yield to maturity
94.91%
Maturity date
May 12, 2027
C
C5380865
Citigroup Global Markets Holdings Inc. 0.0% 04-APR-2029Yield to maturity
86.85%
Maturity date
Apr 4, 2029
C
C5334020
Citigroup Global Markets Holdings Inc. 0.0% 12-JAN-2032Yield to maturity
38.62%
Maturity date
Jan 12, 2032
C
KE3C1X
Citigroup Global Markets Funding Luxembourg SCA 2.1% 22-FEB-2026Yield to maturity
33.94%
Maturity date
Feb 22, 2026
C
XS1574931751
Citigroup Global Markets Holdings Inc. 0.0% 26-OCT-2027Yield to maturity
32.17%
Maturity date
Oct 26, 2027
C
KJ5DDG
Citigroup Global Markets Funding Luxembourg SCA 2.6% 28-FEB-2026Yield to maturity
24.28%
Maturity date
Feb 28, 2026
C
XS2907338128
Citigroup Global Markets Funding Luxembourg SCA 0.0% 02-NOV-2026Yield to maturity
21.37%
Maturity date
Nov 2, 2026
C
XS3045697862
Citigroup Global Markets Holdings Inc. 17.0% 06-MAY-2026Yield to maturity
17.94%
Maturity date
May 6, 2026
See all C bonds