$CAT Tradespoon – Long Setup $563.55Tradespoon model signals a long bias for NYSE:CAT . Predicted range: $555.07–$592.57. Trend: +0.56%. NYSE:CAT
Trade ideas

CAT watch $586-591: Dual Fib resistance that may give a DIP buyCAT got a nice boost from latest earnings report.
It spiked into a Dual Fib zone at $586.82-591.90
Look for a Break-n-Retest or Dip-to-Fib to buy.

CAT: Short Case Trade Plan (Scaled Entry)A short case based on fundamentals would argue that the stock's recent rapid ascent has led to overvaluation and that macro-risks are being ignored:
Valuation Concerns: The stock recently reached an all-time high of $509.50. Despite the enthusiasm, some valuation models suggest CAT is overvalued, with a fair value estimate below the current market price.
As of a recent date, the average 12-month analyst price target of $501.47 represented a slight downside from the current stock price.
Deteriorating Earnings/Margins:
Tariff Headwinds: Caterpillar has faced significant tariff-related expenses, which were previously forecasted to be as high as $1.5 billion to $1.8 billion for the year. Tariffs continue to negatively impact operating profit.
Profit Decline: Second-quarter 2025 adjusted profit per share of $4.72 was a significant decrease compared to $5.99 in the second quarter of 2024. Second-quarter operating profit was also down 18% year-over-year.
Cyclical and Macro Risks: The company is heavily reliant on cyclical markets like construction and mining, making its revenue vulnerable to a global slowdown.
A prolonged downturn in the EAME (Europe, Africa, Middle East) construction sector has already been cited as a negative factor.
Insider Selling: There has been significant insider selling over the past three months, including sales of millions of dollars of stock by executives.
Increased Debt Level: The company has a high level of debt, which could pose risks during an economic downturn.
Trade Idea:
Entry 1 (First Resistance): Short an initial amount at $535.28.
Entry 2 (Second Resistance/Channel Top): Short an additional amount at $551.69.
Take Profit (Exit): Close the entire short position at $518.81.

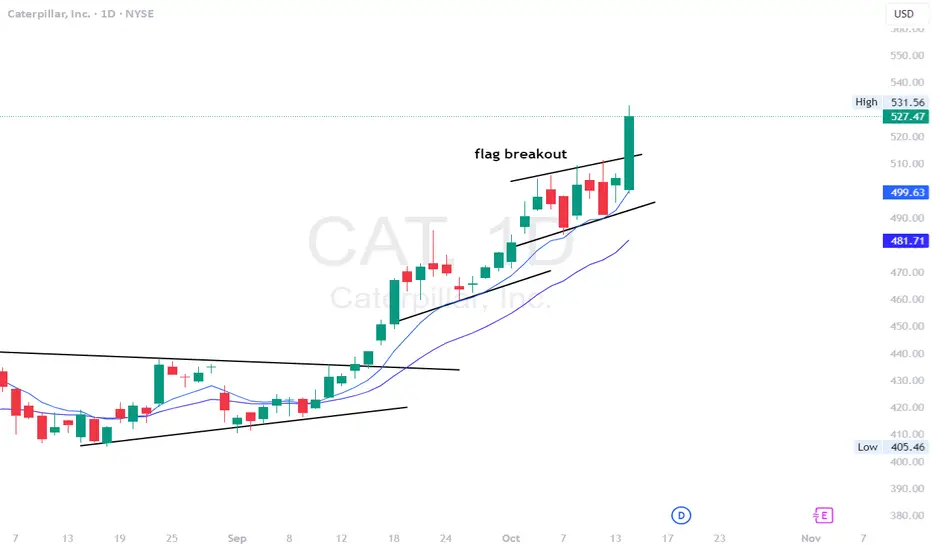
CAT - Stock breaking out of the flag on the daily time frame.CAT - Stock breaking out of the flag on the daily time frame and hitting new highs. Stock has next resistance at $530 . looking for calls above that for a move towards $550 and higher. Stock making a strong move today.
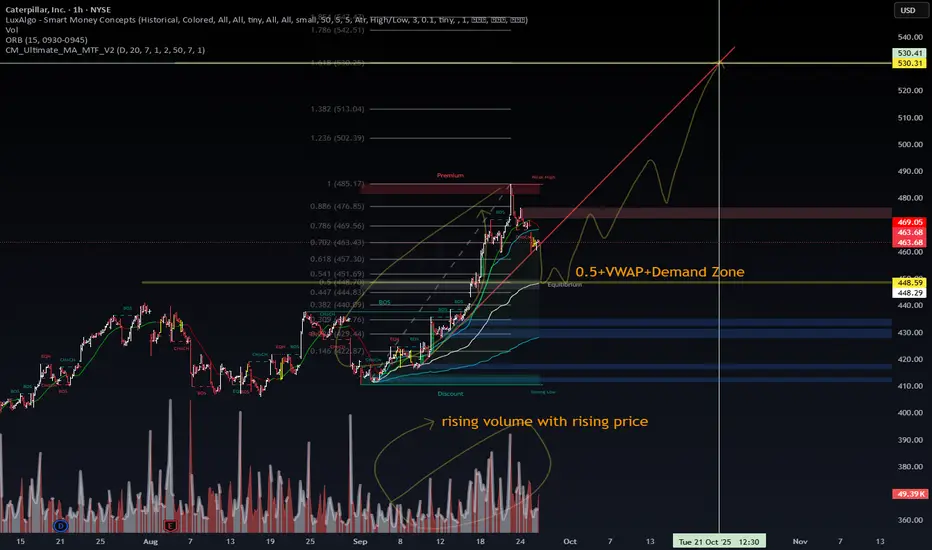
$CAT Trade Plan | WaverVanir DSS📊 NYSE:CAT Trade Plan | WaverVanir DSS
Rising structure intact with strong volume confirmation. Price is retracing into the 0.5 + VWAP + Demand Zone (~448–455), which aligns with equilibrium and offers a potential high-probability re-entry.
Bias: Bullish continuation
Key Demand Zone: 448–455
Targets: 474 (short-term), 503 / 530 (swing)
Invalidation: Close below 443 → deeper discount zones open
Confluence: Rising volume, VWAP support, Fibonacci structure, institutional DSS forecast aligning with +2.2% near-term upside and ~16% 30-day projection.
🔑 Trade Idea: Look for confirmation inside demand zone → scale into long positions targeting 474+ with partial profit-taking at key Fib levels.
Risk management is key — protect capital first.
#CAT #VolanX #SmartMoneyConcepts #Trading
Why is the Stock Market UP when the Government is shut down?The stock market has been trending upward via the indexes as representative of the overall stock market. The Government of the US has been shut down for over a week, but stocks, especially big blue chip stocks keep moving upward. WHY?
Is it Wall Street vs Main Street? No.
Is it because the "economy is unstoppable? No.
Is it because of tariffs? and all that money going to the government? No.
So what is driving big name companies upward when the market should be crashing because of the shut down as stock market has ALWAYS DONE in the past any time the ceiling budget increase fails in Congress?
Corporations, with the huge tax cuts this year, and with AI providing significant lower overhead costs, and payroll costs, are in a massive buyback program once again, as they were in 2018 and 2019.
Buybacks are intended to move price of a stock upward and or maintain a price that the corporation has targeted for their buybacks.
The Bank of Record for the corporation does the actual physical work of buying shares of a company back to return the ownership of those shares to the corporation. This boost dividends which keep the Buy Side Institutions, who hold the majority of shares of many corporations, from lowering inventory for that stock. Buy Side Institutions are the most important investors for every corporation. Keep the Buy Side Institutions content with how the company is being managed is a key element of maintaining a high Percentage of Shares held by Institutions which is the primary goal of every corporation. Corporations focus on keeping shareholders holding their stock is not about the average small lot investor. It is all about keeping the Buy Side Institutions pleased with the price of the stock during extreme stress to the market. This is very important information as it tells you WHO CONTROLS PRICE and that tells you when to enter a stock, how to trade that stock, what strategies will work best for your trading style, and when and how to exit to close the trade at the ideal profit taking price level.

CAT Technical Outlook – Testing Major Resistance📊 CAT Technical Outlook – Testing Major Resistance
Ticker: CAT (Caterpillar Inc.)
Timeframe: 30-minute candles
🔍 Current Setup
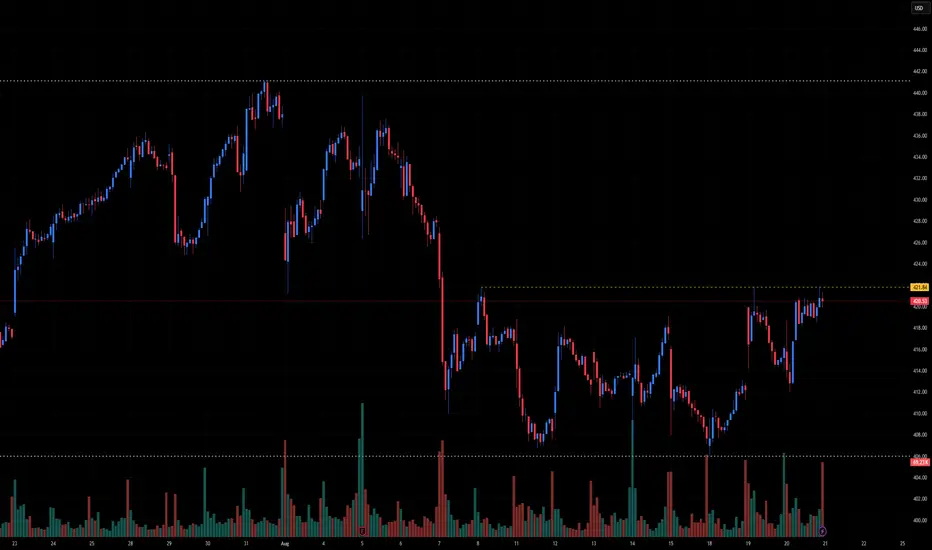
CAT has been in a sideways consolidation after its sharp August drop. Price action has formed a range with clear resistance near 421.80 and support near 406.00.
At present, CAT is testing resistance at 421.80, a level that has repeatedly capped rallies. A breakout here could trigger a stronger move higher, while rejection may send price back into the consolidation zone.
📊 Breakout Levels
🚀 Upside (Bullish Scenario)
Trigger: Break and close above 421.80 with volume.
Intermediate Targets:
428.00–430.00 → Prior supply zone.
436.00–438.00 → Strong resistance cluster.
Measured Move Target: ~442.00 (equal to consolidation height projection).
🔻 Downside (Bearish Scenario)
Trigger: Rejection and drop below 414.00, then break under 406.00.
Intermediate Supports:
410.00–408.00 → Mid-range support.
406.00 → Range base.
Measured Move Target: ~400.00 (full range breakdown).
📈 Volume Analysis
Recent candles show volume spikes on rallies, suggesting active buyers.
However, resistance at 421.80 has yet to break convincingly.
A volume-backed breakout could lead to a swift rally, while failure here may attract sellers back toward 406 support.
⚖️ Probability Bias
Bulls are pressing resistance, but CAT needs a decisive close >421.80 to confirm upside.
Until then, it remains in a range-bound market between 421.80 and 406.
Breakout direction will set the tone for the next major move.
✅ Takeaway
CAT is at a make-or-break resistance zone:
Bullish Break > 421.80: Targets 428 → 436 → 442
Bearish Failure < 414 → 406: Targets 410 → 406 → 400
Keep a close eye on volume — it will validate whether CAT escapes its range or remains stuck in consolidation.
CAT TRADE IDEA – HEAVY EQUIPMENT, HEAVY POTENTIAL 📈🏗️🐾Sector: Industrials – Construction & Machinery
When the giants sleep, we prepare. And when they wake, we ride the momentum.
Caterpillar has been consolidating, and the recent pullback opens the door for a high-conviction setup. I'm looking to build my position in 3 strategic zones — scaling in with patience, letting the market give me the setup on my terms.
🟢 Entry Plan (Scaling In):
⚙️270 – First nibble as it approaches key structural support
⚙️250 – Historical support level and psychological round number
⚙️215 – Panic zone entry — if it hits here, it's a gift 🧨
🎯 Profit Targets:
320 – Swing back to resistance; first trim zone
370 – Momentum continuation with strong industrial tailwinds
400 – Full send 🚀 Long-term target if infrastructure demand and global growth trends align
🛡️ Risk Strategy:
Staggered entries allow for cost basis control
Adjust position sizing based on entry zone reached
💡 Why CAT?
Caterpillar’s fundamentals remain strong with global infrastructure spending on the rise, and the stock is approaching historical discount levels. This setup is about anticipating the bounce, not chasing it. Plan the trade, trade the plan.
📢 DISCLAIMER:
This is not financial advice. I'm sharing my personal trade plan for educational purposes only. Always do your own research and consult a licensed financial advisor before making any investment decisions. Trading involves real risk — respect it.

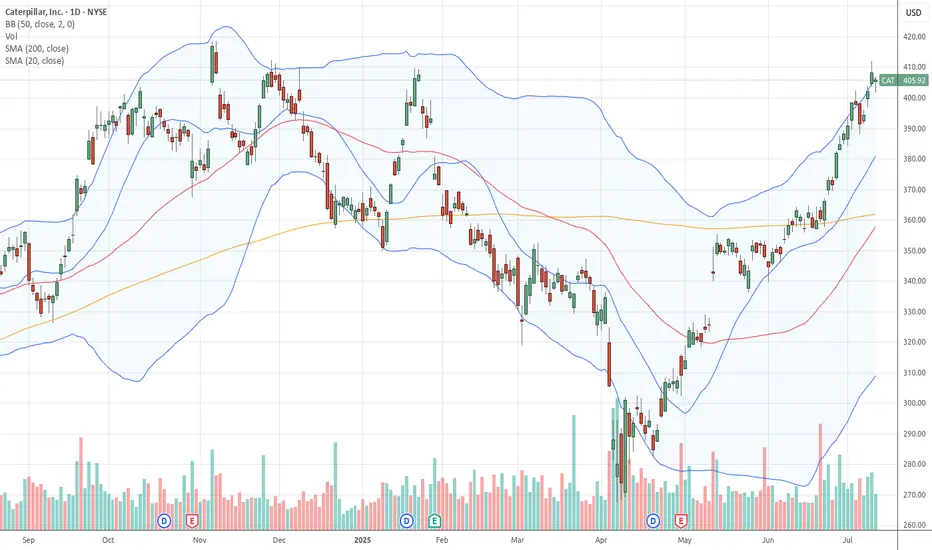
Caterpillar Pulls BackCaterpillar rallied to a new high in late July, and now it’s pulled back.
The first pattern on today’s chart is $407.63, a record weekly closing price from January. It briefly thwarted the industrial stock’s advance in early July. Prices pushed above it and are now coming back to test the same level. Is old resistance becoming new support?
Second, the 50-day simple moving average (SMA) had a “golden cross” above the 200-day SMA last month. That may reflect a bullish long-term trend.
Third, stochastics have dipped to an oversold condition.
TradeStation has, for decades, advanced the trading industry, providing access to stocks, options and futures. If you're born to trade, we could be for you. See our Overview for more.
Past performance, whether actual or indicated by historical tests of strategies, is no guarantee of future performance or success. There is a possibility that you may sustain a loss equal to or greater than your entire investment regardless of which asset class you trade (equities, options or futures); therefore, you should not invest or risk money that you cannot afford to lose. Online trading is not suitable for all investors. View the document titled Characteristics and Risks of Standardized Options at www.TradeStation.com . Before trading any asset class, customers must read the relevant risk disclosure statements on www.TradeStation.com . System access and trade placement and execution may be delayed or fail due to market volatility and volume, quote delays, system and software errors, Internet traffic, outages and other factors.
Securities and futures trading is offered to self-directed customers by TradeStation Securities, Inc., a broker-dealer registered with the Securities and Exchange Commission and a futures commission merchant licensed with the Commodity Futures Trading Commission). TradeStation Securities is a member of the Financial Industry Regulatory Authority, the National Futures Association, and a number of exchanges.
TradeStation Securities, Inc. and TradeStation Technologies, Inc. are each wholly owned subsidiaries of TradeStation Group, Inc., both operating, and providing products and services, under the TradeStation brand and trademark. When applying for, or purchasing, accounts, subscriptions, products and services, it is important that you know which company you will be dealing with. Visit www.TradeStation.com for further important information explaining what this means.

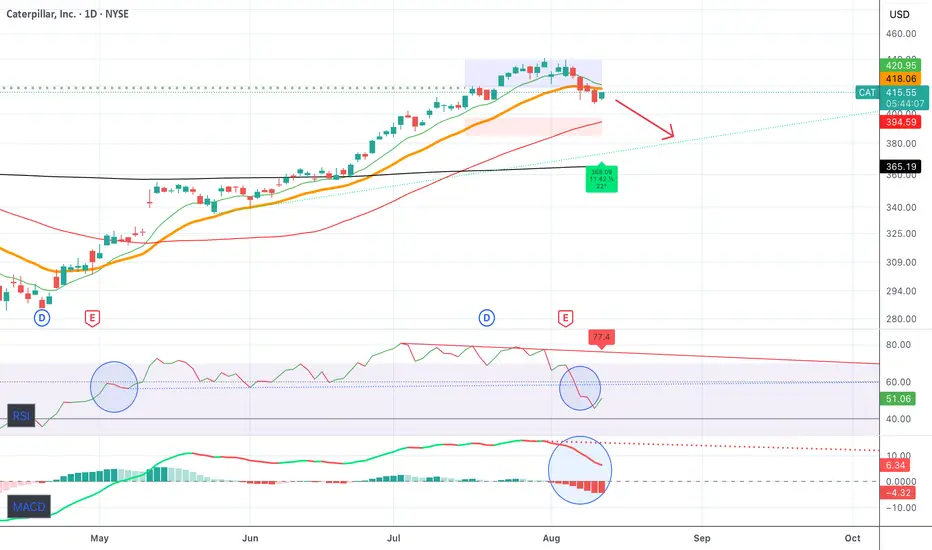
$CAT run is stallingA close below the 21 EMA followed by a crazy bullish run makes me bearish on NYSE:CAT for the next few weeks.
MACD falling fast and RSI broke below 50 which in my opinion signals a reversal.
$CAT Tradespoon – Long Entry $435.77Tradespoon model generated long signal for NYSE:CAT . Predicted range: $435.77–$440.83. Trend: +0.25%. NYSE:CAT

CAT watch $308 above 302 below: Major fibs define range to breakCAT just released Earnings report with small "miss".
Price oscillating between major fibs $301.97-308.82
If Bull, look for a pop to tight zone $325.49-326.16

Angle of Ascent: what it means, how to use it.Angle of Ascent is a visual pattern that forms on a chart when stocks are running with momentum or velocity. Drawing a line along an up trending price action helps you see the Angle of ascent. Also Chaikins Osc and EMA MFI indicators are extremely helpful in warning a day ahead of time that the Angle of Ascent is too steep to sustain.
This is an exit signal for profit taking at or near the highest high of a swing style run.
Angle of Ascent is also used on Weekly Charts to determine how far a stock can run before resistance from previous highs will stall that stock and cause a minor to intermediate correction.
Recognizing when an angle of ascent has become too steep to sustain and using these indicators will help you hold a swing run but also help you exit before a retracement or correction starts.
The professional side of the market uses penny spreads, millisecond routing to the ques of the market, and can easily front run retail traders orders.
Reminder: retail brokers are required to light your order before sending to the PFOF Payment for Order Flow Market Maker of their choice.
The Digital Stock Market moves at a much faster pace with subtle nuances such as Angle of Ascent. As you become an advanced level trader to a semi-professional trader, or potentially a full time professional trader, these details matter more than when you are just learning stock trading.
Trade Wisely
Martha Stokes CMT

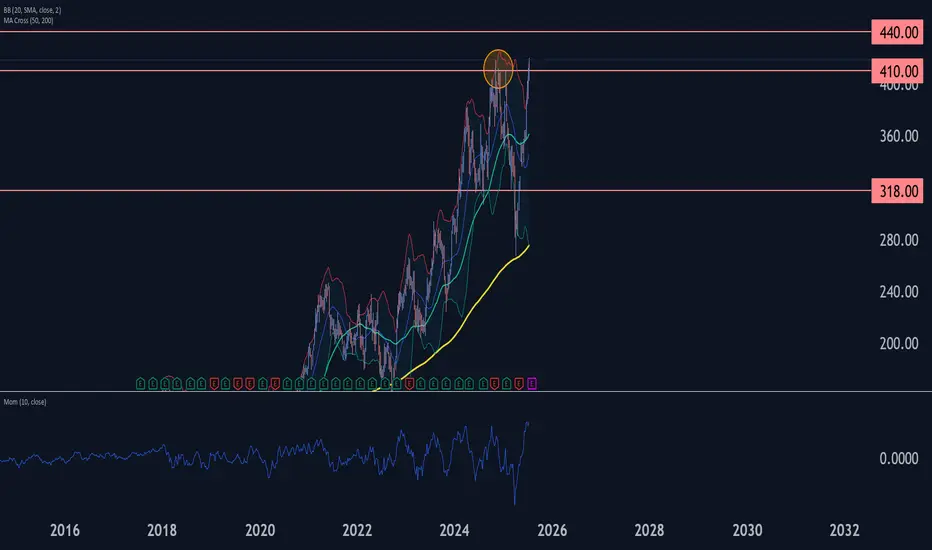
Caterpillar Wave Analysis – 17 July 2025
- Caterpillar broke long-term resistance level 410.00
- Likely to rise to resistance level 440.00
Caterpillar recently broke above the major long-term resistance level 410.00, which has been reversing the price from the end of 2024, as can be seen from the weekly Caterpillar chart below.
The breakout of the resistance level 410.00 accelerated the active intermediate impulse wave (C) from the middle of 2025.
Given the overriding weekly uptrend and the accelerating weekly Momentum, Caterpillar can be expected to rise to the next resistance level 440.00 (target for the completion of the active intermediate impulse wave (C)).
$CAT Tradespoon – Long Entry $404.54Tradespoon model generated long signal for NYSE:CAT . Predicted range: $404.54–$412.44. Trend: +0.38%. NYSE:CAT
Caterpillar: Countertrend ActionCaterpillar’s green wave has further room to run. However, this rise represents only an internal countertrend – the broader correction in beige wave IV is still ongoing. Under our primary scenario, we expect the price to form another low before launching into a sustained advance, which should ultimately push above resistance at $409.40. Meanwhile, our alternative scenario—carrying a 38% probability—suggests that beige wave alt.IV has already bottomed. If that’s the case, the correction is complete, and a direct breakout above $409.40 could follow.
📈 Over 190 precise analyses, clear entry points, and defined Target Zones - that's what we do.

CAT Weekly Bullish Trend is startingThe presence of a harmonic pattern alongside a positive divergence and an important support level can be a good indication of the start of an uptrend in Caterpillar.


Caterpillar: Progress!Caterpillar has successfully fallen below the $318.68 level, marking an important step in our primary scenario. There is a 32% probability that we have already seen the low of wave alt.IV in beige, which would allow the price to move directly above the resistance at $386.48 from here. However, due to the price structure, we assume that the regular wave IV in beige still requires a new low before the next rise is scheduled. Once this important bottom of wave IV is found, there is ample potential on the upside.

CAT looks bearish hereAs said in the title and shown in the chart, breaking down out of a rising wedge usually ends in a correction. So to keep things easy, for now I'm looking at a correction based on a simple Fib level.

Caterpillar Wave Analysis – 2 April 2025
- Caterpillar reversed from the support area
- Likely to rise to the resistance level 350.00
Caterpillar recently reversed up from the support area between the key support level 318.00 (which has been reversing the price from the start of 2024), lower weekly Bollinger Band and the 50% Fibonacci correction of the upward impulse from August.
The upward reversal from this support area stopped the earlier impulse wave C of the weekly ABC correction (4) from last year.
Given the clear weekly uptrend, Caterpillar can be expected to rise to the next resistance level 350.00.

CAT eyes on $325: semi-major Support that could paint a bottom CAT has been in a waterfall along with the market.
Now at a semi-major support that just might hold.
$325.49-326.16 is the exact zone of concern for bulls.
===============================================
.

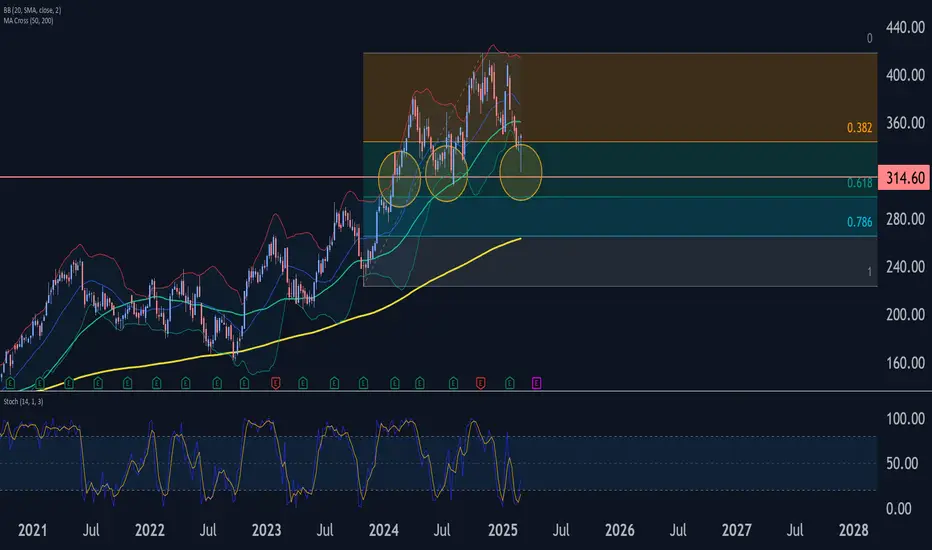
CAT Wave Analysis – 7 March 2025
- CAT reversed from the support area
- Likely to rise to the resistance level 360.00
CAT recently reversed from the powerful support area between the key support level 314.60 (which has been reversing the price from last year), lower weekly Bollinger Band and the 50% Fibonacci correction of the upward impulse from the end of 2023.
The upward reversal from this support zone is set to form the weekly Japanese candlesticks reversal pattern Hammer this week (strong buy signal for CAT).
Given the weekly daily uptrend and still oversold weekly Stochastic, CAT can be expected to rise further to the next resistance level 360.00.