COIN - Are we aligned with BTC/ETH? READY, SET, GO?🕰 Monthly View
Large bullish expansion from demand, with swing structure respected.
Pullback currently rejecting around the 0.618 retracement level.
As long as price holds above the strong support zone near 260–275, bias remains bullish for continuation.
Longer-term targets sit around 400+, with potential re-test of the all-time swing highs later.
📆 Weekly View
Weekly structure shows BOS (break of structure) after expansion.
Price has pulled back into weekly demand (≈275).
Liquidity above 360–380 remains uncollected, suggesting upside targets.
Re-test of supply/liquidity resistance trend likely before continuation higher.
📅 Daily View
Current price hovering around 304 key psychological level (POI).
Retesting breakout zone after liquidity sweep.
Demand alignment (280–300 zone) is crucial: bullish confirmation here opens room for targets at 386–400.
Invalidation if we close below 200 demand zone.
⏱ 4H View
Lower timeframe shows consolidation just above daily demand.
A range return setup is forming, with liquidity built for a possible expansion.
If bulls step in here, expect a sharp impulse move back toward 340–360 short-term.
🎯 Bias & Trade Plan
Bias: Bullish continuation (after retest)
Entry Zone: 280–305 (Daily/Weekly Demand)
Targets:
Short-term → 340–360
Mid-term → 386–400
Invalidation: Break and close below 200
⚠️ Risk Note
COIN tends to move with crypto sentiment (BTC/ETH correlation). Strong volatility expected around psychological levels – wait for rejection/confirmation before entry.
COINB trade ideas

COIN Don’t Miss Out: eye-catching$330C
# 🚀 COIN Options Alert 🚀
🎯 **Setup**: Long \$330C
💵 **Entry**: \$6.35 | 📈 **Target**: \$9.53 (+50%) | 🛑 **Stop**: \$3.81
📊 **Confidence**: 60% | ⚡ Low VIX + Bullish Flow | ❗ Weak volume risk
💡 **Key Watch Levels**:
* 🔑 \$325 breakout = strong bullish confirmation
* ⚠️ Below \$291 = bearish trigger zone
⏰ Time-sensitive: 4DTE — manage risk, avoid holding into Friday’s close!
---
📌 **Hashtags **:
\#COIN #CryptoStocks #OptionsTrading #WeeklyOptions #TradingSignals #StocksToWatch #OptionsFlow #CallOptions #TradingView #StockMarket #COINbase #OptionsAlerts

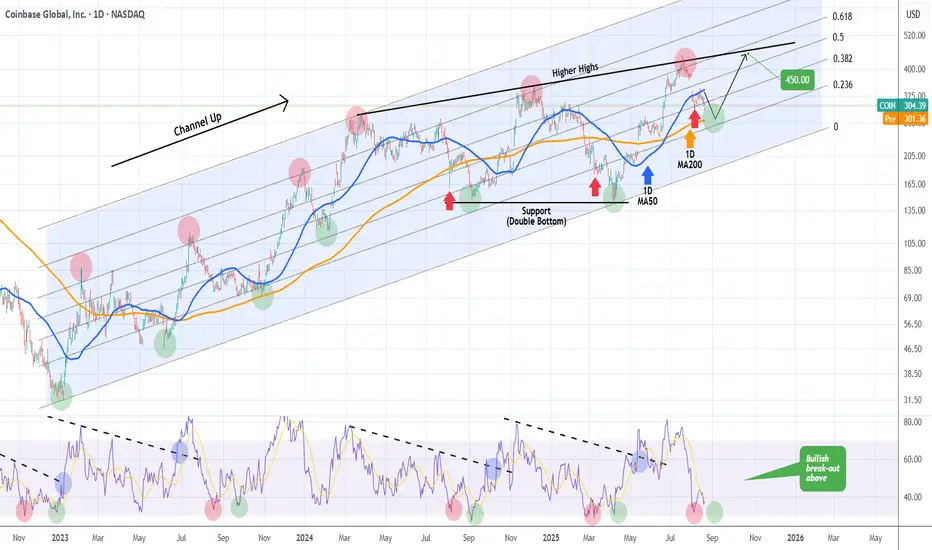
COINBASE about to issue a massive buy signal.Last time we looked at Coinbase (COIN) was more than 3 months ago (May 07, see chart below) where we gave a strong buy signal on its 1D MA50 (blue trend-line), which instantly delivered a rally that eventually hit our $400 long-term Target:
The stock has since dropped off its All Time High (ATH) and is trading right now below its 1D MA50 (blue trend-line). The 1D RSI has given perhaps the most optimal Buy Signal when it double bottoms (red and green circles).
At the moment it has made the first Low and we are anticipating the second, which might very well be on the 1D MA200 (orange trend-line). That would be the signal for maximum gains and our Target will be on the Higher Highs trend-line at $450.
-------------------------------------------------------------------------------
** Please LIKE 👍, FOLLOW ✅, SHARE 🙌 and COMMENT ✍ if you enjoy this idea! Also share your ideas and charts in the comments section below! This is best way to keep it relevant, support us, keep the content here free and allow the idea to reach as many people as possible. **
-------------------------------------------------------------------------------
💸💸💸💸💸💸
👇 👇 👇 👇 👇 👇
$COIN Local Chart, Still WaitiingNASDAQ:COIN Coinbase is still resetting towards the target of $275 quadruple support - High Volume Node, ascending 200EMA, 0.5 Fibonacci retracement & S2 pivot point.
Daily RSI is setting up with bullish divergence at the moment near oversold.
There is a gap that never filled at the golden pocket ~$217 so this would be the secondary target if we get a deeper sell off.
Safe trading.

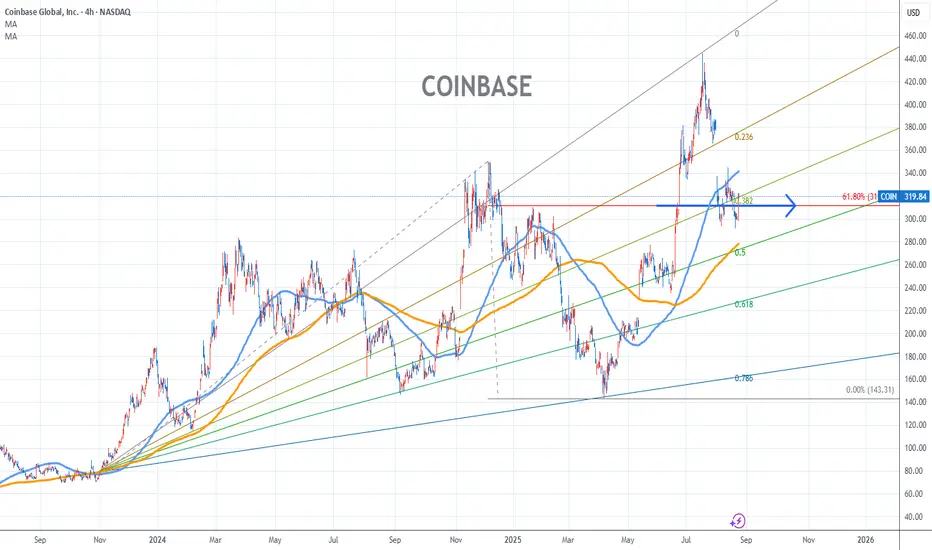
Coinbase Stock Chart Fibonacci Analysis 082225Trading Idea
1) Find a FIBO slingshot
2) Check FIBO 61.80% level
3) Entry Point > 312/61.80%
Chart time frame:B
A) 15 min(1W-3M)
B) 1 hr(3M-6M)
C) 4 hr(6M-1year)
D) 1 day(1-3years)
Stock progress:A
A) Keep rising over 61.80% resistance
B) 61.80% resistance
C) 61.80% support
D) Hit the bottom
E) Hit the top
Stocks rise as they rise from support and fall from resistance. Our goal is to find a low support point and enter. It can be referred to as buying at the pullback point. The pullback point can be found with a Fibonacci extension of 61.80%. This is a step to find entry level. 1) Find a triangle (Fibonacci Speed Fan Line) that connects the high (resistance) and low (support) points of the stock in progress, where it is continuously expressed as a Slingshot, 2) and create a Fibonacci extension level for the first rising wave from the start point of slingshot pattern.
When the current price goes over 61.80% level , that can be a good entry point, especially if the SMA 100 and 200 curves are gathered together at 61.80%, it is a very good entry point.
As a great help, tradingview provides these Fibonacci speed fan lines and extension levels with ease. So if you use the Fibonacci fan line, the extension level, and the SMA 100/200 curve well, you can find an entry point for the stock market. At least you have to enter at this low point to avoid trading failure, and if you are skilled at entering this low point, with fibonacci6180 technique, your reading skill to chart will be greatly improved.
If you want to do day trading, please set the time frame to 5 minutes or 15 minutes, and you will see many of the low point of rising stocks.
If you want to prefer long term range trading, you can set the time frame to 1 hr or 1 day
COIN - Waiting for buyers volume🔎 Weekly View
COIN is following a clear Elliott Wave structure.
Current position: Sitting in Wave (4) correction after completing a strong Wave (3) impulse.
Support Zone: Around $275–$290, aligning with the 71% retracement + prior swing range.
Projection: If support holds, Wave (5) could target the $450–$500 range.
Bias: Bullish continuation, provided Wave (4) base holds.
📉 Daily View
Pattern: Expanding wedge structure, with a corrective pullback in play.
Volume Note: "Low seller’s volume" suggests the correction might be exhaustion rather than full reversal.
Support: Price hovering near the 71% retracement zone.
Next Move: If buyers step in here, expect a strong Wave (5) extension higher.
Bias: Bullish setup forming, but confirmation needed at $300 support.
⏱ 4H Intraday View
Correction Phase: Price is grinding lower but respecting the retracement.
Liquidity Sweep: Sell-side liquidity grabbed — could set the stage for reversal.
MACD: Printing a potential bullish signal, hinting that downside pressure is fading.
Scenario: A bounce from this level could trigger the early start of Wave (5).
Bias: Reversal Watch — Signs are leaning bullish, but need follow-through.
🎯 Trade Plan (Simplified)
Buy Zone: $290–$305 (support range).
Target 1: $350 (short-term swing).
Target 2: $420–$500 (Wave 5 projection).
Invalidation: Clean break below $275 = deeper correction risk.

Coinbase (COIN) shares fall to a 2-month lowCoinbase (COIN) shares fall to a 2-month low
According to the chart of Coinbase Global (COIN), the stock price of the cryptocurrency exchange is sliding towards the $295 level, a 2-month low.
It is worth recalling that last month we reported that COIN stock had surged to an all-time high around $400. At that time, we:
→ highlighted the long-term grey channel and the short-term blue one;
→ suggested a potential correction from the upper boundary of the grey channel.
Since then, COIN’s share price has declined by more than 20% (yesterday’s drop was fuelled by a broader risk-off sentiment in technology stocks, which we analysed earlier today in the context of the Nasdaq 100 index). If this is indeed a correction from the all-time high, it looks too deep for a bull market. Could COIN shares extend their decline?
Technical analysis of Coinbase (COIN) stock
From a broader perspective, the grey channel remains valid. Following the release of a disappointing earnings report on 1 August, COIN formed a bearish gap and found support near the median of this channel.
Note the price action (highlighted with an arrow) – the bulls attempted to push the price higher but failed. This resembles either a false breakout of the 1 August high or a retest of the gap’s lower boundary – in both cases, a bearish signal. Particularly so given the candlestick with a long upper shadow, forming a gravestone doji pattern.
The MACD indicator suggests “clouds are gathering”: the histogram is approaching zero, while the two lines have turned downward. If the bears manage to build on their advantage, this would imply that:
→ market participants view the psychological $300 level as too high for COIN;
→ the price is moving away from the median of the grey channel and might approach its lower boundary, where buyers typically tend to step in.
If this scenario unfolds, the bears will need to show persistence, given the importance of support at $273.70, where the price rallied strongly in mid-June (a sign of aggressive buying).
It is also worth noting a series of bullish news related to Coinbase (completion of the Deribit exchange acquisition, improved regulatory outlook) – but the stock is already down more than 30% from its record high, which raises concerns.
This article represents the opinion of the Companies operating under the FXOpen brand only. It is not to be construed as an offer, solicitation, or recommendation with respect to products and services provided by the Companies operating under the FXOpen brand, nor is it to be considered financial advice.

Coinbase: Brief Distraction Before Downtrend ContinuesCoinbase has recently experienced a brief uptick but has since resumed its expected downward trajectory. Magenta wave still has some room to push lower in the near term, but it should remain above the support level at $138.45 to allow the upward impulse to eventually break through resistance at $444.65. However, if price falls below $138.45, we will anticipate a new low for turquoise wave alt. 2 , which would delay the expected gains (probability: 33%).

COIN- Loading Up Before the Next Crypto WaveCoinbase (COIN) is setting up for another big swing as crypto momentum keeps building. I’m looking to scale in with layered entries and ride the volatility to higher levels.
🔑 Entry zones:
First buy: $295
Second buy: $275
Deep buy: $245
🎯 Profit targets:
TP1: $330 ✅
TP2: $350 🚀
TP3: $375+ 💰
⚠️ Disclaimer: This is just my personal trading plan, not financial advice. Do your own research and manage your risk!

CoinbaseCOIN is still carving out what I am calling wave B. It is either in sub-minuette wave b, or micro-wave b. It is to early to tell for sure. I bought just 15 shares today as I want to layer into this position. I feel it makes the most sense to drop into my small target box before moving higher again but it is by no means required to do so. In the target box though, and I buy another 25-35 shares to ride higher. I don't have my stop set, but I have alarms set to alert me before it reaches that stop of $300.
Let me know if you have any questions. You can also refer to my recent daily posts on Coinbase for more detailed information.

COIN Weekly Options Crunch: Can Bulls Break Through the Trap? 🚀 COIN Weekly Options Heat Check (2025-08-14)
**Sentiment:** ⚖️ *Mixed but leaning bullish*
* **Daily RSI:** Bearish 📉
* **Weekly RSI:** Bullish 📈
* **C/P Ratio:** 1.68 (Bullish flow)
* **Volume:** Weak — limited institutional backing
* **Gamma Risk:** HIGH due to imminent expiry
---
### 📊 **Consensus Snapshot**
✅ *Bullish tilt from options flow*
⚠️ *Conflicting indicators & low volume = caution*
💡 *Tight risk management is critical*
---
### 🎯 **Trade Setup**
* **Type:** Naked CALL (Long)
* **Strike:** \$335.00
* **Expiry:** 2025-08-15
* **Entry Price:** \$0.84
* **Profit Target:** \$1.26 – \$1.68 (+50–100%)
* **Stop Loss:** \$0.50 (≈40% risk)
* **Confidence:** 65%
* **Entry Timing:** At market open
---
💬 *Play the momentum, but respect the stop — expiry is tomorrow.*
📌 *Not financial advice. DYOR.*
---
**#COIN #OptionsTrading #WeeklyAnalysis #StocksToWatch #TradingSignals #OptionsFlow #GammaRisk #DayTrading #StockMarket**

COIN eyes on $316.59: Golden Genesis fib that bulls need to HOLDCOIN has been retracing from its All Time High
Currently testing a Golden Genesis at $316.59
Looking for a bounce then a retest to enter long.
.
Previous Analysis that caught the PERFECT BREAKOUT:
Hit BOOST and FOLLOW for more such PRECISE and TIMELY charts
=========================================================
.

Long Trade Summary – COIN!🎯
Pattern: Symmetrical Triangle Breakout Setup
Entry: Around $322.54 (breakout confirmation)
Target: $333.75 (green line)
Stop Loss: $319.40 (white line)
Risk/Reward: Attractive upside with tight risk control

Are you Bullish on Coinbase?Do you think my T1 will get hit? Let me know.
I hope so, since Coinbase is a leading indicator for the crypto market.
But I wouldn't be surprised if it went lower after hitting T1

Are you bullish on Coinbase?Obviously I want Coinbase to do well, becuase it is a leading indicator for the crypto market.
But it's still a chart, like all other charts, that all do the same thing. So let's hope no further downside is necessary.

COIN - 5th Bullish WaveFrom higher timeframes I personally am unsure of the strength of this currents month direction due to trading within a Higher Time frame consolidation.
Trading within a 1-5 Elliot's wave pattern I would like to see this current wedge pattern be respected.
Saying that as said above we are consolidating in price action so I have noticed a change of character with a valid pullback but price has wiped it out suggesting sellers are here with force. There is a strong Demand that price "could" see potential in moving too although that would tell me that this consolidation pattern is not valid.
Over all I am waiting still for price to make a move deeper into this 50% level for discount buyers before making a larger move yet again.
Please follow for more

COIN completed vawe 4I believed that vawe 4 completed and we will move up. Price turned from Ema 100 as well. I am Bullish in COIN

CoinbaseLast week, on Friday, I re-entered my position on the long side of COIN. I bought 40 shares @ an average price of $301. Looking at the extended hours trading tonight, price is currently changing hands for $333.50/share. This means in my little position, I am up $1300 on a trade I was risking $200 for. I am always very picky with my trades, and it is for this reason. I don't need to trade every move the market makes. I only need to trade the high risk/reward ones. Things could change by the time market opens tomorrow, but as of now, I am already up almost 30% this year. That is by only making a handful of trades in only half of the year. As I constantly stress, patience is key in this game. Imagine 30% profits year-over-year. This is generational wealth when done for long enough. That is taking a $40k account to about $105 million in 30 years. If done for 40 years that equates to $5.2 BILLION. Do you have the patience to make 30% per year for 40 years?
My analysis currently suggests we are on the way up to the next target box that goes from $386-$422. This is the 0.618-0.854 of the minor A wave. The box is where I intend on exiting this position. If I can manage to hold onto these shares, and if price makes it to the target box, I am looking at a profit of about $3500 or 29%.
Minor A wave took about two weeks to complete. If minor B lasts for the same duration, we should conclude this move by the end of August. Don't forget, this is minor B wave according to my count, and thus, can last much longer and become very complex. Time will tell, for now though, I will concentrate on the upcoming week.

COIN Gamma Strom Incoming!!!🚀 COIN Weekly Swing Setup (2025-08-09) 🚀
**Bias:** 📈 **Modestly Bullish** — strong call flow + low VIX, but weak volume tempers confidence.
**🎯 Trade Plan**
* **Ticker:** \ NASDAQ:COIN
* **Type:** CALL (LONG)
* **Strike:** \$350.00
* **Entry:** \$0.90 (open)
* **Profit Target:** \$1.70 (+89%)
* **Stop Loss:** \$0.45 (-50%)
* **Expiry:** 2025-08-15
* **Size:** 1 contract
* **Confidence:** 65%
**📊 Key Notes**
* Call/put ratio 2.83 → strong bullish options flow ✅
* RSI mixed but recovering from oversold ⚠️
* VIX low → low gamma risk, favorable for option buyers ✅
* Watch volume closely at open for confirmation 🔍

TA $COINOn the NASDAQ:COIN Daily Chart, a clear fractal 8-count Elliott Wave sequence has formed with each peak aligning with RSI overbought conditions with the 3rd peak confirming resistance and retracements aligned with RSI oversold levels, confirming support. Volume patterns supported the sequence, showing strong participation during rallies and fading volume on pullbacks. A Golden Cross printed on June 24th, adding further bullish confluence before the recent retracement phase.
On the 15-minute chart, price is testing support while forming an inverted Head & Shoulders pattern. This setup is reinforced by bullish divergence on both Volume and RSI. A decisive breakout above the $317 neckline would invalidate the retracement structure and open the path toward the next major target at $400. A drop below $302 would invalidate the bullish setup.

$COIN Price Action playing out exactly as expected!NASDAQ:COIN price action is following the plan laid out a few weeks ago.
After the momentous rally into all time high I was expecting price to have a deep retracement to the weekly pivot point also the golden pocket Fibonacci retracement $240. That is what we got! This values would correspond with a swing below the major High Volume Node support resetting daily and weekly RSI. Daily RSI is already oversold so I am expecting a bounce for wave B of this wave 2 corrective wave with a target of the $350 High Volume Node major resistance.
The weekly 200EMA is ascending and may meet us in the same area adding confluence but this would take a lot longer to play out.
Alternatively, there is also a gap at $215-230 that never got filled at the larger degree golden pocket which would have me upgrade this pullback to wave 2 instead of wave 4.
Bitcoin stocks have all had a decent retracement causing me to upgrade my Elliot Wave count to a completed macro wave 1 with wave 2 now underway, suggesting the best returns are still to come over the next months for this category asset class in wave 3!
Analysis is invalidated if we go to new highs or lose $140. New long signals are certainly building in the DEMA PBR and Price Action strategies so keep an eye out on the Trade Signals Substack as we have made very food profits lately in these markets!
Safe trading

Coinbase to fill the gap and touch 380 againCoin is still on the trend line and will get back to 380 again

COIN Gamma Storm Incoming!!!## 🚨 COIN Weekly Options Setup (Aug 7, 2025) 🚨
**Massive Call Flow vs. Bearish Momentum — Who Wins?**
> 🔍 Multiple AI models conflicted. Gamma risk rising. One day to expiry. Here's the trade...
---
### 🧠 Key Model Consensus (Across Grok, Claude, Llama, DeepSeek, Gemini):
✅ **Bullish Options Flow** from institutional players
📉 **Bearish Price Momentum** and RSI
⚠️ **High Gamma Risk** into expiration
🤔 **Signal Divergence** = Uncertainty + Volatility
---
### 🟩 **Bulls’ Case (Grok, Claude, Llama):**
* Oversold conditions + call buying = Rebound Setup
* Volume spike confirms institutional interest
* Moderate bullish lean with upside potential
### 🟥 **Bears’ Case (DeepSeek, Gemini):**
* Price action still weak
* Distribution pressure detected
* Recommending no trade or puts
---
### 📊 Trade Setup Summary
| Parameter | Value |
| -------------------- | ----------------- |
| 🎯 **Strike** | \$322.50 |
| 📅 **Expiry** | 2025-08-08 (1DTE) |
| 📈 **Direction** | CALL (LONG) |
| 💵 **Entry Price** | \$0.96 |
| 🎯 **Profit Target** | \$1.44 |
| 🛑 **Stop Loss** | \$0.57 |
| 📏 **Size** | 2 Contracts |
| 🔁 **Entry Timing** | Market Open |
| 🧪 **Confidence** | 65% (Moderate) |
---
### ⚠️ Risks to Watch:
* 1DTE = High volatility swings ⚡
* Momentum still leaning bearish 📉
* Gamma moves could trigger sharp reversals
---
📌 **Final Take**:
**Trade if you’re aggressive. Sit out if you’re cautious.**
This is a classic high-risk/high-reward setup driven by **options flow vs. price action divergence**.
