COIN Bullish Continuation: Breakout Above 361 Toward 390–400COIN on the 1D chart is pressing near recent highs after breaking a multi-month range in early October and flagging through most of the month. Momentum stays constructive with price above the 20/60/120-day cluster and Bollinger Bands expanding. The prior range top has flipped to support, keeping the structure bullish.
The immediate hurdle is resistance at 355, with the recent swing high at 361.40 acting as the confirmation line. A daily close above 361.40 would validate the bull-flag continuation and opens room toward the 390–400 zone, with interim interest around 375. If momentum pauses first, a controlled pullback into 330—aligned with the breakout retest and the MA60—would be a constructive demand zone; 320 is the key higher-timeframe floor that anchors the trend.
Primary path: look for a break-and-hold above 355/361.40 to extend into 375 and then 390–400 as the next resistance band. Alternative path: if price fails to reclaim 355 and loses 330, expect a drive toward 320; a daily close below 320 would invalidate the bullish thesis and shift risk to a deeper correction.
This is a study, not financial advice. Manage risk and invalidations.
Trade ideas

CoinbaseI am tracking two possible counts with three possible pathways. The two counts suggest we continue lower in minor C or move up for a minimal high in the $411 - $427 area. The move lower is what has two possible pathways it could take. The first is that it continues lower from here which suggests that ((b)) is already complete. The second is we're heading slightly higher for a flat abc pattern concluding c of ((b)). After that, price would then continue its move lower in ((c)) of minor C.
We will find out soon enough, but I believe that white count (either pathway) has the higher probability. The problem is that I cannot yet rule out the turquoise B count. So, for now, it stays on the chart.

Short Squeeze QuantSignals V3 Screener 2025-11-01Short Squeeze QuantSignals V3 Screener 2025-11-01
🚀 Short Squeeze QuantSignals V3 Screener - 2025-11-01
Elite AI-powered short squeeze opportunity scanner
---
🔥 Top Short Squeeze Candidates
🚀 NASDAQ:MRNA - Squeeze Score: 24/100
Confidence: 32.0% | Risk: Medium
Short Interest: 17.2% | Short Float: 20.2% | Borrow Fee: 15.0%
Days to Cover: 6.1 | Current Price: $27.16
Key Factors:
• 📊 Elevated Short Interest (17.2%, +5.0 pts)
• 💵 Elevated Borrow Cost (15%, +4.0 pts)
• ⏰ High Days to Cover (6.1d, +6.0 pts)
• 📈 Near SMA20 (+1.0%, +3.0 pts)
• 💥 High Volatility (60%, +6.0 pts)
Conflicts:
• ⚠️ Low volume (1.5x)
🚀 NASDAQ:SOFI - Squeeze Score: 12/100
Confidence: 32.0% | Risk: Medium
Short Interest: 7.2% | Short Float: 8.5% | Borrow Fee: 3.0%
Days to Cover: 1.4 | Current Price: $29.68
Key Factors:
• 📍 Gap Up (+2.3%, +4.0 pts)
• 📈 Near SMA20 (+4.8%, +3.0 pts)
• 💥 Elevated Volatility (56%, +3.0 pts)
• 🔄 Elevated Turnover (6.7%, +2.0 pts)
Conflicts:
• ⚠️ WARNING: Low short interest (7.2%)
• ⚠️ Low volume (0.8x)
🚀 NYSE:NIO - Squeeze Score: 11/100
Confidence: 32.0% | Risk: Medium
Short Interest: 7.1% | Short Float: 8.3% | Borrow Fee: 3.0%
Days to Cover: 1.9 | Current Price: $7.25
Key Factors:
• 📈 Near SMA20 (+2.5%, +3.0 pts)
• 💥 High Volatility (66%, +6.0 pts)
• 🔄 Elevated Turnover (5.1%, +2.0 pts)
Conflicts:
• ⚠️ WARNING: Low short interest (7.1%)
• ⚠️ Low volume (0.9x)
🚀 NASDAQ:COIN - Squeeze Score: 10/100
Confidence: 32.0% | Risk: Medium
Short Interest: 5.2% | Short Float: 6.1% | Borrow Fee: 3.0%
Days to Cover: 1.3 | Current Price: $343.78
Key Factors:
• 📍 Gap Up (+2.3%, +4.0 pts)
• ⚡ Volume Accelerating (1.5x, +3.0 pts)
• 💥 Elevated Volatility (59%, +3.0 pts)
Conflicts:
• ⚠️ WARNING: Low short interest (5.2%)
• ⚠️ Below SMA20 (-1.9%)
• ⚠️ Low volume (1.5x)
🚀 NASDAQ:MSTR - Squeeze Score: 10/100
Confidence:
Image
32.0% | Risk: Medium
Short Interest: 8.1% | Short Float: 9.5% | Borrow Fee: 3.0%
Days to Cover: 2.0 | Current Price: $269.51
Key Factors:
• 📍 Large Gap Up (+6.1%, +7.0 pts)
• 💥 Elevated Volatility (58%, +3.0 pts)
Conflicts:
• ⚠️ WARNING: Low short interest (8.1%)
• ⚠️ WARNING: Stock falling (-8.8%), squeeze setup not triggered
• ⚠️ Below SMA20 (-9.6%)
---
💡 Short Squeeze Mechanics
• Forced Covering: High short interest + price rise = forced buybacks
• Gamma Squeeze: Options activity amplifies upward momentum
• FOMO Effect: Retail participation accelerates the squeeze
• Timing is Critical: Squeezes are explosive but short-lived
⚠️ Risk Management
• Short squeezes are extremely high-risk, high-reward plays
• Use strict position sizing (max 1-3% per position)
• Set tight stop losses (8-12% below entry)
• Take profits aggressively - squeezes reverse quickly
• Never hold through earnings or major catalysts
💡 Remember: Squeeze timing is unpredictable. Only risk capital you can afford to lose.
---
🤖 Generated by: QuantSignals V3 Short Squeeze AI
📅 Analysis Date: 2025-11-01
⚡ Powered by: Real-time short interest data + Advanced momentum indicators

COIN Much higher to comeCoinbase had a shallow pullback in wave (II) after running 10x in wave (I). Wave (II) was expected to reach the 0.618 Fibonacci retracement but was front run above the 0.5 demonstrating long term strength.
R5 weekly pivot target is now $841 which is expected to be hit if we get tailwind momentum in wave (III). Price appears to be finding a bottom locally and preparing for the next leg up into price discovery.
RSI has plenty of room for months of overextension in price.
🎯 Terminal target for the business cycle could see prices as high as $800 based on the weekly pivots
📈 Weekly RSI is oversold with no divergence and can remain here for months as price keeps increasing.
👉 Analysis is invalidated below wave (II), $148

COIN Bullish Flag: Breakout Above 368 Toward 410–440Coinbase has shifted from corrective to cautiously bullish on the 1D chart. After July’s peak, price based around the $315–$320 area and then broke structure in late September, reclaiming all key moving averages. The latest pullback tagged the MA20 after a rejection at the $390–$400 resistance, while Bollinger Bands, once contracted, are opening up again—often a sign of building energy.
The working structure is a bullish flag: a strong late-September/early-October impulse (flagpole) followed by a tight, slightly downward channel. The primary path is continuation on a break-and-daily close above ~$368 (flag top) with expanding volume. That unlocks a run toward the recent high at $390, then $400, and—on follow-through—an extension toward $410 and the July supply near $430–$440. Short-term support sits near $340 (confluent with the MA60), which has repeatedly caught dips and remains the pivot for the bullish case.
If price loses $340 on a sustained daily close, the idea is invalidated and the door opens for a deeper fade toward the $320 zone/MA120. Until a clean break, expect chop between the MA20 and $368 with momentum reset via MACD cooling.
This is a study, not financial advice. Manage risk and invalidations

COINBASE (COIN) – Watching for Pullback Entry Around $343Coinbase NASDAQ:COIN has surged nearly +20% since our previous update, powered by strength in the broader crypto sector. With price action now extended, we’re watching for a pullback opportunity around the $343 area — a previous zone of interest where buyers may step back in.
💡 Trade Setup:
Entry Zone: $343 (on pullback confirmation)
Take Profit Targets:
TP1: $360–$390
TP2: $415–$440
Stop Loss: $303 (below key support)

Coinbase May Be CoilingCoinbase Global has done little as the broader market climbs, but some traders may expect the cryptocurrency exchange to start moving.
The first pattern on today’s chart is the series of higher lows since early September. Those may suggest that buyers are lurking.
Second, COIN’s 50-day simple moving average (SMA) had a “golden cross” above the 200-day SMA in late June. Is the long-term trend getting bullish?
Third, the 8-day exponential moving average (EMA) just crossed back above the 21-day EMA. That may reflect an increasingly positive short-term trend.
Next, stochastics are rebounding from an oversold condition.
Finally, COIN is an active underlier in the options market. (Its average daily volume of 249,000 contracts in the last month ranks 15th in the S&P 500, according to TradeStation data.) That could help traders take positions with calls and puts.
TradeStation has, for decades, advanced the trading industry, providing access to stocks, options and futures. If you're born to trade, we could be for you. See our Overview for more.
Past performance, whether actual or indicated by historical tests of strategies, is no guarantee of future performance or success. There is a possibility that you may sustain a loss equal to or greater than your entire investment regardless of which asset class you trade (equities, options or futures); therefore, you should not invest or risk money that you cannot afford to lose. Online trading is not suitable for all investors. View the document titled Characteristics and Risks of Standardized Options at www.TradeStation.com . Before trading any asset class, customers must read the relevant risk disclosure statements on www.TradeStation.com . System access and trade placement and execution may be delayed or fail due to market volatility and volume, quote delays, system and software errors, Internet traffic, outages and other factors.
Securities and futures trading is offered to self-directed customers by TradeStation Securities, Inc., a broker-dealer registered with the Securities and Exchange Commission and a futures commission merchant licensed with the Commodity Futures Trading Commission). TradeStation Securities is a member of the Financial Industry Regulatory Authority, the National Futures Association, and a number of exchanges.
Options trading is not suitable for all investors. Your TradeStation Securities’ account application to trade options will be considered and approved or disapproved based on all relevant factors, including your trading experience. See www.TradeStation.com . Visit www.TradeStation.com for full details on the costs and fees associated with options.
Margin trading involves risks, and it is important that you fully understand those risks before trading on margin. The Margin Disclosure Statement outlines many of those risks, including that you can lose more funds than you deposit in your margin account; your brokerage firm can force the sale of securities in your account; your brokerage firm can sell your securities without contacting you; and you are not entitled to an extension of time on a margin call. Review the Margin Disclosure Statement at www.TradeStation.com .
TradeStation Securities, Inc. and TradeStation Technologies, Inc. are each wholly owned subsidiaries of TradeStation Group, Inc., both operating, and providing products and services, under the TradeStation brand and trademark. When applying for, or purchasing, accounts, subscriptions, products and services, it is important that you know which company you will be dealing with. Visit www.TradeStation.com for further important information explaining what this means.

COIN | 200 SMA Confluence + Bullish Doji = High-Value Setup🎯 COIN: The 200 MA Heist — Dip Buyers Stacking Bags While Others Panic 💼🔥
📊 Asset Intelligence
Coinbase Global Inc (COIN) — NASDAQ
Strategy Classification: Swing/Day Trade Hybrid
Market Bias: Bullish Pullback Confirmation
Risk Profile: Calculated Aggression
🧠 Technical Thesis — Why This Setup Slaps
Listen up, Thief OG's 👀
COIN just pulled back to the 200 Simple Moving Average and did exactly what professional setups do — it respected support and reversed. We got a textbook Heikin Ashi reversal doji candle forming right at the MA, signaling buyer exhaustion turned into buyer dominance.
Translation for the streets: Big money stepped in. Retail panicked. We capitalize.
📈 What We're Seeing:
200 SMA holding like a vault door 🔐
Heikin Ashi doji = indecision flipped to bullish conviction
Volume profile showing accumulation, not distribution
Buyers got the juice to push this higher
This isn't hopium. This is structure meeting momentum at a critical support zone.
💰 The "Thief Strategy" Entry Playbook
We don't chase. We layer. We scale. We steal profits from emotional traders.
Instead of slapping market buy like a degen, we're using layered limit orders to build our position as price moves in our favor. Think of it like planting money traps on the way down.
🎯 Entry Layers (Limit Orders):
Layer 1: $330 💵
Layer 2: $340 💵
Layer 3: $350 💵
Layer 4: $360 💵
You can add more layers if you're feeling spicy 🌶️. The goal is to dollar-cost average into strength, not weakness. Let the market come to YOU.
Pro Tip: Not all layers need to fill. Sometimes you only catch 2-3. That's fine. Better to miss some entry than to get caught in a fake-out.
🛡️ Risk Management — Protect Ya Neck
Stop Loss: $310 🚨
Real talk, Thief OG's: This is MY stop based on MY risk tolerance. You are NOT me. You don't have my account size, my strategy, or my psychology.
Set your own stop based on:
How much you're willing to lose per trade
Your position size
Your personal pain threshold
If COIN breaks below $310, the thesis is invalidated. The 200 MA failed. Buyers lost control. We exit, regroup, and find the next heist. No ego. No revenge trading. Just discipline.
🎯 Target Acquisition — Where We Take the Bag
Primary Target: $430 💎
⚡⚠️ WARNING: Resistance Fortress Ahead
At $430, we're walking into a battlefield:
Historical resistance = sellers have limit orders stacked
Overbought territory = indicators flashing red
Trap zone activated = late buyers will get liquidated here
What smart money does: Lock profits. Don't marry the trade. Don't get greedy.
Potential scenarios:
🟢 Strong momentum? Trail your stop and let winners run
🟡 Consolidation at $420? Take 50-75% off the table
🔴 Rejection at $430? Exit immediately, don't hope
(Thief OG's — again, this is MY target. You might want to exit at $400 for quick profits. You might want to hold for $450. Your rules. Your capital. Your consequences.)
🔗 Correlated Assets — The Bigger Picture
Don't trade COIN blind. Context is king.
Watch These Tickers:
BITSTAMP:BTCUSD & BITSTAMP:ETHUSD
Correlation: STRONG
COIN is basically a leveraged play on crypto sentiment. Bitcoin pumps = COIN pumps harder. Bitcoin dumps = COIN dumps harder. Always check the crypto market before entering.
⛏️ NASDAQ:MARA & NASDAQ:RIOT
Correlation: HIGH
Fellow crypto-exposed stocks. If they're ripping, COIN usually follows. If they're bleeding, stay cautious.
💳 SET:SQ (Block Inc.)
Correlation: MODERATE
Fintech + crypto exposure. Similar institutional money flows. Good confirmation indicator.
💵 TVC:DXY (US Dollar Index)
Correlation: INVERSE
Strong dollar = crypto weakness = COIN weakness
Weak dollar = crypto strength = COIN strength
Simple math. Don't ignore macro.
🔑 Key Insight: If Bitcoin is fighting resistance at $70K while COIN is trying to break out, one of them is lying. Read the room.
📌 Technical Breakdown — The Charts Don't Lie
✅ 200 SMA Support: Holding firm — institutional support level
✅ Heikin Ashi Reversal: Doji + bullish follow-through = momentum shift confirmed
✅ Volume Analysis: Accumulation on dips, not capitulation
✅ Risk/Reward Ratio: Solid if stops are honored and targets are realistic
⚠️ Resistance at $430: Real, tested, and dangerous — respect it
⚠️ Crypto Market Dependency: If BTC drops 10%, COIN drops 15%. Stay alert.
📢 Thief OG Community Rules
Never risk more than you can afford to lose — period.
Position sizing > entry price — manage your risk first, profits second.
Stick to YOUR plan — my plan is mine. Yours is yours.
Take profits — unrealized gains aren't real until you close the trade.
No FOMO, no revenge trades — discipline beats emotion every time.
✨ If you find value in my analysis, a 👍 and 🚀 boost is much appreciated — it helps me share more setups with the community!
#COIN #Coinbase #SwingTrading #DayTrading #ThiefStrategy #CryptoStocks #TechnicalAnalysis #PullbackSetup #HeikinAshi #200MA #NASDAQ #BullishSetup #LayeredEntry #RiskManagement #SmartMoney #PriceAction #TradingView #StockMarket #SwingTrader

Coinbase Bottom in, new all time high coming?NASDAQ:COIN had a deep pullback after its recent bullish move but caught a large bid by the end of the week leaving a long lower wick. It appears the bottom is in but investors should be cautious as price is below resistance major resistance High Volume Node and R1 weekly pivot.
If the pullback is complete then we have a very shallow wave 2 within wave (II) and can expect much higher targets perhaps in the $1000s before the end of this business cycle. There will resistance at the upper boundary and R3 weekly pivot around $600 and a breakout above that area will signal we go higher.
RSI has plenty of room for months over overextension in price.
I will be looking to add a long so look out for the signal in my Trade Planning Substack.
Safe trading

Coinbase Bearish H/S possibilityWould like to start off by saying that I am long-term bullish on Coinbase and Crypto, in general.
Only looking for opportunities to make $$$.
IDEA ~ in the short term; a similar H/S pattern similar to the one in July
- if 300SMA is taken then my PT = ~250

COIN at Support – Looking for a Year-End RallyWe’re closely watching the crypto market for a potential bottom over the next two weeks, with expectations of a recovery into year-end. This broader momentum could translate into a strong rebound for Coinbase NASDAQ:COIN , which often moves in sync with the crypto space. Price has now reached a key support zone, which could serve as the foundation for a bullish reversal.
Currently, COIN is trading around $310–$320, a zone where previous buying interest has emerged. I'm looking for price to stabilize and confirm support here before entering a long spot trade. If this support holds, it could open the door to a multi-leg rally into the end of the year.
🛠 Trade Setup
Entry: $310–$320
Take Profit Targets: $360–$390 and $415–$440
Stop Loss: Below $303

mech model on coinbasenice weekly inversion we trading at high price expectations for some pullback to the month unfiiled ima

Coinbase: Top Is In!We now view the top of blue wave (b) as established. Wave (c) is expected to drive further sell-offs below support at $291.50, ultimately completing magenta wave , specifically within our magenta Target Zone between $255.42 and $173.05. From there, the upward impulse should then continue past resistance at $444.65. On the other hand, we assign a 33% probability to blue wave alt.(b) reaching a higher high; in that scenario, the anticipated declines would be postponed by a detour above resistance at $444.65.

COIN Still following the plan.... nothing changedNASDAQ:COIN was expected to test the High Volume Node and channel upper boundary after its breakout as support. That happened Friday and touched it precisely during the market chaos we expect to reverse back to trend this week.
Wave V is underway, wave IV completed at the 0.382 Fibonacci retracement and High Volume Node - a high probability area for a bottom.
RSI tapped overbought but no bearish divergence.
The gap has been filled and could market a reversal point lower on the macro and we should watch carefully but the trend is up for now.
Safe trading

$COIN pullback to $330 area sets up fresh longsNASDAQ:COIN is looking somewhat exhausted here. I think it's likely that we see a pullback to the $322-330 area, then that can set up a fresh long to new highs.
I'm currently short COIN.
I'd be looking to enter calls at the support level, then take calls to at least the $428 resistance level, however, I think it's most likely that we break that level and find a high between $494 and 508 level for the final high of this move.
Let's see how it plays out.

$COIN viction Trade: Weekly Up, Daily Tight
NASDAQ:COIN
Summary
NASDAQ:COIN exhibits a textbook “expand → break → retest → coil” progression. A broad weekly megaphone that developed through 2024 continued into 2025 with a June ’25 breakout; price subsequently reached ~$445 (megaphone resistance) in July ’25 and then retraced in an orderly fashion, holding above 2023’s ceiling. Since that pullback, ranges have narrowed and participation has declined while price consolidates above $280—behavior consistent with constructive acceptance before a potential next leg higher.
Market Structure and Setup
The primary structure is defined on the weekly chart: an expansionary megaphone that retested prior highs. Tactically, the daily chart shows a controlled pullback, retest, and subsequent coil. This multi-timeframe alignment—higher-timeframe trend with lower-timeframe acceptance—creates favorable conditions for measured moves and for risk to be defined against transparent levels rather than discretionary judgment.
Fibonacci-Based Upside Roadmap
Anchoring to the 2024–2025 impulse advances, 1.618 extensions cluster around ~$580 (Sep ’24 → Dec ’24 leg) and ~$650 (Oct ’23 → Mar ’24 leg). These are not short-dated “targets” but conditional waypoints: they remain operative if the current consolidation resolves higher and the weekly uptrend reasserts.
Microstructure: Short Consolidations as Future Magnets
In sustained advances, brief, tight candlestick compressions often function as “price memory,” attracting subsequent retests and liquidity. COIN’s February 2024 bull-flag pause—formed mid-run—has been revisited multiple times since, underscoring how such compressions act as magnets in later price action. The present tight band atop $340–$370 should be viewed in similar context: it is both a potential near-term launchpad and a likely reference zone for future pullbacks as supply and demand re-balance around it.
Execution Plan
Accumulation is favored on constructive behavior within $290–$330 (retest followed by a higher low on the daily). For risk management, tactical invalidation sits below ~$280; for participants keying off weekly structure, a wider ~$250 stop aligns with the higher-timeframe shelf. If momentum resolves first, additional entries are reasonable on a clean break-and-hold above local range highs, using the reclaimed shelf to maintain tight risk. From a successful breakout, staged distribution into ~$580 with reassessment into ~$650 allows the position to self-finance while respecting the possibility of momentum fatigue.
Invalidation Criteria
A daily close back below ~$280 would indicate the near-term reclaim has failed and the base requires more time. A weekly close beneath ~$250 would challenge the integrity of the larger expansionary structure. Either signal warrants standing aside and allowing the chart to reset.
Fundamental Linkages
Coinbase’s revenue remains acutely sensitive to crypto price trends and realized volatility. When BTC/ETH trend and trading activity broadens across spot and derivatives, COIN’s top line typically expands with the cycle. The U.S. regulatory backdrop has moderated relative to the prior year—removing one overhang—yet policy risk persists and can shift rapidly. In effect, the technical setup has a plausible fundamental tailwind when the broader crypto complex trends and trades.
Key Risks
Crypto beta: A broad risk-off in digital assets will likely transmit to COIN regardless of technical posture.
Policy/regulation: Adverse enforcement actions or new rules could impair volumes, product breadth, or take rates.
Competition: A prospective Kraken IPO would arm a major U.S. competitor; Robinhood’s continued crypto build-out pressures economics during quieter tapes.
Operational/security: Exchange businesses carry ongoing operational and cybersecurity risks; incidents can compress multiples abruptly.
Conclusion
The market disclosed intent with the June breakout; current price action is testing sponsorship. Provided COIN continues to accept above $280–$330 and the ongoing coil resolves upward, the $580 → $650 roadmap remains credible. The operative plan is to trade the daily in the direction of the weekly, treat the former resistance shelf as the line in the sand, and require the chart to confirm strength before pressing exposure.
Not financial advice. Just charting things out. Let’s see what happens. Please adapt levels, sizing, and risk controls to your own process and constraints.

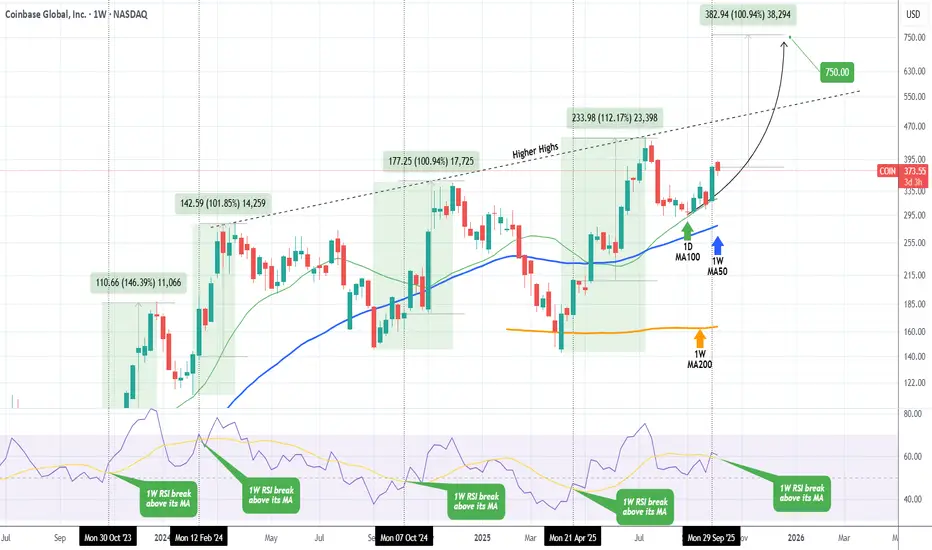
COINBASE Last time it did this, it rallied at least +100%Coinbase (COIN) has set eyes on its Higher Highs trend-line again, the very same structure which we targeted successfully ($400 Target) on our buy signal 5 months ago (May 07, see chart below):
This time we have in our hands perhaps the strongest bullish confirmation signal of this Cycle, the 1W RSI breaking above its MA trend-line. This took place last week and every time Coinbase did this in the past 2 years, it rallied by at least +100%.
If that's repeated, it means the price would target $750, which is however well above the Higher Highs trend-line. A solid strategy would be targeting the Higher Highs trend-line initially and if the price breaks above it and re-tests/ holds it as Support, re-buy and then target $750.
-------------------------------------------------------------------------------
** Please LIKE 👍, FOLLOW ✅, SHARE 🙌 and COMMENT ✍ if you enjoy this idea! Also share your ideas and charts in the comments section below! This is best way to keep it relevant, support us, keep the content here free and allow the idea to reach as many people as possible. **
-------------------------------------------------------------------------------
💸💸💸💸💸💸
👇 👇 👇 👇 👇 👇
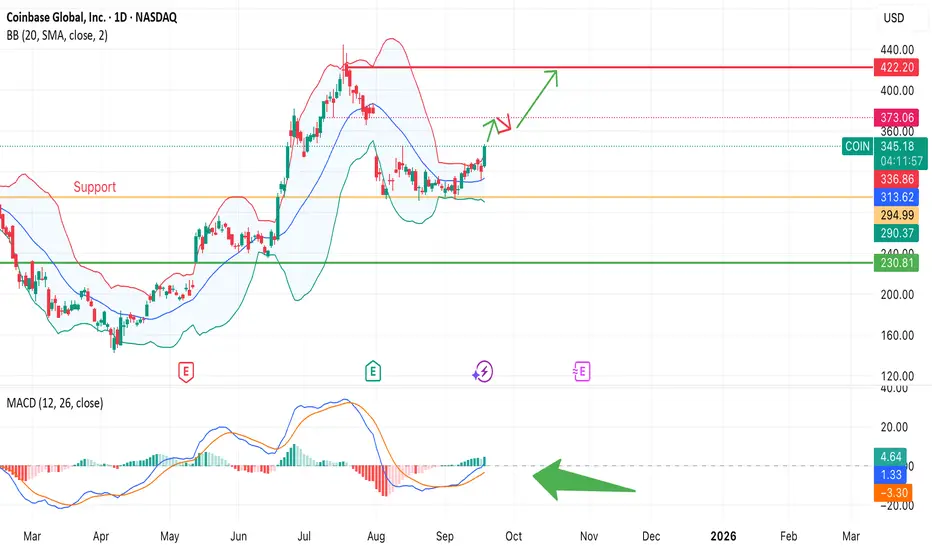
Coinbase – COMEBACK TIME?After the Fed’s 25 bps rate cut, Coinbase NASDAQ:COIN gained strong upward momentum. Lower borrowing costs boosted risk appetite and supported the crypto sector — pushing NASDAQ:COIN higher.
Price has moved above $340 and is heading toward key resistance at $373.
A breakout above $373 opens the path to $422.
Support remains at $313–315, with a deeper level near $295.
MACD shows a bullish crossover, confirming the upside momentum.
Bollinger Bands: price is pushing toward the upper band, signaling renewed strength.
Risks
Profit-taking may appear near $373.
COIN’s move is highly correlated with BTC and overall crypto sentiment.
CoinbaseToday price continued higher and ideally finished its sub-minuette wave iii. There is still a chance that it gets another high closer to the 1.618 before kicking off wave iv though. This is signified by the turquoise label on the chart.
The wave ii was very short and shallow so one should expect the wave iv to be deep and long if the theory of alternation is to remain intact. Generally speaking, if the move lower breaches the 0.5 retracement fib, you're likely dealing with something other than a wave iv. However, due to how shallow the wave ii was, I will give this next consolidation a little more leeway. Keep in mind too, the wave 4 of a lesser degree bottomed at $368.80. Again, I won't be surprised if price breaches this low. My thought is that price will come down right to the area of the 0.5 retracement fib @ $362.19 with the possibility of a minor breach. After, I anticipate price to move up to the $411 area as we have strong confluence there.
My plan is to buy back in when/if price makes it to the smaller target box. I will then be looking to sell at the above-mentioned target area.

Can COIN's $330 Breakout Reach $380? ~ Tactical Entry Plan📈 COINBASE GLOBAL, INC. (COIN) - Money Heist Plan (Swing/Day Trade) 🕵️♂️
🚨 Ready to execute the ultimate heist on COIN? This Money Heist Plan uses the Thief Strategy, a layered limit order approach to catch the breakout at $330.00 ⚡. Below, I've outlined the setup, technicals, fundamentals, and macro insights to help you navigate this trade like a pro. Set your alarms, plan your escape, and let’s dive into the details! 🔒
🛠️ Trade Setup: The Thief Strategy
The Thief Strategy is a tactical approach using multiple limit order layers to enter the trade post-breakout, maximizing flexibility and precision. Here’s how to execute it:
Asset: COINBASE GLOBAL, INC. (COIN) 💰
Entry Trigger: Breakout above $330.00 ⚡
Set a price alert on TradingView to catch the breakout in real-time! 🔔
Layered Entries (Thief Style): Place multiple buy limit orders to scale in:
$310.00
$315.00
$320.00
$325.00
$330.00
Pro Tip: Adjust layers based on your risk tolerance and strategy. Confirm entries only after the breakout at $330.00! ✅
Stop Loss (SL): Place at $295.00 post-breakout 🛑
Note: Adjust SL based on your risk management. The Thief Strategy is flexible—manage risk at your discretion, dear Traders (Thief OGs)! 😎
Take Profit (TP): Target $380.00 🎯
Resistance and overbought levels signal a potential police barricade 🚔. Escape with profits before the trap! Adjust TP based on your strategy.
Disclaimer: TP is not fixed—take profits at your own risk and preference.
📊 Why This Plan? Technical & Fundamental Breakdown
🔍 Technical Analysis: The Thief’s Blueprint
Breakout Catalyst: COIN is testing the $330.00 resistance. A confirmed breakout signals strong bullish momentum 📈.
Thief Strategy Advantage: Layered entries reduce risk of false breakouts and allow scaling into the move.
Key Levels to Watch:
Support: $295.00 (SL zone)
Resistance/Target: $380.00 (overbought zone)
Setup Confirmation: Use volume spikes and RSI for breakout confirmation. Set TradingView alerts to stay sharp! 🔔
📉 Fundamental & Macro Insights
Market Cap: $81.47B
PE Ratio (TTM): 30.52 (above industry avg., signaling high valuation)
EPS (TTM): $10.39
Revenue Growth (YoY): +12.36% (2025 est.) 💪
Profit Margin: 42.67% 🔥
Cash Reserves: $7.54B (strong balance sheet)
Risks:
Q2 profit drop to $33.2M vs. $294.4M YoY 📉
High P/E (30.71) and Price/Sales (12.61) raise valuation concerns
Macro Drivers:
Genius Act: Boosted crypto optimism 🚀
Crypto Market Trends: Bitcoin’s record highs in July 2025 fuel COIN’s upside potential
😰 Fear & Greed Index
Current Sentiment: Neutral to Greedy (Crypto Fear & Greed Index: 0-100)
Trend: Mixed emotions due to crypto volatility and regulatory developments
Takeaway: Greed supports breakout potential, but stay cautious of volatility spikes.
🧠 Investor Sentiment
Retail Traders: Cautiously optimistic 😊, holding for long-term crypto growth but cautious of short-term volatility.
Institutional Traders: Mixed 🤔—some see overvaluation, others bet on crypto adoption and regulatory clarity.
🐂 Bullish vs. Bearish Outlook
Bullish Score: 60% 🐂
Why? Strong revenue growth (+13.72% YoY est. for 2026), crypto adoption, and institutional interest.
Bearish Risks: 40% 🐻
Why? Profit volatility, high valuation, and crypto market dependence.
Key Watch: Q3 earnings (Sep 2025) and crypto market trends.
💡 Why Trade COIN Now?
Short-Term: Neutral to slightly bearish due to profit concerns, but the $330.00 breakout could spark a quick swing/day trade.
Long-Term: Bullish on COIN’s role in crypto infrastructure and regulatory tailwinds.
Thief Strategy Edge: Layered entries and disciplined risk management make this setup ideal for volatile markets.
🔗 Related Pairs to Watch (USD)
BITSTAMP:BTCUSD : Bitcoin’s momentum drives COIN’s price action.
BITSTAMP:ETHUSD : Ethereum’s performance impacts COIN’s trading volume.
BITSTAMP:XRPUSD : Watch for altcoin rallies tied to regulatory news.
AMEX:SPY : Broader market trends influence COIN’s beta (3.69).
📅 Market Data Snapshot (10 Sep 2025)
Previous Close: $318.78
Day’s Range: $315.88 - $328.67
52-Week Range: $142.58 - $444.65
Avg. Volume: 13.43M shares
✨ “If you find value in my analysis, a 👍 and 🚀 boost is much appreciated — it helps me share more setups with the community!”
#TradingView #COIN #SwingTrading #DayTrading #CryptoTrading #TechnicalAnalysis #ThiefStrategy #MoneyHeist

COIN Wave III underway into all time high!Elliot Wave (III) is still underway after wave (II) completed at the weekly 200EMA. Coinbase had a huge bullish engulfing candle this week, closing price above the High Volume Node and R1 weekly pivot - a strong bullish signal!
Price first tested the High Volume Node support and 0.382 Fibonacci retracement, $270. Characteristic of wave 3 shallow pullbacks.
Weekly RSI has reset to the channel EQ and crossing bullishly giving price room to extend upwards!
Safe trading

COINBASE GLOBAL NASDAQ 4HThere is a significant price gap between $337 and $377. Considering this price gap and the positive aspects of the chart, we can consider taking a long position.

COIN - Explosive Earnings Growth + Strong Technical Breakout 📈 Ticker: COIN (Coinbase Global Inc.)
📍 Recommendation: LONG
⏰ Timeframe: Position Trade (4-12 weeks)
🎯 Trade Idea Summary
Entry: $373.86 (on pullback or breakout confirmation)
Stop Loss: $311.96 (-16.5%)
Take Profit: $502.79 (+34.5%)
Risk/Reward Ratio: 1:2.1
📊 Fundamental Justification - EXPLOSIVE 📈
Revenue Growth: STRONG (+111% YoY) 🚀
Net Income Growth: STRONG (from $95M to $2.58B) 💰
Debt Health: EXCELLENT (Score 10/10) ✅
Sector Tailwinds: Crypto recovery + institutional adoption
Market Position: Leading US crypto exchange
📈 Technical Analysis
Trend: Daily ↗️ Alcista, 4H ↗️ Alcista, 1H ↗️ Alcista (ALL BULLISH)
RSI: 68.0 - Strong momentum, room for upside
MACD: Bullish crossover + positive momentum
Price Action: Trading above all key SMAs (20, 50, 200)
Key Support: $350 (psychological), $330 (SMA50)
Key Resistance: $380 (recent high), then $420
🔍 Catalyst & Market Context
Crypto Cycle: Bitcoin ETF inflows + halving narrative
Institutional Adoption: Growing crypto allocation
Volume Surge: Trading volumes increasing significantly
Sector Rotation: Tech/Crypto leadership
🎮 Trade Management
Ideal Entry Zone: $370 - $377
Stop Below: $311.96 (below key support and SMA50)
Target 1: $450 (+20%) - Partial profit
Target 2: $502.79 (+34.5%) - Full position
Timeframe: 1-3 months for full target
⚠️ Risk Factors
High Beta: Crypto volatility exposure
Regulatory Risks: SEC/Government policies
Market Correlation: Tied to Bitcoin performance
Wider Stop: Required due to sector volatility
✅ Why This Trade Works
Earnings Explosion - 27x net income growth 📊
Technical Breakout - All timeframes bullish ���️
Sector Tailwinds - Crypto cycle acceleration ₿
Risk Management - Logical stop with 1:2+ R/R 🛡️
📅 Key Levels to Watch
Immediate Support: $350 - $360
Breakout Level: $380 - $385
Acceleration Zone: Above $400
Invalidation: Below $310
#COIN #Coinbase #Crypto #PositionTrade #EarningsGrowth #Breakout
#Bitcoin #CryptoStocks #TechnicalAnalysis #RiskManagement
Disclaimer: This post is for educational and informational purposes only and does not constitute financial advice or investment recommendation. Trading involves substantial risk of loss and is not suitable for all investors. Cryptocurrency-related stocks carry high volatility and regulatory risks. Past performance is not indicative of future results. Conduct your own research and consult with a qualified financial advisor before making any investment decisions.
