COST Lower Channel BounceHoliday season is hear and same store sales are increasing, the pattern is set up perfect , I like the entry here just as much as in the buy zone
Trade ideas

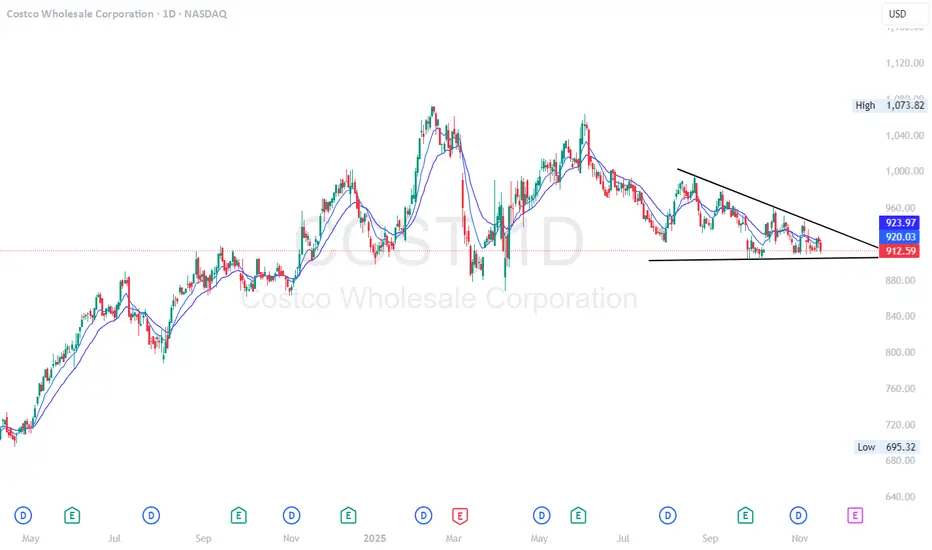
$COST - descending triangle pattern. put flow coming in strong.COST - Stock in descending triangle pattern on the daily. Seeing some big put buyers come in. Stock is weak at the indicator level. Looking for move downside below $900. Below $900 we can see $870 and $850.
COST on the move soon ?!!! Cost completed a wave 4 triangle since the ath .. now a 100+ move is expected once the triangle breaks .

Costco Stock BullishToday market was very weak, however, COST(Costco stock) was bullish and rising higher on a true volume. It will continue going up, a good trade to make money.
According to my Trade Navigator model — a data-driven system that tracks breakout momentum and overall market strength; the readings remain elevated, suggesting that bulls still have room to run for COST.
#COST #stocks #TradeNavigator #Momentum #DayTrading #StockTrading

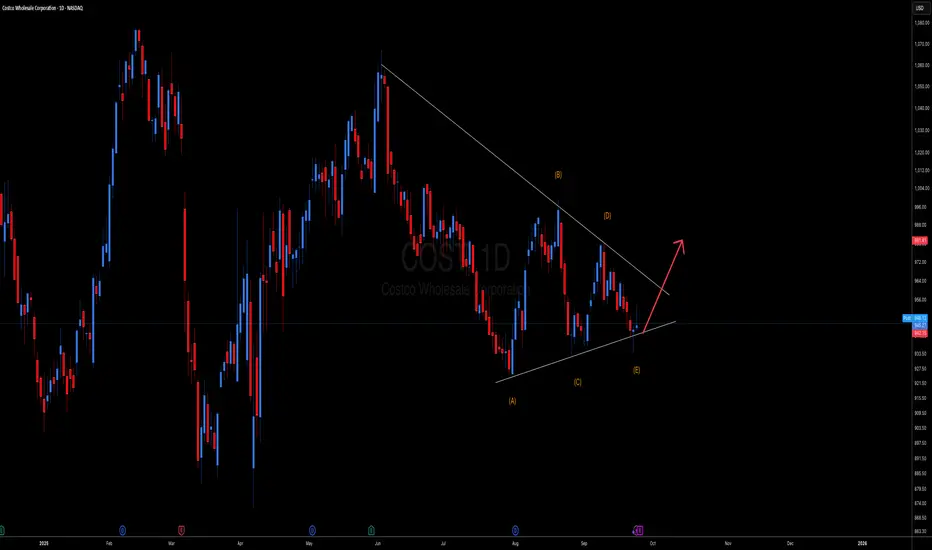
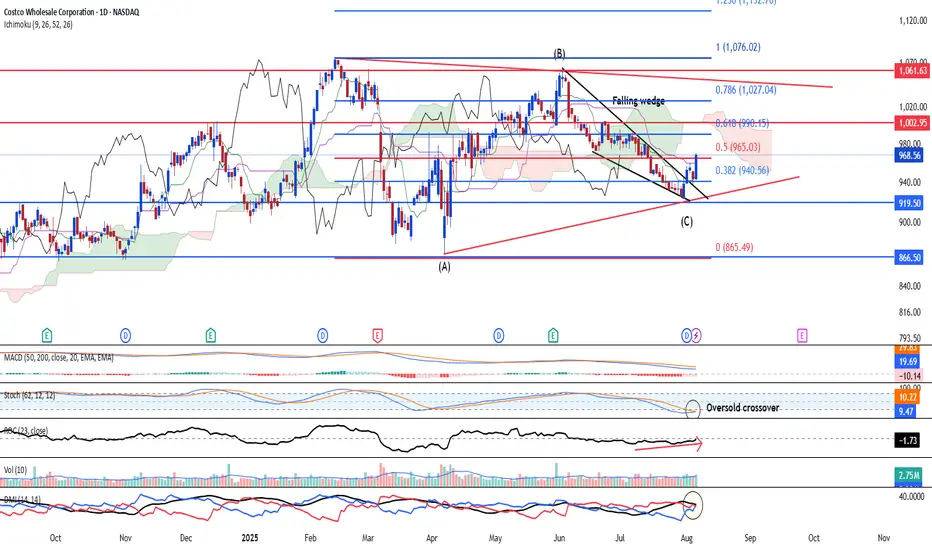
$COST: Shaping a corrective Flat NASDAQ:COST : An interesting pattern might be forming since its February all-time high (ATH). It could be developing into a flat structure with an ABC pattern, and the wave (C) seems to be taking the shape of a wedge. So far, the weekly candlestick is printing an inside week.

Costco has broken down from a rising trend Costco has broken down from a rising trend with increased volume and a significant price drop exceeding 3%.
The trendline has not been retested after the breakdown, but a retest is not required.
The price has support around 910 and 875.
There is a declining RSI(21) and negative volume balance over the past month.
The price is trading below a green Ichimoku cloud, and Senkou Span B has crossed above Senkou Span A in the forward-looking cloud, indicating weakening momentum ahead.
From a technical standpoint, Costco appears negative in the medium term (one to six months).
This analysis does not represent a long-term forecast.
Fundamental analysts remain largely positive on the stock.
Disclaimer: I recently exited my position in Costco. The position had shown weak performance, and I am also reducing exposure to the USD.

COSTCO Long Back to !K++ for EOY914.27 ENTRY grabbing shares only based on a GOLDEN Signal and appears to be sitting on support (almost out of negative momentum too)
980++ TP - TIMELINE 1-3 MONTHS
850 SL for now (but will raise as trade goes our way)

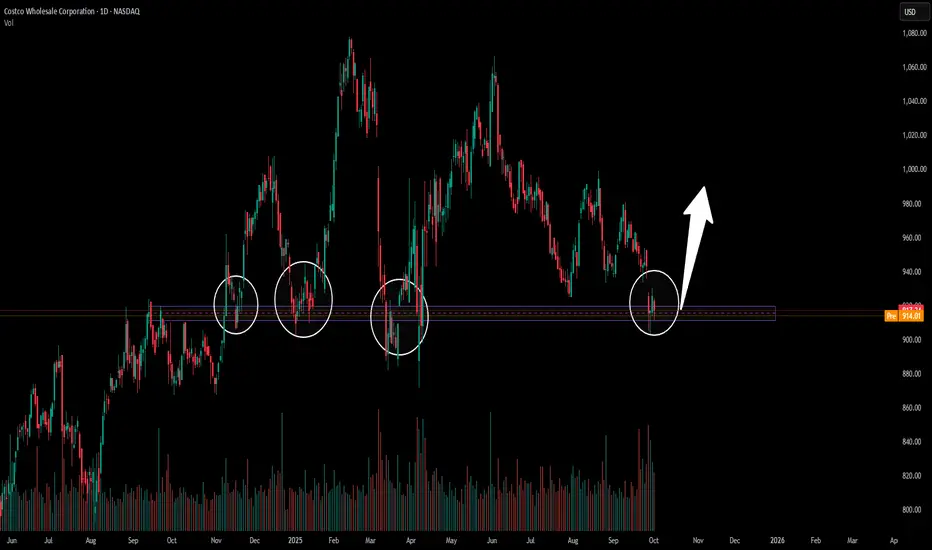
Costco AnalysisThe price has now touched a major support level, one that has already proven its strength multiple times in the past. Each time price reached this zone, it reversed strongly to the upside, showing that buyers consistently step in here.
From my perspective, I think the same scenario could play out again — with the support holding and price starting another reversal move upward, just as it has done in the previous touches.
🎯 Conclusion: My view leans bullish — Costco is sitting on a strong historical support, and I expect a potential reversal from here, similar to prior reactions. Still, markets are unpredictable, and this remains only my view.
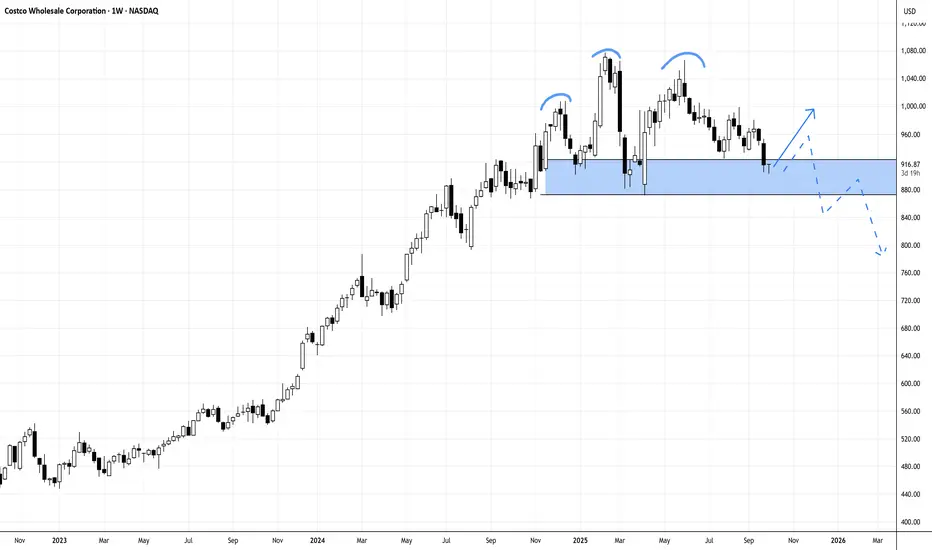
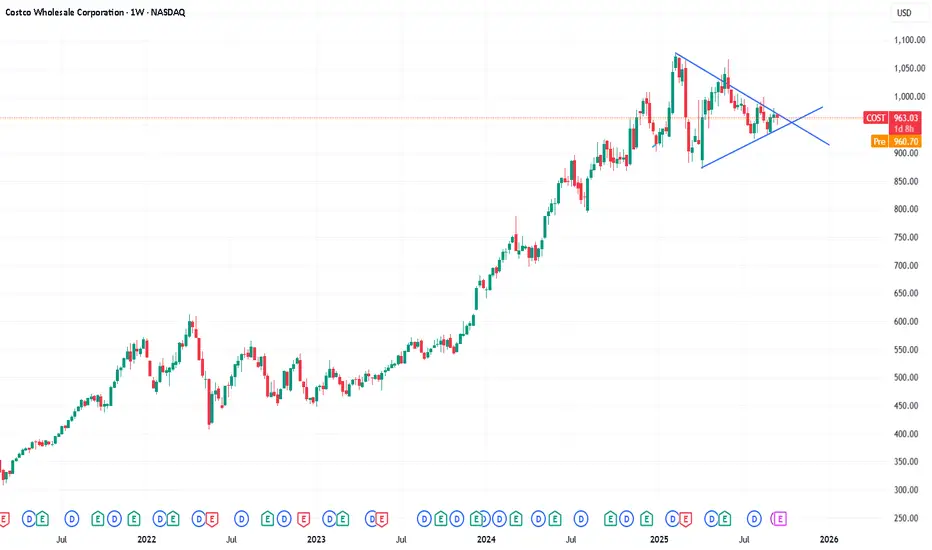
COSTCO NEEDS TO AVOID BREAKING H-n-S TO CONTINUE ITS UPSIDE RALLCostco (COST) has posted another strong fiscal year, with revenue climbing to $86.2B and net income up to $5.49B. However, the weekly chart is showing a developing head-and-shoulders pattern threatens the upside momentum, and price must hold above 871 with a rejection candle this week to avoid a deeper breakdown. A close below that level could confirm bearish continuation, despite Costco’s solid fundamentals.
N.B!
- COST price might not follow the drawn lines . Actual price movements may likely differ from the forecast.
- Let emotions and sentiments work for you
- ALWAYS Use Proper Risk Management In Your Trades
#cost
#nasdaq
#nyse
Costco bullish triangle pattern break outCostco bullish triangle pattern break out. Costco earnings will complete triangle pattern
COST SHORT **UPDATE**My personal thoughts on COST. I always have my
3 step rule before entering a trade or a reason why i
believe in the direction.
1. We have a weekly head and shoulders
2. Closing out and rejecting the upside on the daily
and currently working on the weekly candle.
3. Fib target of 923.36. From a lot of back testing the
levels are respected where the strength of direction.
In this case its downside.
I am not genie! Just taking from what I've learned
over the years! If we break these smaller supports
it definitely has a shot at 863

COST SWING SHORTMy personal thoughts on COST. I always have my
3 step rule before entering a trade or a reason why i
believe in the direction.
1. We have a weekly head and shoulders
2. Closing out and rejecting the upside on the daily
and currently working on the weekly candle.
3. Fib target of 923.36. From a lot of back testing the
levels are respected where the strength of direction.
In this case its downside.
I am not genie! Just taking from what I've learned
over the years! If we break these smaller supports
it definitely has a shot at 863

What Does Costco's Chart Say Heading Into Earnings?Bulk-retailing giant Costco NASDAQ:COST is set to release fiscal Q4 earnings this week at a time when the stock has fallen more than 10% after hitting an all-time high in February. What does technical and fundamental analysis say could happen next?
Let's check things out:
Costco's Fundamental Analysis
COST touched a $1,078.23 intraday all-time high on Feb. 13, but lost about 12.5% between then and Monday's $943.26 close.
The retailer plans to release its latest earnings after the bell Thursday, with analysts expecting $5.81 in GAAP earnings per share on $86.1 billion of revenue.
If the results play out in that way, those numbers will reflect a 9.8% gain from the $5.29 GAAP EPS that COST reported in the year-ago period. Revenues will have risen about 8% from the $79.7 billion seen in fiscal Q4 2024.
Costco's year-over-year sales growth has been running in the high single digits percentage-wise for several quarters now.
Despite this single-digit growth rate, COST was trading at about 52x its 12-month forward earnings estimate at last check. By comparison, the S&P 500 was trading at 22.4x forward earnings, while key competitors Walmart NYSE:WMT and Amazon NASDAQ:AMZN were trading at 39x and 35x, respectively.
In other words, the market highly values large retailers that sell at scale, but it might not take much for any or all of them to undergo a valuation reset.
Meanwhile, of the 28 sell-side analysts that I found that cover COST, 11 have lowered their earnings estimates since the quarter started, while just three revised those estimates higher. (The rest left their numbers unchanged.)
Costco's Technical Analysis
Now let's look at COST's chart going back to late 2024:
Look in the center of this chart and you'll see a smallish "double-bottom" pattern of bullish reversal that occurred last spring, marked with a green jagged line.
This took place inside a much larger "double-top" pattern of bearish reversal that spanned from very early 2025 into this summer, as marked with the pink shaded area.
While these patterns didn't work to perfection, both still produced a market reaction for COST that was close to what they predicted.
So, what now?
If you look at the double bottom's second low and the double top's second high (marked "Top 2"), you can see a large pennant formation (marked with the purple "Pennant" box at the chart's right).
What do pennants often foretell? Increased volatility, that's what.
They're not directional indicators -- but as they close, that closure often produces an explosive reaction by a stock either upward or downward.
Meanwhile, Costco's Relative Strength Index (the gray line at the chart's top) is as neutral as neutral gets.
The daily Moving Average Convergence Divergence indicator (or "MACD," marked with black and gold lines and blue bars at the chart's bottom) is also pretty flat, with all three components running together.
In addition, the stock is running in line with both its 21-day Exponential Moving Average (or "EMA," marked with a green line above) and 50-day Simple Moving Average (or "SMA," denoted by a blue line).
That has likely more or less coiled up both the swing crowd and professional managers for a move following this week's earnings release. After all, COST has moved an average over the past three quarters of $34 on the day following its earnings report.
That said, the stock is trading south of its 200-day SMA (the red line), putting an upside pivot ($976 in the chart above). There is no similar nearby downside pivot.
An Options Option
Options traders who are bullish on COST but trying to cap risk going into earnings might set up a simple bull-call spread in this scenario.
Here's an example using Monday morning's pricing:
-- Buy one COST Sept. 26 $950 call for about $17.20.
-- Sell (write) one COST Sept. 26 $980 call for roughly $6.65.
Net Debit: $10.55.
The trader in this example is spending $10.55 to try to gain up to $30. The maximum loss would be the net premium spent. The maximum gain would be a 184% profit.
Those who are bearish might consider a bear-put spread. Example:
-- Buy one COST Sept. 26 $940 put for about $15.
-- Sell (write) one COST Sept. 26 $910 put for roughly $5.50.
Net Debit: $9.50.
This trader would be risking $9.50 to try to gain up to $30. The maximum loss would be the net premium spent. The maximum gain would be a 216% profit.
(Moomoo Technologies Inc. Markets Commentator Stephen “Sarge” Guilfoyle had no position in COST at the time of writing this column.)
This article discusses technical analysis, other approaches, including fundamental analysis, may offer very different views. The examples provided are for illustrative purposes only and are not intended to be reflective of the results you can expect to achieve. Specific security charts used are for illustrative purposes only and are not a recommendation, offer to sell, or a solicitation of an offer to buy any security. Past investment performance does not indicate or guarantee future success. Returns will vary, and all investments carry risks, including loss of principal. This content is also not a research report and is not intended to serve as the basis for any investment decision. The information contained in this article does not purport to be a complete description of the securities, markets, or developments referred to in this material. Moomoo and its affiliates make no representation or warranty as to the article's adequacy, completeness, accuracy or timeliness for any particular purpose of the above content. Furthermore, there is no guarantee that any statements, estimates, price targets, opinions or forecasts provided herein will prove to be correct.
Options trading is risky and not appropriate for everyone. Read the Options Disclosure Document ( j.moomoo.com ) before trading. Options are complex and you may quickly lose the entire investment. Supporting docs for any claims will be furnished upon request.
Options trading subject to eligibility requirements. Strategies available will depend on options level approved.
Moomoo is a financial information and trading app offered by Moomoo Technologies Inc. In the U.S., investment products and services on Moomoo are offered by Moomoo Financial Inc., Member FINRA/SIPC.
TradingView is an independent third party not affiliated with Moomoo Financial Inc., Moomoo Technologies Inc., or its affiliates. Moomoo Financial Inc. and its affiliates do not endorse, represent or warrant the completeness and accuracy of the data and information available on the TradingView platform and are not responsible for any services provided by the third-party platform.

$COST - squeeze continues to build?We looked at COST a few weeks back and wondered if the trend line and MA would provide support - which they ended up doing. However, there's been no move higher, and price continues to squeeze whilst hanging on to the trendline. NASDAQ:COST has earnings on Thursday after close - could that be the catalyst for a move higher....or the straw that breaks the camels (trendline) back?

COST making an ascending triangleLooking at the yearly chart of Costco, there is an ascending triangle formed. Hope it breaks price above $965!
LONG COSTBeen dormant for quite a while now, but with a pennant like this and earnings coming up, a breakout seems likely.

#cost Bullish trend reversalsupport : support at 940 holding and confirms Bullish trend.
key levels to watch
resistance : 990-1000 break above this level gains momentum to target level : 1050
# cost bullish

COST AT INFLECTION POINT - BOUNCE HIGHER OR BREAK SUPPORT?Like many people I've used Costco a fair bit over the summer. As a business I'm fascinated by it, and a supporter (mostly). As a trader I look at this chart and see us forming lower highs, bearish engulfing candles, bounces off $1000 levels, and now beneath the Weekly 50MA. Can this supporting trendline hold, and offer a bounce? Or will it break, and see COST move lower? Presently I'm more bearish.

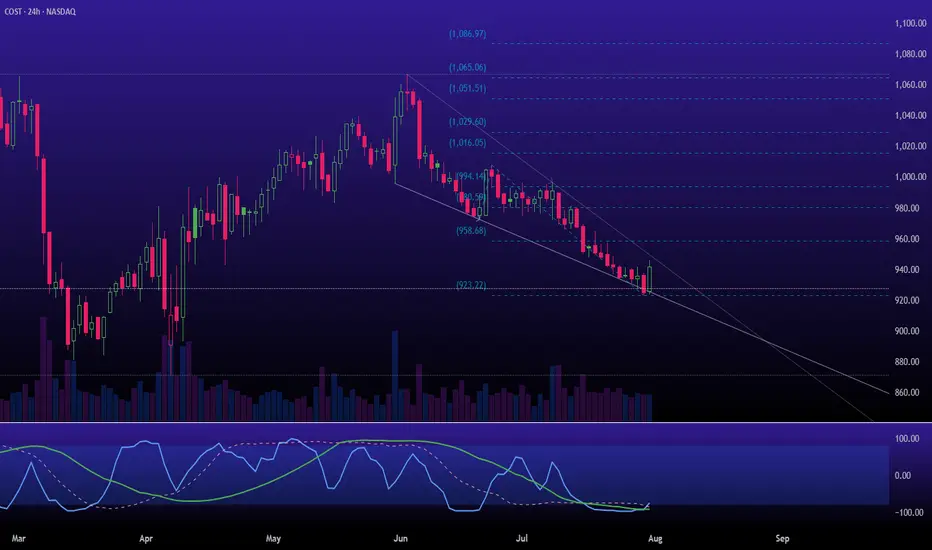
$COST is transiting from the Markup to the Accumulation (A)The squeezing and oversold momentum readings suggest the markdown is losing steam and "stopping action" may be occurring. We could be witnessing the area where a Selling Climax or preliminary support forms. I'm not looking for a new all-time high, but a trip to test resistance seems likely.
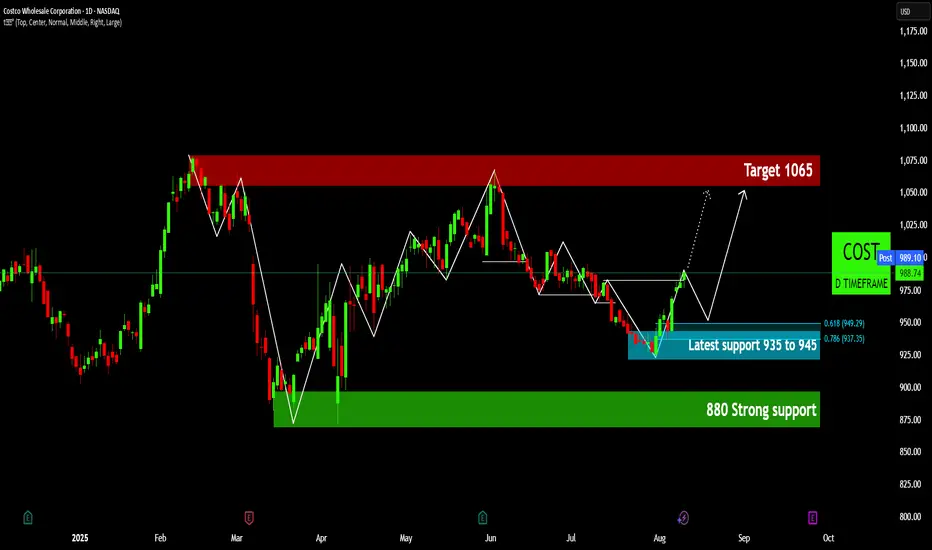
COST: Building a Base for Breakout!Costco's Clear Path: Targeting $1065!
www.tradingview.com
www.tradingview.com
Costco Wholesale Corporation (COST) is exhibiting a compelling bullish setup on the daily timeframe, following a significant recovery from key support levels. The price action suggests a strengthening foundation and a clear trajectory towards previous highs.
•Robust Foundation: COST has demonstrated significant resilience, bouncing decisively from a pivotal $880 strong support zone. This level has proven to be a robust demand area, establishing a firm base for the stock's recent upward trajectory and highlighting strong institutional interest at lower valuations. 🏗️
•Constructive Reversal: More recently, a significant reversal commenced from the 'Latest support' zone, roughly between 920−940. This area, notably validated by key Fibonacci retracement levels, signals a powerful resurgence of buying interest, indicating a clear shift from bearish consolidation to bullish momentum. ✨
•Momentum & Consolidation : The stock is currently demonstrating strong upward momentum. While a minor consolidation or a healthy pullback to retest the newly established support within the 'Latest support' zone is a distinct possibility, such a move would be constructive. It would serve to solidify the recent gains and provide an even more stable launchpad for the next leg higher. 🚀
•Clear Upside Target: With robust support foundation and strong buying impetus, the primary upside objective for COST is the $1065 target zone. This region represents significant overhead resistance, aligning with previous highs, and offers a compelling near-term price target for this upward trajectory. 🎯
•Strategic Considerations: For traders and investors, maintaining focus on the integrity of the 'Latest support' (~920−940) is crucial. A sustained break below this area might challenge the immediate bullish outlook, though the deeper '880 Strong support' would serve as a formidable last line of defense, potentially offering long-term accumulation opportunities. ✅
Disclaimer:
The information provided in this chart is for educational and informational purposes only and should not be considered as investment advice. Trading and investing involve substantial risk and are not suitable for every investor. You should carefully consider your financial situation and consult with a financial advisor before making any investment decisions. The creator of this chart does not guarantee any specific outcome or profit and is not responsible for any losses incurred as a result of using this information. Past performance is not indicative of future results. Use this information at your own risk. This chart has been created for my own improvement in Trading and Investment Analysis. Please do your own analysis before any investments.
COSTCO looking to end its ABC corrective waveNASDAQ:COST saw a potential end to its ABC corrective structure after it has formed a potential symmetrical triangle/larger pennant. Strong bullish marobozu was seen closing above the conversion and base line of the ichimoku. The breaking out of the falling wedge also highlights more potential upside. Key resistaance will eb closely watched at 1,002 and should it rejects adversely, the stock could formed a 5-wave (ABCDE) structure going forward.
Stochstic Oscillator has formed an oversold crossover potentially while 23-period ROC has risen and is attempting to break above the zero line. Volume remain in a healthy expansion.
Target is at 1,061 should 1,002 breaks. Long term target is at 1,133 and 1,231.
COSTCO Looking for a bottom to fuel rally to $1250.Last time we looked at Costco (COST) was 6 months ago (January 21) when we gave the most optimal buy signal exactly at the bottom of the Channel Up at the time, easily hitting our $1045 Target:
Since then, the stock has entered a new Accumulation Phase in the form of a Triangle and this week broke below its 1W MA50 (blue trend-line), which is where its previous bottom (Higher Low) was formed.
The last similar Triangle pattern was formed straight after the May 16 2022 market bottom and once it broke upwards it led to a massive rally. Even the 1W RSI sequences between the two fractals are similar.
Our Target is $1250, just below the 1.786 Fibonacci extension.
-------------------------------------------------------------------------------
** Please LIKE 👍, FOLLOW ✅, SHARE 🙌 and COMMENT ✍ if you enjoy this idea! Also share your ideas and charts in the comments section below! This is best way to keep it relevant, support us, keep the content here free and allow the idea to reach as many people as possible. **
-------------------------------------------------------------------------------
💸💸💸💸💸💸
👇 👇 👇 👇 👇 👇

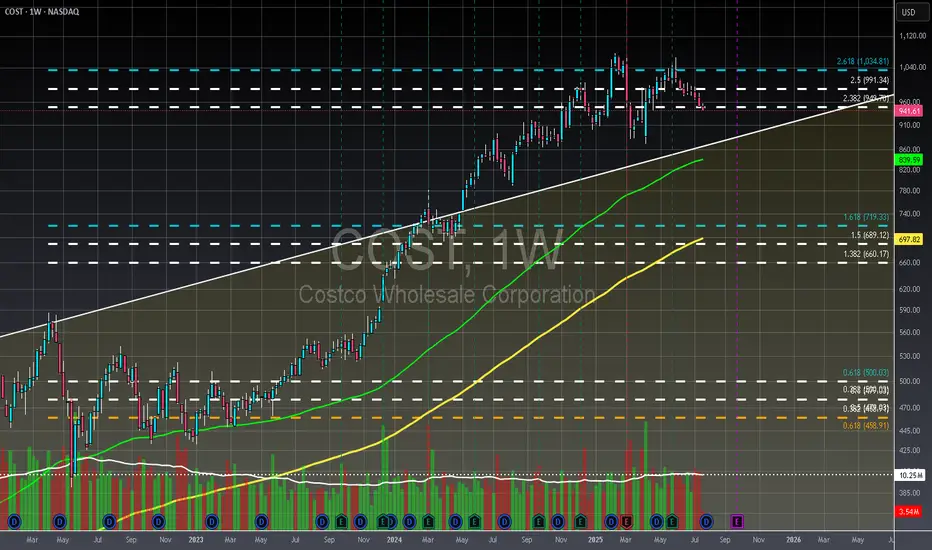
COST - Weekly - OverboughtCostco is currently trading outside a monthly channel it has been in since 1992, which could signal strong demand or overzealous traders. If Costco fails to break the $1034 Fibonacci level, considered the golden target for bulls, a reversal is likely, potentially leading to a return to the 100-period weekly moving average. Despite these trading observations, Costco's financials are robust, showing consistent year-over-year revenue growth and stable net income over the past four years, reinforcing its strong reputation. Major investors in Costco include Vanguard, State Street, and Morgan Stanley.
Not financial advice, always do your due diligence
Leave a like👍 and/or comment💬.
We appreciate and value everyone's feedback!
- RoninAITrader