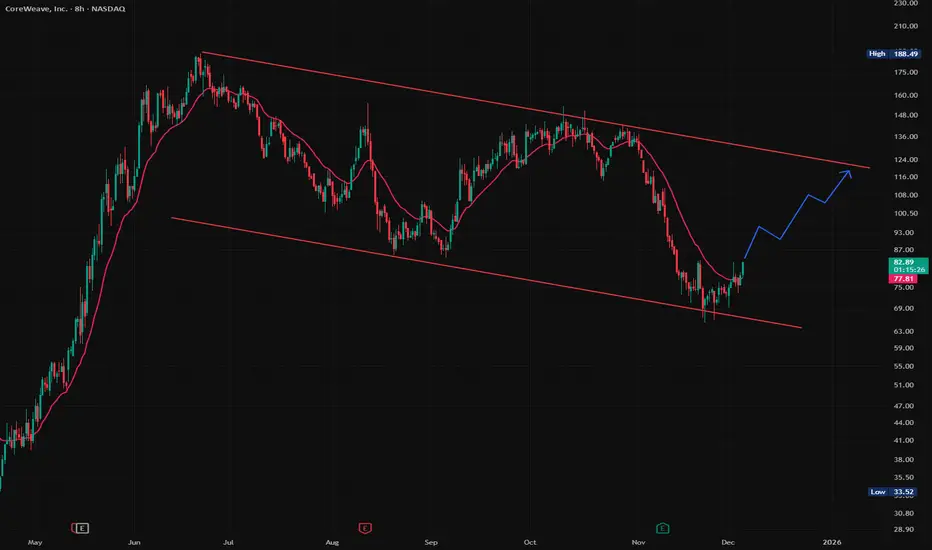
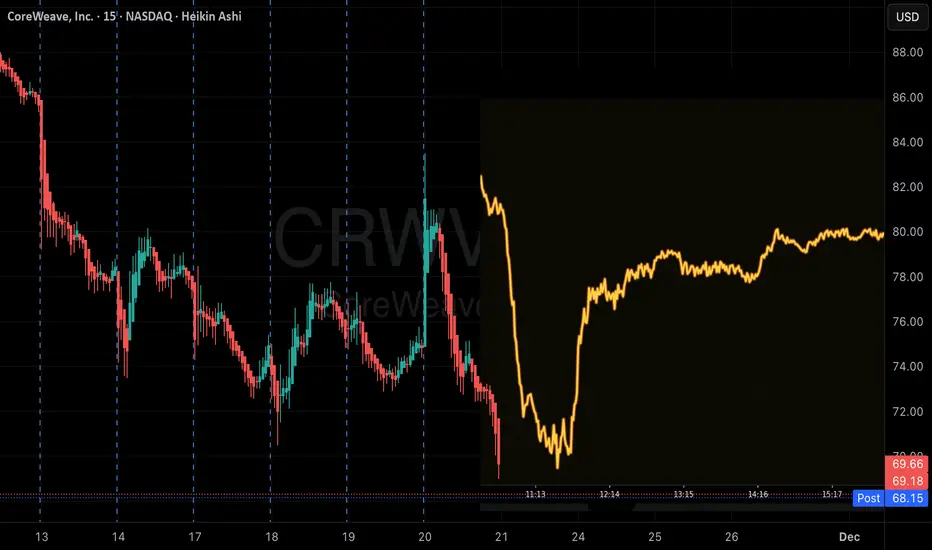
$CRWV Price overshot the channel’s parallel line,Bought NASDAQ:CRWV
Price overshot the channel’s parallel line, and these moves usually mean-revert to test the other side.
It’s been one of the hotter names this year, so it’s likely still on a lot of traders’ watchlists.
Trade ideas
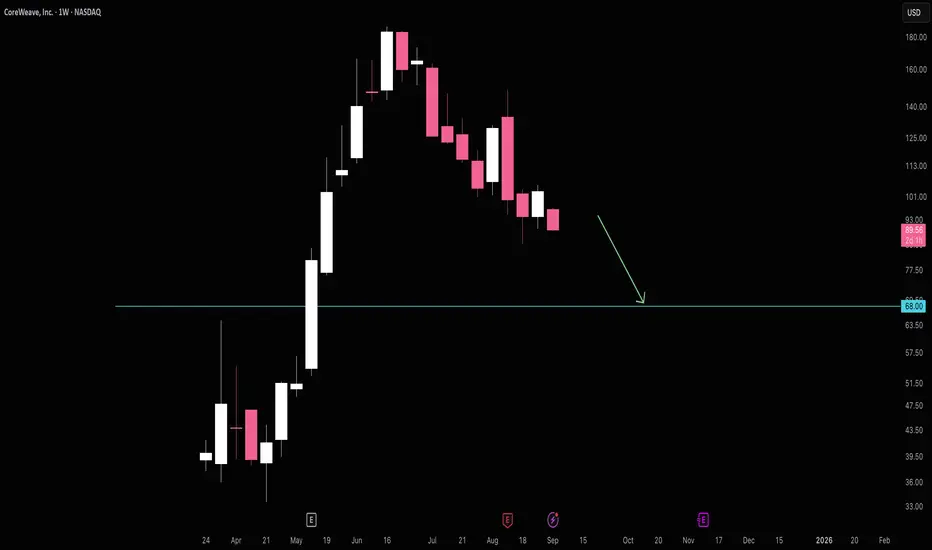
CRWV: A patient planCRWV:
.
A patient plan
Will you be patient enough to catch this plan?
.
US STOCKS- WALL STREET DREAM- LET'S THE MARKET SPEAK!

$CRWV Riding the AI Infrastructure Wave on a Leveraged TightropeCoreWeave, Inc. (CRWV) has rapidly ascended as a central and controversial figure in the AI infrastructure landscape. Often categorized alongside other "neoclouds" like IREN, which have pivoted aggressively towards AI workloads, CoreWeave exemplifies the explosive potential and inherent fragility of businesses built to capitalize on the generative AI boom. Its stock performance, characterized by dramatic surges and sharp corrections, has become a direct proxy for the market's oscillating hopes and anxieties surrounding AI's near-term profitability.
As of late November, shares traded at approximately $73.12, a level that reflects both the company's staggering reported growth and the significant risks embedded in its financial structure.
The Bull Case: A Critical, Scalable Enabler in a Supply-Constrained Market
The bullish thesis, as articulated by analysts like Bernardo on Level-Headed Investing, centers on CoreWeave’s role as a vital intermediary in a high-demand, supply-constrained ecosystem.
Strategic Positioning and Scalability: CoreWeave has successfully positioned itself as a specialized, high-performance cloud provider exclusively for GPU-intensive workloads, primarily generative AI training and inference. With a reported fleet of over 250,000 NVIDIA GPUs across 33 data centers, it operates at a scale that few competitors can match outside the major hyperscalers (Microsoft Azure, Google Cloud, AWS). This allows it to act as a crucial overflow and specialized partner for those very hyperscalers when their own capacity is limited.
Hyperscaler Partnerships and Validation: The company’s growth is undeniably impressive, with revenue reaching $1.9 billion in 2024 and $1.2 billion in Q2 2025 alone. This trajectory is fundamentally tied to landmark partnerships with technology titans. Most notably, Microsoft accounted for 62-71% of revenue during this period, a double-edged sword that also serves as powerful validation of CoreWeave's technical capability and strategic importance. Similar contracts with Google and Amazon underscore its role as a key enabler in the AI arms race.
Secular Demand Tailwind: Bulls argue that the demand for AI computational power is a secular, long-term trend that is still in its early innings. As AI models grow larger and more pervasive, the need for efficient, scalable infrastructure like CoreWeave’s is expected to compound, providing a multi-year runway for growth.
The Bearish Counterpoint: Structural Vulnerabilities and a Commodity Trap
However, a deep dive into the financials reveals a business model under tremendous strain, painting the growth story in a more cautious light.
The Profitability Mirage: While revenue soars, profitability remains elusive. The company posts substantial GAAP net losses, driven by immense depreciation charges, interest expenses, and relentless capital expenditures. A headline Adjusted EBITDA margin of 62% is misleading; it adds back the massive depreciation on its GPU fleet, a very real economic cost. Crucially, cash flow from operations is deeply negative, revealing a core disconnect: the business is growing on paper but consuming, not generating, cash.
A Leveraged House of Cards: CoreWeave’s expansion is almost entirely debt-financed. With total borrowings of $11.17 billion, its balance sheet is leveraged against its primary asset: GPUs. This financing relies heavily on Delayed-Draw Term Loan (DDTL) facilities, where credit is extended based on the value of future customer contracts. This creates a perilous cycle: growth requires new debt, which is secured by new contracts, which require more GPUs, which depreciate rapidly. The model is acutely vulnerable to any disruption in demand or credit markets.
Customer Concentration and Hardware Obsolescence: The extreme reliance on Microsoft represents an existential risk. Any slowdown, renegotiation, or insourcing of capacity by Microsoft could immediately trigger a liquidity crisis. Furthermore, the business is trapped in a perpetual capital expenditure loop. NVIDIA’s relentless innovation cycle (e.g., Blackwell GPUs replacing Hopper) means CoreWeave’s core assets are constantly depreciating, forcing it to reinvest nearly all its incoming cash into new hardware just to stay competitive, with no residual profit.
Lack of a Moat: Critics argue CoreWeave’s service is fundamentally a commodity—it rents access to another company’s (NVIDIA’s) chips. It lacks a proprietary software ecosystem, a loyal developer community, or unique intellectual property that would create customer stickiness. Its primary advantage, scale, is expensive and replicable by well-capitalized entrants.
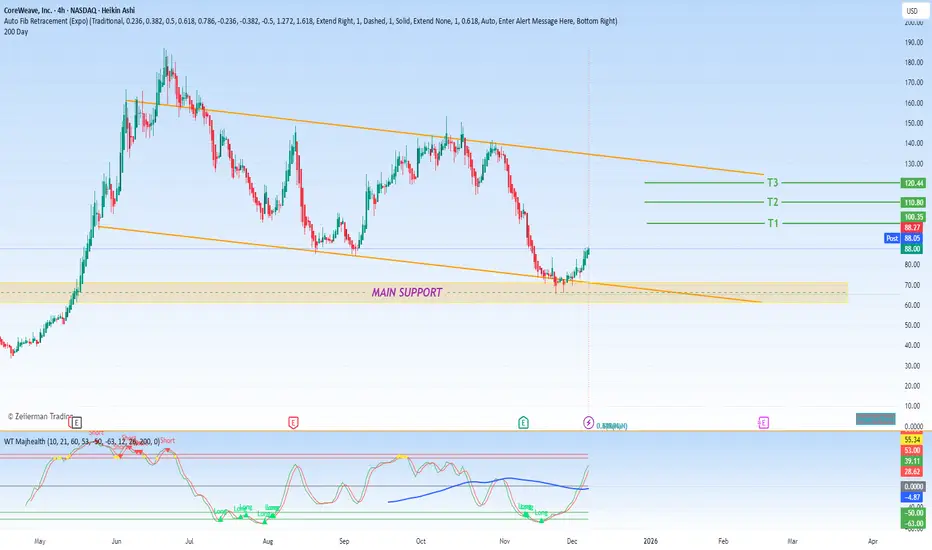
Technical Perspective and Price Targets
From a technical analysis standpoint, the $60 - $70 zone is identified as a critical primary support area. This region is expected to be a major battleground between bulls defending the long-term thesis and bears focusing on financial fragility.
On the upside, the bullish trajectory projects three key take-profit targets:
Target 1: $100 – A breakout level representing a significant advance and a test of prior highs.
Target 2: $110 – A further extension signaling sustained momentum.
Target 3: $120 – An ambitious target that would imply a successful navigation of near-term risks and a market re-rating based on proven execution towards profitability.
Conclusion: A High-Stakes Bet on Execution and Endurance
In summary, CoreWeave represents a quintessential high-risk, high-reward investment within the AI megatrend. The bullish thesis rests on its irreplaceable role as a scalable infrastructure provider in a supply-constrained market, validated by elite partnerships. The bearish perspective warns of a structurally flawed business model burdened by extreme leverage, customer concentration, and the relentless financial treadmill of hardware obsolescence.
The investment decision ultimately hinges on a belief in management’s ability to use its current scale and partnerships to bridge towards sustainable cash flow and a more diversified client base before a shift in the credit cycle or AI demand curve exposes its vulnerabilities. For investors, CRWV is not merely a bet on AI demand, but a specific bet on CoreWeave’s financial engineering and operational execution in the face of monumental fixed costs and debt obligations.
CRWV Neutraldemand Zone, not fresh
Long entry 89
Stop 83,
Target 130
Risk management is much more important than a good entry point.
I am not a PRO trader.
In my trading plan, the Max Risk of each short term trade should be less than 1% of an account.

CRWV Weekly Signal: Bearish Momentum Triggers PUT SetupCRWV — Weekly Options / QuantSignals Katy Analysis (2025-11-28)
Symbol: CRWV
Current Price: $73.12
Expiry: 2025-12-05 (7 days)
📈 Katy Forecast & Signal
Direction: BUY PUTS
Confidence: 65% (Medium)
Predicted Move: $73.12 → $70.46 (-3.64%)
Trend: Neutral (Katy) / Bearish Momentum
Weekly Momentum: -2.31%
Time Series Analysis: Gradual decline through Dec 2nd; lowest point $68.01
💰 Trade Setup
Strike Focus: $70.00
Entry Price: $4.90 – $5.50 (mid $5.20)
Target 1: $8.32 (+60%)
Target 2: $10.60 (+104%)
Stop Loss: $3.75 (-28%)
Position Size: 3% portfolio
Delta: 0.671
⚠️ Risk & Considerations
Moderate Risk Warning: Medium confidence → consider reducing position size
Gamma Risk: Low (weekly expiry)
Options Flow: Neutral → limited institutional activity
Volatility: VIX 17.19, normal range
Katy-LLM Conflict: LLM recommends BUY CALLS; Katy clearly signals PUTS
🔍 Technical Notes
VWAP: $72.42 → near-term resistance
Weekly Range: $66.00 – $76.60
Volume: 6.7× average → distribution
Sector Sentiment: Tech sector cautious, AI hype concerns
TradingView Chart Insights
CRWV sitting in bearish consolidation
Potential support near $70, resistance at VWAP $72.42
Bearish momentum confirmed by weekly decline and volume spikes

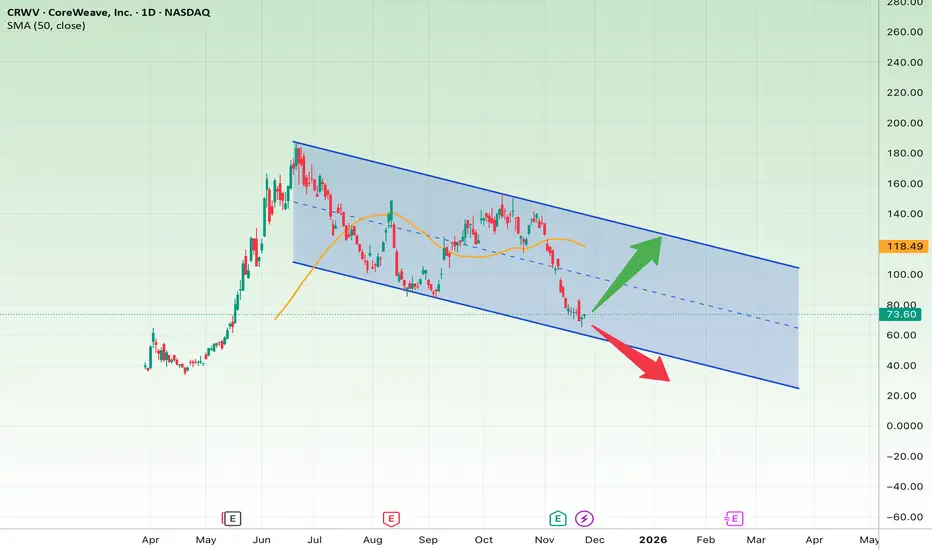
Is CRWV Ready for a Major Rebound—or a Bigger Crash?The chart shows CRWV moving inside a downward trending channel, and the price is now touching the bottom of the channel, where it has shown a mild bullish reaction. This zone can offer a good risk-to-reward long opportunity, but only if the lower boundary holds.
Bullish Scenario (if price holds above the channel bottom)
As long as CRWV stays above $68–$72:
• Target 1: $90
• Target 2: $105
• Target 3: $118 (top of the channel)
Bearish Scenario
If the price breaks below $68:
• Downside target: $50
• Extended bearish target: $30
Stop-Loss
• A confirmed break below $68 with strong bearish volume
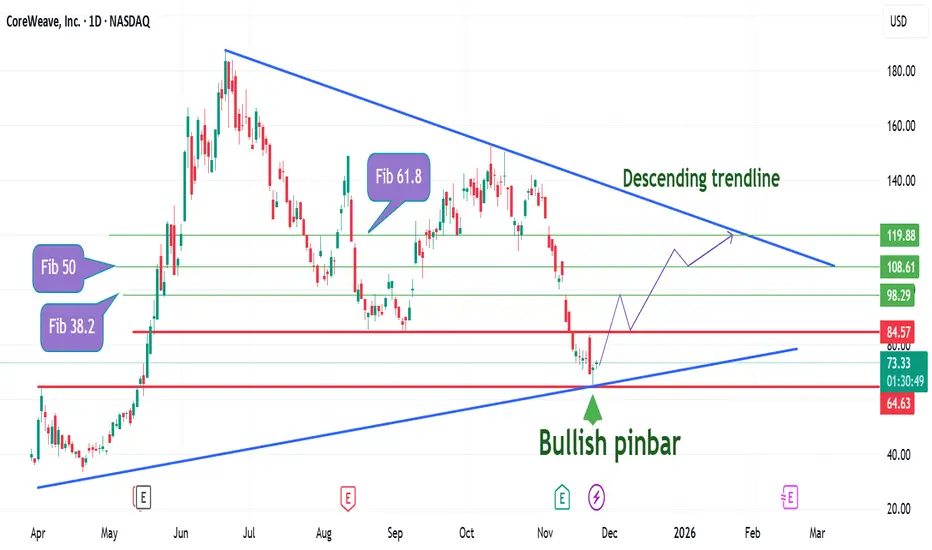
CoreWave Inc. Technical Analysis and Mid-Term OutlookCoreWave Inc. Technical Analysis and Mid-Term Outlook
CoreWave Inc. has reacted to a key confluence zone formed by horizontal support and an ascending trend line.
A bullish pin bar has also developed at this confluence area, as shown on the chart. This pattern is an important price-action signal and may indicate potential upward momentum.
My Technical Outlook:
I expect buying pressure at the current market price (CMP) to push above the next resistance zone aligned with the 23.6% Fibonacci retracement level. If price successfully breaks and sustains above this level, the asset may advance further toward the descending trend line highlighted on the chart.
This setup aligns with a mid-term to multi-month trade outlook, given the presence of three significant Fibonacci levels within this projected move.
Trade Potential: 16% – 60%
I am ridding of the CMP
As always, caution is advised when navigating market volatility and key reaction zones.
CrwvWhat do yall think look like a 3 wave correction here! i think big moves are ahead for this stock either way!

Coreweave - Bullish rebound likely as corrective structure ends?NASDAQ:CRWV corrective structure is likely ending after the stock has rebounded above the 100.00% Expansion of wave A-B, with a bullish hammer and an inside bar. RSI is in an oversold zone. If bullish follow through is to happen, the first target will be at 106.00 and subsequently at 210.00

Looking to long CRWV at $60Previously I was bearish on coreweave, and wow did that cause some strife in the comments, but I've closed my short yesterday and now looking to long $60.
Good luck!

QuantSignals V3 AVGO | High-Probability Bear PlayAVGO QuantSignals Katy 1M Prediction | 2025-11-20
Current Price: $371.19
Final Prediction: $363.96 (-1.95%)
30min Target: $368.47 (-0.73%)
Trend: BEARISH
Confidence: 73%
Volatility: 36.5%
📊 Trade Signal:
Direction: PUT
Entry: $371.19
Target: $365.41
Stop Loss: $376.76
Expected Move: -1.95%
Analysis Summary:
Katy AI predicts a moderate bearish trend over the next month.
Technical indicators and options flow suggest downside potential.
Short-term target ($368.47) may see minor pullback before continued decline.
Trade Setup:
Expiry: 1 Month
Position Size: Moderate, manage risk due to volatility
Risk Level: MODERATE-HIGH
Notes:
Monitor for reversals near $365.41 support.
Stop loss at $376.76 protects against unexpected upward moves.
Quantsignals V3 CRWV PUT| Catch the downtrend/breakdownCRWV QuantSignals Katy 1M Prediction | 2025-11-20
Current Price: $82.99
Final Prediction: $81.43 (-1.87%)
30min Target: $82.34 (-0.79%)
Trend: BEARISH
Confidence: 72.5%
Volatility: 130.9%
📊 Trade Signal:
Direction: PUT
Entry: $82.99
Target: $81.74
Stop Loss: $84.23
Expected Move: -1.87%
Analysis Summary:
Katy AI predicts short-term bearish trend with strong momentum downward.
Volatility is high, so risk/reward should be carefully managed.
30-minute target shows minor pullback before continuing decline.
Trade Setup:
Expiry: 1M (approx. 1 month)
Position Size: Small, manage risk due to volatility
Risk Level: MODERATE-HIGH
Notes:
Monitor price action for reversals near $81.74 support.
Stop loss at $84.23 protects against unexpected upward spike.

CoreWeave Set to Drive Lower?📉 NASDAQ:CRWV remains in a strong and clean downtrend, ever since topping out near the $170 region. The chart continues to show a consistent sequence of Lower Highs → Lower Lows, telling us that sellers are still fully in control. Each time the price tried to bounce, it was immediately rejected at clear supply zones , showing how aggressive the sell pressure is.
🔻 The recent breakdown below the September consolidation zone is especially important. That level used to act as a short-term base, but once it failed, the momentum accelerated, pushing CRWV straight into the current $72–76 support area. This zone is weak — not a major structural support — more like a natural pause after a steep selloff.
📊 From here, two main scenarios:
🔵 1. Short-term rebound scenario (blue path)
Price might attempt a relief bounce from this support. If it does, the logical area for supply to step in again is around $95–105, where previous failures and liquidity sit. If rejected there, CRWV likely forms another Lower High and resumes its downtrend.
🔴 2. Direct continuation lower (red path)
If price fails to hold above $72, the sell momentum could accelerate again. The next downside targets sit around $60 or even lower, given the lack of strong support below.
⚠️ For any real trend reversal, CRWV needs to reclaim $110+, break structure, and form a higher high on the daily chart. Before that happens, the overall bias remains bearish.

CoreWeave Falling to $68CoreWeave seems to be falling towards $68 support. It's hard to say if $68 will hold, but it's absolutely a good area to close shorts for a potential bounce.
CRWV has yet to form any long term trend lines that I can find. Perhaps this will come from a bounce off $68.
Good luck!
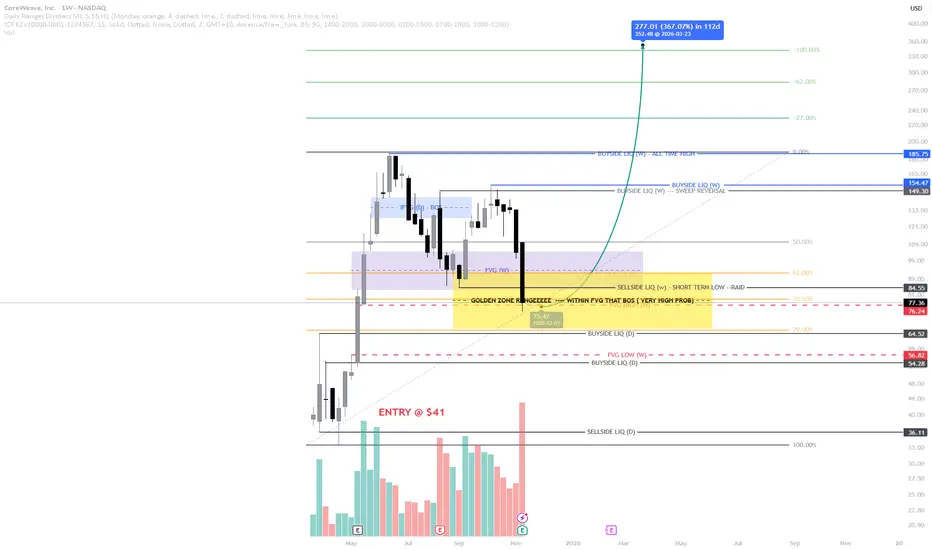
Is This the Last Dip Before CoreWeave’s Next Leg Up? Fundamental View:
CoreWeave (NASDAQ: CRWV) remains one of the most watched AI-infrastructure plays, powering GPU cloud services used by NVIDIA, OpenAI, and multiple large-scale AI firms.
Recent billion-dollar expansions with both partners have reinforced its role as a backbone for AI compute, but after a parabolic rally, valuations look stretched — making any retracement zone highly valuable for accumulation.
Technical View:
Price clearly respected the short-term FVG and swept buyside liquidity at $149.50, closing the weekly candle below it — a classic sign of a liquidity sweep and potential correction.
The drop toward $84.55 tagged the sell-side liquidity and entered a major FVG + OTE golden zone (range $93–$65).
This aligns with the Fibonacci discount area from the previous impulse move, creating a high-probability reaction zone if bullish confirmation appears in the coming weeks.
Outlook:
If we see a strong bullish weekly candle from this level, it could signal the last discounted price range before CoreWeave re-enters its expansion phase.
However, failure to hold above this golden zone could invite deeper retracement.
Patience and confirmation are key before scaling in — this may genuinely be the “last chance to get CoreWeave”, but as always, DYOR and manage risk.
⚠️ Disclaimer: For educational and entertainment purposes only. Not financial advice. Always do your own research.
The absolute bottom of Coreweave Coreweave is showing signs of bottoming out at 79.xx mark. All 5 waves of wave C on multiple time levels, weekly, daily and hourly looks complete, RSI is oversold and Bollinger band is broken.
Time to go long.

$CRWV– Complex Kilroy Structure Extension & Pre-Earnings SetupAfter its IPO, CoreWeave ( NASDAQ:CRWV ) exploded from $39 to $187, marking an impressive +380% gain in just a few months. However, after two missed earnings reports, sentiment cooled, leading to a broad retracement and multi-month consolidation. The upcoming earnings release could prove pivotal in determining whether NASDAQ:CRWV breaks higher or continues its base-building phase.
Daily Chart Structure
On the daily timeframe, NASDAQ:CRWV continues to evolve within a complex Kilroy Bottom — a variant of the inverted head-and-shoulders pattern, but now featuring two heads and a third right shoulder forming.
The first head sparked a brief but powerful rally.
The second head produced another strong reaction before fading back into range.
The second right shoulder retraced into September gap liquidity, touching the Ichimoku Cloud and lower Bollinger Band before rebounding.
The third right shoulder is now forming with stronger volume off the base, suggesting renewed accumulation interest despite broader market hesitation.
This evolving structure implies persistent demand absorption and the potential for a re-accumulation phase before a decisive move.
Gap Behavior & Market Sentiment
Historically, both prior gaps filled quickly — a signal of fragile trend conviction.
However, the most recent pre-market gap (10/11/25) has held its ground so far, supported by rising volume from the current right-shoulder base.
This indicates improving short-term sentiment, with buyers defending structure earlier in the move.
The key battleground remains the $148–$149 zone, aligning with:
The neckline of the full Kilroy structure
The upper boundary of the recent consolidation range
The high-volume node on the right-hand profile
The downtrend line from prior highs
A close above $149, confirmed by volume expansion, would complete the formation and open the door toward prior highs.
Support & Risk Levels
Below current price, structure now defines new levels for trade planning:
$133–$135: Minor support / previous gap-fill area
$119.5: Local reaction level and pivot zone
$104: Updated structural base of the current right-shoulder complex — must hold to maintain pattern integrity
$85: Deep retracement zone if sentiment turns sharply risk-off
As long as the third right shoulder continues to hold above $104, the broader bullish bias remains technically intact.
Technical Summary
✅ Pattern: Complex Kilroy Bottom (2H / 3RS)
✅ Trend: Stabilizing within a re-accumulation phase
📊 Key Resistance: $148–$149 (neckline + volume barrier + trendline)
⚠️ Support: $133 → $119 → $104
🎯 Upside Targets (if confirmed):
• $187 → Post-IPO high retest
• $217 → Full 1:1 measured-move projection
🔍 Trigger: Break and close above neckline with expanding volume
Final Notes
CoreWeave remains a volatile post-IPO growth play — technically constructive yet sentiment-sensitive.
The third right shoulder, coupled with rising buy-side volume and a holding pre-market gap, reflects emerging accumulation pressure. Confirmation, however, will hinge on whether price can reclaim the $148–$149 fenceline and sustain momentum above it.
A successful breakout would validate the entire Kilroy base, targeting the $187–$189 zone, while the $217 measured-move objective remains contingent on strong post-earnings follow-through.
For educational and technical analysis purposes only.

CoreWeave Bounce Long Setup Expecting a bounce from 85-86 level as we have seen from previous price action.
I didnt plan as far as expecting a double bottom, just taking advantage of CRWV volatility and visible point of interest for a bounce, can also ve a dead cat bounce so taking this into account as well.
We have 3 price targets, the first one is the most conservative with 2:1 RR.
I am playing it like that:
First target will close 1/2 or 2/3 of position size, and will let the rest (considering market conditions) attempt to reach the other targets with a trailing stop.
From a RR perspective thats a trade I will almost most definitely always take.
This trade should take between 1-5 days tops!

CrwvCalls are worth less now this scam doesnt seen to stop going Down . This is the last support of they break it then this goes to zero and bankrupt . Obv looks Solid I don’t lnow why it keeps dropping maybe waiting for the government to re open ? Rsi is very oversold . Expecti g a pullback to at léast 110

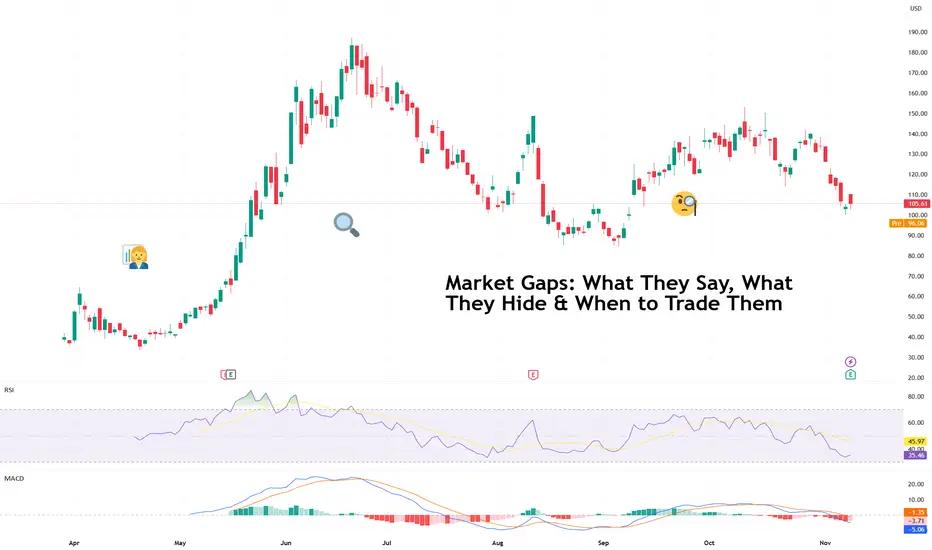
Market Gaps: What They Say, What They Hide & When to Trade ThemIt’s 9:30 a.m. You sip your coffee, glance at the chart, and there it is. Your stock has leapt several dollars higher (or lower), skipping right over the previous day’s closing price.
Welcome to the world of market gaps — those mysterious spaces between yesterday’s close and today’s open that make traders question both their strategy and their life choices.
A market gap isn’t a missing candle but the story of what happened while you were sleeping (or ignoring the news). It’s the sum of after-hours trades, global market sentiment, overnight earnings, and sometimes a rogue tweet.
The question is: should you trade them — or stay far, far away?
🌍 Why Gaps Happen
Gaps exist because markets never really sleep. When one exchange closes, another is already open somewhere else, digesting the same news through a different timezone. Add in pre-market trading, futures markets, and weekend surprises, and you get an ecosystem where prices constantly readjust (even when you can’t click “Buy”).
Most gaps fall into one of three categories:
Breakaway gaps – when new information changes everything (earnings beats, mergers, surprise rate cuts).
Runaway gaps – the “momentum monsters” that happen mid-trend when traders can’t get enough.
Exhaustion gaps – the final gasp before a reversal, when optimism or panic reaches peak saturation.
Understanding which one you’re looking at is half the battle. The other half? Not taking the bait too early.
💥 What Gaps Reveal (and Conceal)
We’re in the earnings season now so it’s pretty normal to spot a gap on the charts.
A gap higher often signals optimism: strong earnings, bullish guidance, or a macro tailwind. But it can also mean traders are front-running euphoria — piling in before the market can catch its breath.
Similarly, a gap lower screams heavy selling, but sometimes it’s just overreaction dressed as disaster. Take for example the recent showing from CoreWeave NASDAQ:CRWV . The neocloud beat on both top- and bottom-line expectations. And yet, the stock fell 8% in after-hours .
Typically, if prices hold above or below the gap for several hours or sessions, that’s confirmation that traders are validating the move. But if it’s filled quickly (the price retraces back to the previous close), it means the reaction faded faster than your New Year’s resolution.
🕳️ The Weekend Trap
Weekend gaps deserve their own warning label. Markets close Friday afternoon, and by Monday, the world’s had 48 hours to produce headlines, scandals, or White House drama.
If you hold high-risk positions over the weekend, you’re effectively saying, “I’m okay with the market repricing everything I own before I wake up Monday.” Sometimes that works — you wake up richer. Sometimes it doesn’t — and your stop-loss never had a chance.
Fast fact : Stop losses don’t work during a gap because the price jumps over your stop level — there’s no trading in between, so your order can only trigger at the next available price, often far worse than expected.
🧭 How (and When) to Trade Gaps
So how do pros handle them? Like most things in trading — with patience, context, and a healthy respect for traps.
Wait for confirmation . Don’t chase the open. See if volume supports the gap or if it’s just knee-jerk volatility.
Look left . Check past support/resistance levels — gaps tend to gravitate toward old battle zones.
Mind the news . If the gap is driven by an actual event (earnings, guidance, policy change), the odds of it holding improve. Make sure to stay on top of market-moving news .
Avoid FOMO . The first 15 minutes of trading are often chaos. Let the emotional traders clear out before you step in.
Remember the fill rule . When in doubt, assume gravity wins eventually — most gaps don’t stay open forever.
🔮 What Gaps Really Mean
Gaps are the market’s way of saying, “Something happened — pay attention.” They’re emotional, fast-moving, and occasionally misleading. But they also reveal where sentiment can truly shift — the moments when traders collectively decide that yesterday’s price was wrong.
Handled well, gaps can offer some of the cleanest trades on the chart. Handled poorly, they’re an expensive lesson in humility.
So the next time you wake up to a market that’s sprinted ahead, take a breath. The space between two candles isn’t a void. It’s a story. Read it before you react.
Off to you : How do you handle gaps? Share your approach to these market events in the comments!
CRWV: price at local support zonePrice has reached a local support area where a potential higher low might start forming. I don’t yet have clarity on the larger-degree structure, but the market’s reaction to earnings on Monday should provide more evidence to work with.
Ideally, I’d like to see a move up toward the 145–157 zone, followed by a higher low to establish a new base. Alternatively, if price fails to hold above the 115–130 resistance area, we might be setting up for a move to re-test the September lows. In any case, I’m expecting at least a short-term bounce.
Chart:

CRWV UpdatesThis way it might play out. Complete the wave 2 its time for longest wave 3. When it starts to move everyone will FOMO at top one more time

CRWV Adding calls here if this scam can’t hold this support then it does to 0 . earnings do next week I will hedge the day before earning with short term puts just in case . Obv looks solid I think this will recover next week
